List of Templates
A “Template” holds the design of a specific report by customizing its page settings, header/footer, and log columns. There are two types of report templates:
- Figure Templates: These templates are used for the reports that are generated from Reporting → Other Reports menu. Examples of a Figure Template include cross section figure, test holes locations map, site location map, and photo report.
- Borehole Log Templates: These templates are designed for generating test hole logs using the Reporting → Test Hole Logs page or using the log preview generated on the test hole data entry page.
RSLog comes with a set of default templates for borehole logs and other types of reports. These templates can be edited and customized as necessary.
To access this page:
- Go to the left-hand navigation menu and select Reporting → Report Templates
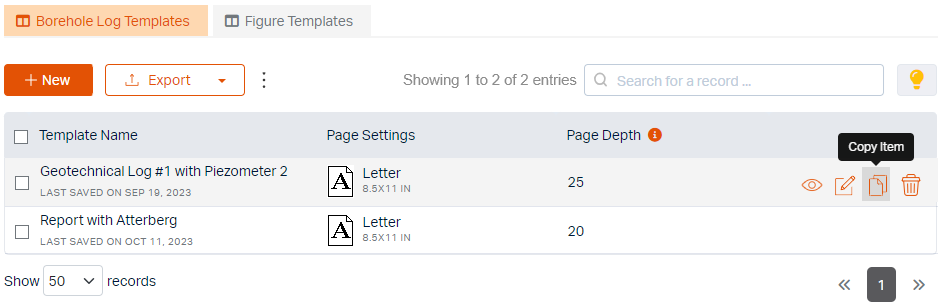
This page comprises two tabs; Each tab shows the list of all relevant templates in a table (working with tables).
Creating a Template
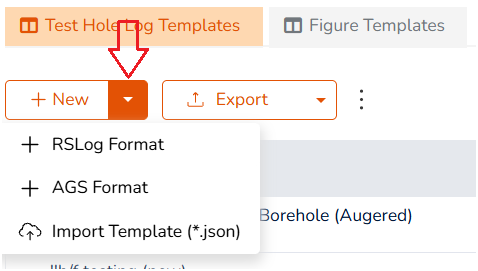
To create your own report template from scratch, click the + New button at the top of the table. Options include:
- RSLog Format: use this option to create a log template,
- AGS Format: this option creates a log template that is compatible with AGS,
- Import Template: this option is used to share template designs between two RSLog account.
Deleting a Template
To delete a template simply hover on that row, and click Delete button that appears at the right end of the row (see the screenshot above).
Copying a Template
To duplicate a template, hover on that row and click Copy Item.
Previewing a Template
To see a preview of a template, hover on that row and click Preview button. The preview only includes the header and footer sections of the template.
About 'Page Depth'
Page Depth determines the depth range used to generate the borehole log (e.g. 20 ft of depth on each page). The unit of the Page Depth is inherited from the unit system of the project for which the borehole log is being generated. You can change the Page Depth on General Settings section of a log template.
Sharing a Template
Templates could be shared between two RSLog accounts (e.g. by downloading a template from a DoT website):
- Importing a Template: in order to import template(s), click the + New split button to open the dropdown menu. Click Import Template menu and upload the template JSON file. Once the file is processed, the new template(s) will be added to your list of templates.
- Exporting a Template: to export a template select the checkbox next to the desired template(s), then click Export button. Select Export Template menu. This will download the selected template(s) in a single JSON file that could be easily shared with other RSLog accounts.