Graph Pile Pushover
The Graph Pile Pushover option allows users to view a graph of Shear Force vs Top Deflection or Axial Force vs Top head deflection.
To graph Pile Pushover:
- Right-click on a pile and select Graph Pile Pushover, or select Other
 > Pile Pushover, use your mouse to select the pile and press Enter.
The pushover analysis is carried out based on the information entered in the Advanced tab of the Add Single Pile  dialog, under the Pushover Analysis section.
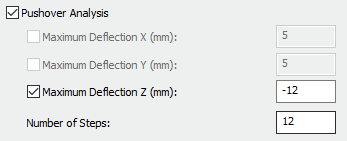
On axially loaded pile analysis:
On laterally loaded pile analysis:
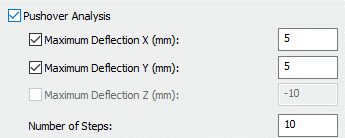
The Pushover Analysis section (shown above) provides different options depending on the chosen analysis type. For example, if users select an axially-loaded pile analysis, they can perform pushover analysis in axial deflection only. Similarly, for laterally loaded piles, they can perform pushover analysis in lateral directions (both X and Y).
The graphs are displayed: Shear Force X’ vs Top Deflection X, Shear Force Y’ vs Top Deflection Y, and Axial Force Z’ vs Axial Head Displacement depending on the load pile analysis type. Users can change the chart data by right-clicking on either of the graphs and selecting Edit Charts for laterally loaded piles. It is important to note that these analyses are uncoupled, meaning the pushover analysis is only conducted in one direction.
CUSTOMIZATION OPTIONS
The right sidebar provides several customization options:
- Chart Controls – Users can customize marker and line options, legend display options, font options and axis options. These customizations apply to all displayed graphs.
- Series Options - Users can customize the graph color, marker type and marker size for each set of results.
- Vertical Axis Options – Users can customize the vertical axis scaling for each individual graph.
- Horizontal Axis Options – Users can customize the horizontal axis scaling for each individual graph.