Plotting Interaction Diagrams
The Plot Interaction Diagram feature allows users to plot Interaction Diagrams for Pile Sections. This feature is available Axial, Lateral and Group Analysis if there are piles with Reinforced Concrete sections.
To plot an Interaction Diagram:
- Select Results > View Interaction Diagram
 . The Interaction Diagrams view will appear.
 - In the Chart tab, go to the Sections field and use the drop down to select the pile sections you want to plot.
- Use the Angle field to enter an angle if its something other than zero.
- Use the Load field to enter your Load value.
- Click Compute

The Interaction Diagram will be plotted and you can see the results:
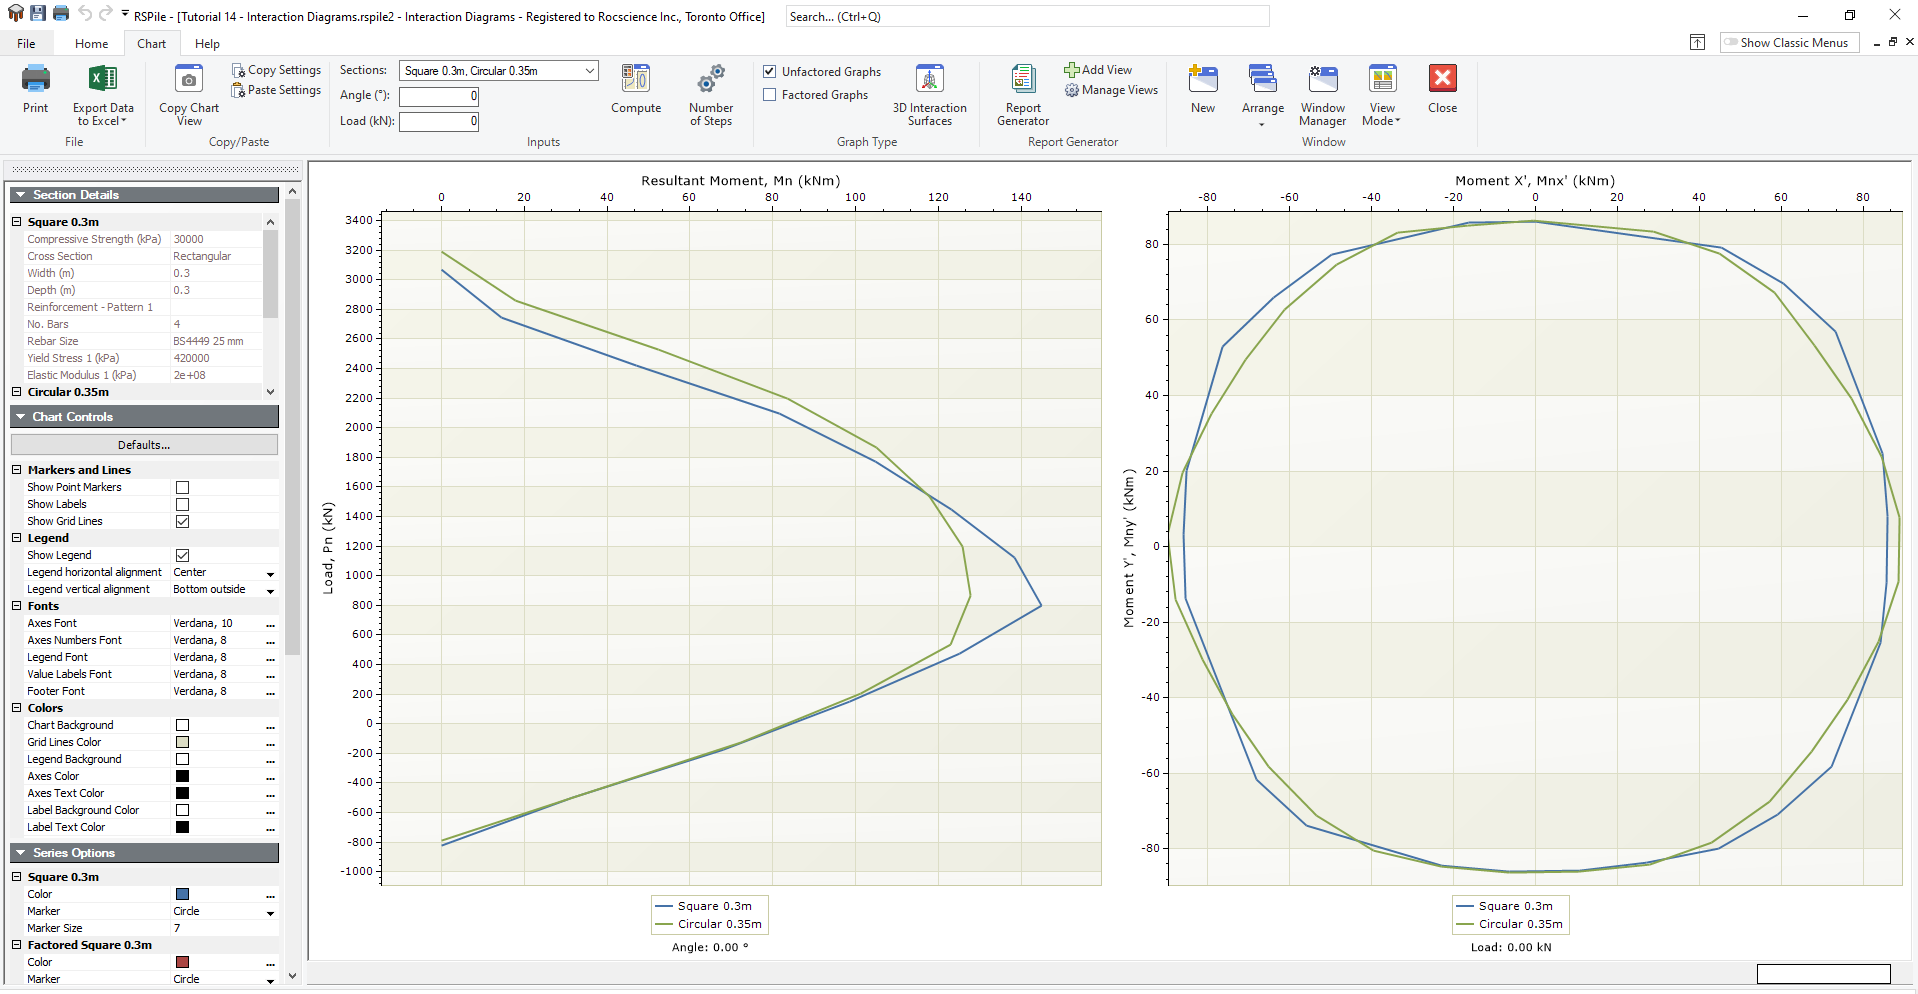
Inputs
After generating the Interaction Diagram, you can use the Inputs section of the Charts tab to update the values in the diagram.
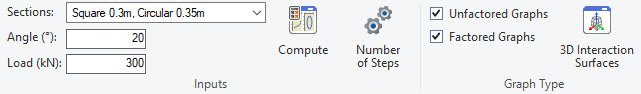
Use the Input options to:
- Change the Angle or the Load using the fields shown above.
- Deselect a Section using the drop down menu.
- Plot Factored and Unfactored Graphs by checking or unchecking the checkbox.
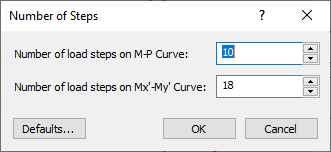
- Change the number of points to construct each plot by clicking Number of Steps

Click Compute after making any change to the above options to recompute the results.
To be sure you don’t lose your previous graphs, export them to Excel before you change the input parameters using the Export to Excel  option.
3D Interaction Surface
The 3D Interaction Surface option allows the user to visualize the 3D surface of the first available reinforced concrete section. Click the 3D Interaction Surface icon to launch a this 3D chart view.