Group Effect
Introduction
Previous experimental studies have determined that, under lateral loading, both single piles and groups of piles exhibit nonlinear behaviour. Nonlinear p-y curves are commonly used to describe laterally-loaded single piles. p-y curves can also be used to analyze groups of piles, however, the p-values must be reduced to take into account the reduction of soil resistance due to the group effect. There are three scenarios used to describe the possible interactions between piles in a group:
- Piles are far enough apart that there is no evident soil-pile interaction
- Piles are close enough together that there is minor soil-pile interaction
- Piles are close enough together that there is significant soil-pile interaction
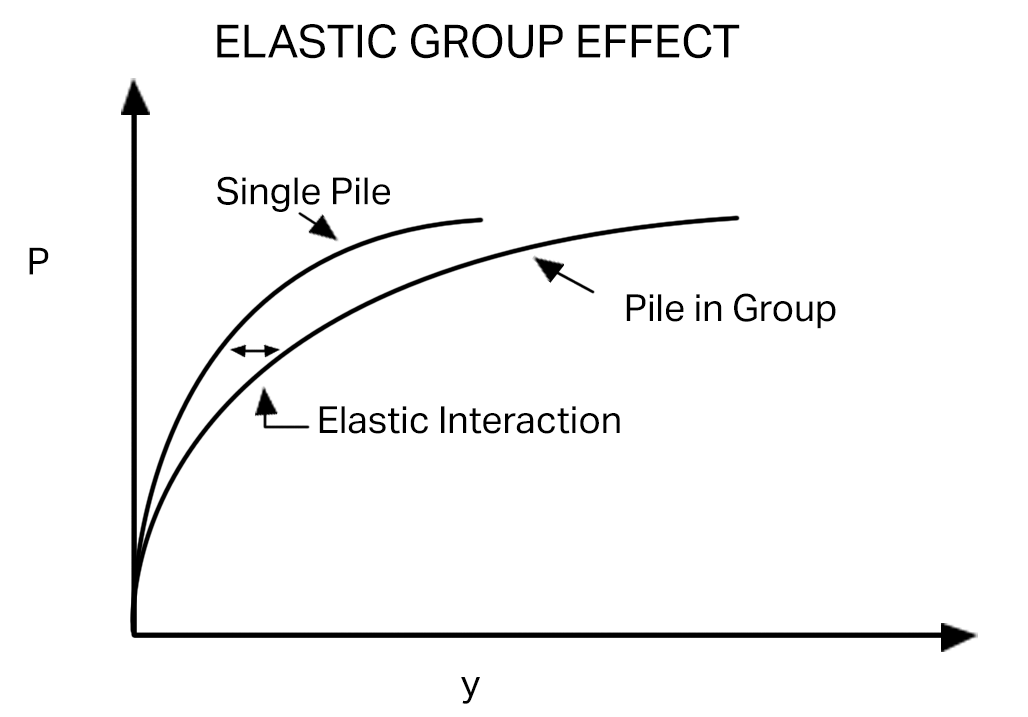
To calculate the minor soil-pile interaction present in the second scenario described above, elastic theory can be used to extend the deflection y for a specific soil resistance p (see Elastic Group Effect figure below). The p-values will reach the same ultimate resistance, regardless of the presence of elastic group action. However, elastic group action requires a larger deflection y to achieve the same ultimate resistance because stresses from piles in close proximity force the elastic deformation of the supporting soil.
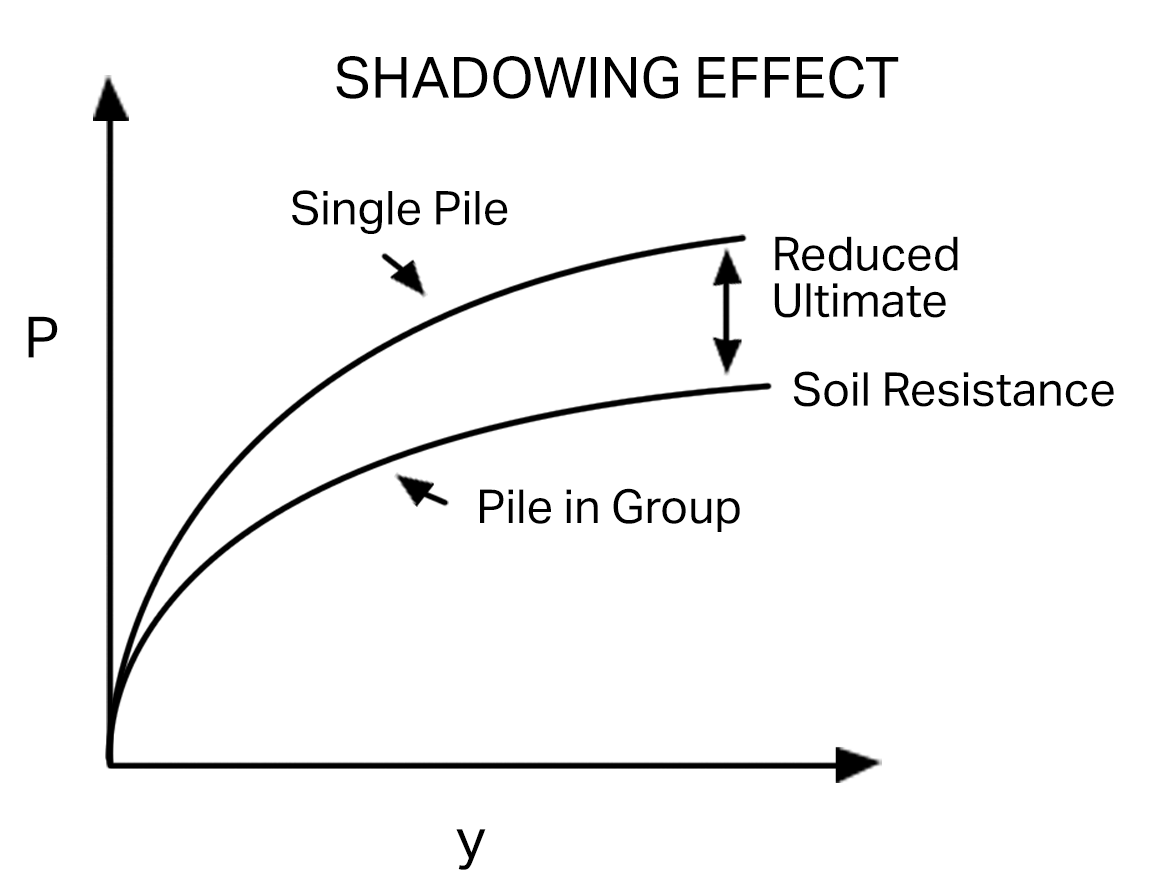
When considering piles that are close enough together to cause significant soil-pile interaction, the ultimate resistance for grouped piles may be lower than that of a single pile due to the overlap of the shear-failure planes from the movement of each pile. A modification factor is required to reduce the ultimate soil resistance (see Shadowing Effect figure below). Elastic behaviour is present (to a minor degree) due to the "shadow" effects that influence the efficiency of individual piles in a group. Loading tests include all effects and can be used to determine the reduction factor (fm) for various pile spacing configurations. However, in the following discussion, the reduction factor (fm) is considered to apply only to soil resistance.
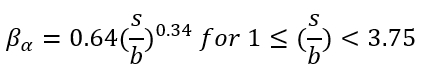
Side-by-Side Reduction Factors
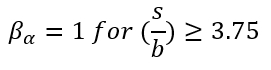
Experimental loading tests were performed on side-by-side piles to determine an appropriate reduction factor. The reduction factor is the ratio of the average capacity of individual piles in a group to the capacity of a single pile (Cox, Dixon, and Murphy, 1984; Prakash, 1962; Want, 1986; and Lieng, 1988). Plotting p-reduction against pile spacing (in terms of s/b; s is the center to center spacing, b is the pile diameter) shows that, when spacing is larger than three times the pile diameter, the reduction is negligible.
Line-by-Line Reduction Factors
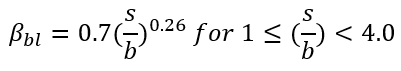
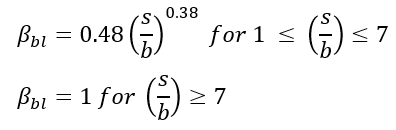
When considering the interaction of piles in the direction of loading, Dunnavant and O'Neill (1986), using data from Cox, Dixon, and Murphy (1984), recommend calculating reduction factors for leading and trailing piles as a function of pile spacing in the direction of loading. The effect of soil properties on reduction factors remains undeterminable. The reduction factors are based on the relative position of piles in the group. Previous studies have suggested that leading piles sustain the largest load, although the discrepancy in the amount of load-bearing between leading piles and singular piles is not clear. Prakash (1962) concluded that trailing pile reduction can be ignored only when s/b is greater than or equal to 8. Additional studies (Cox et al., 1984; Schmidt, 1981; Schmidt, 1985; Lieng, 1988) have suggested that trailing pile reduction can be ignored when s/b is close to 6.
Leading Piles:

Trailing Piles:
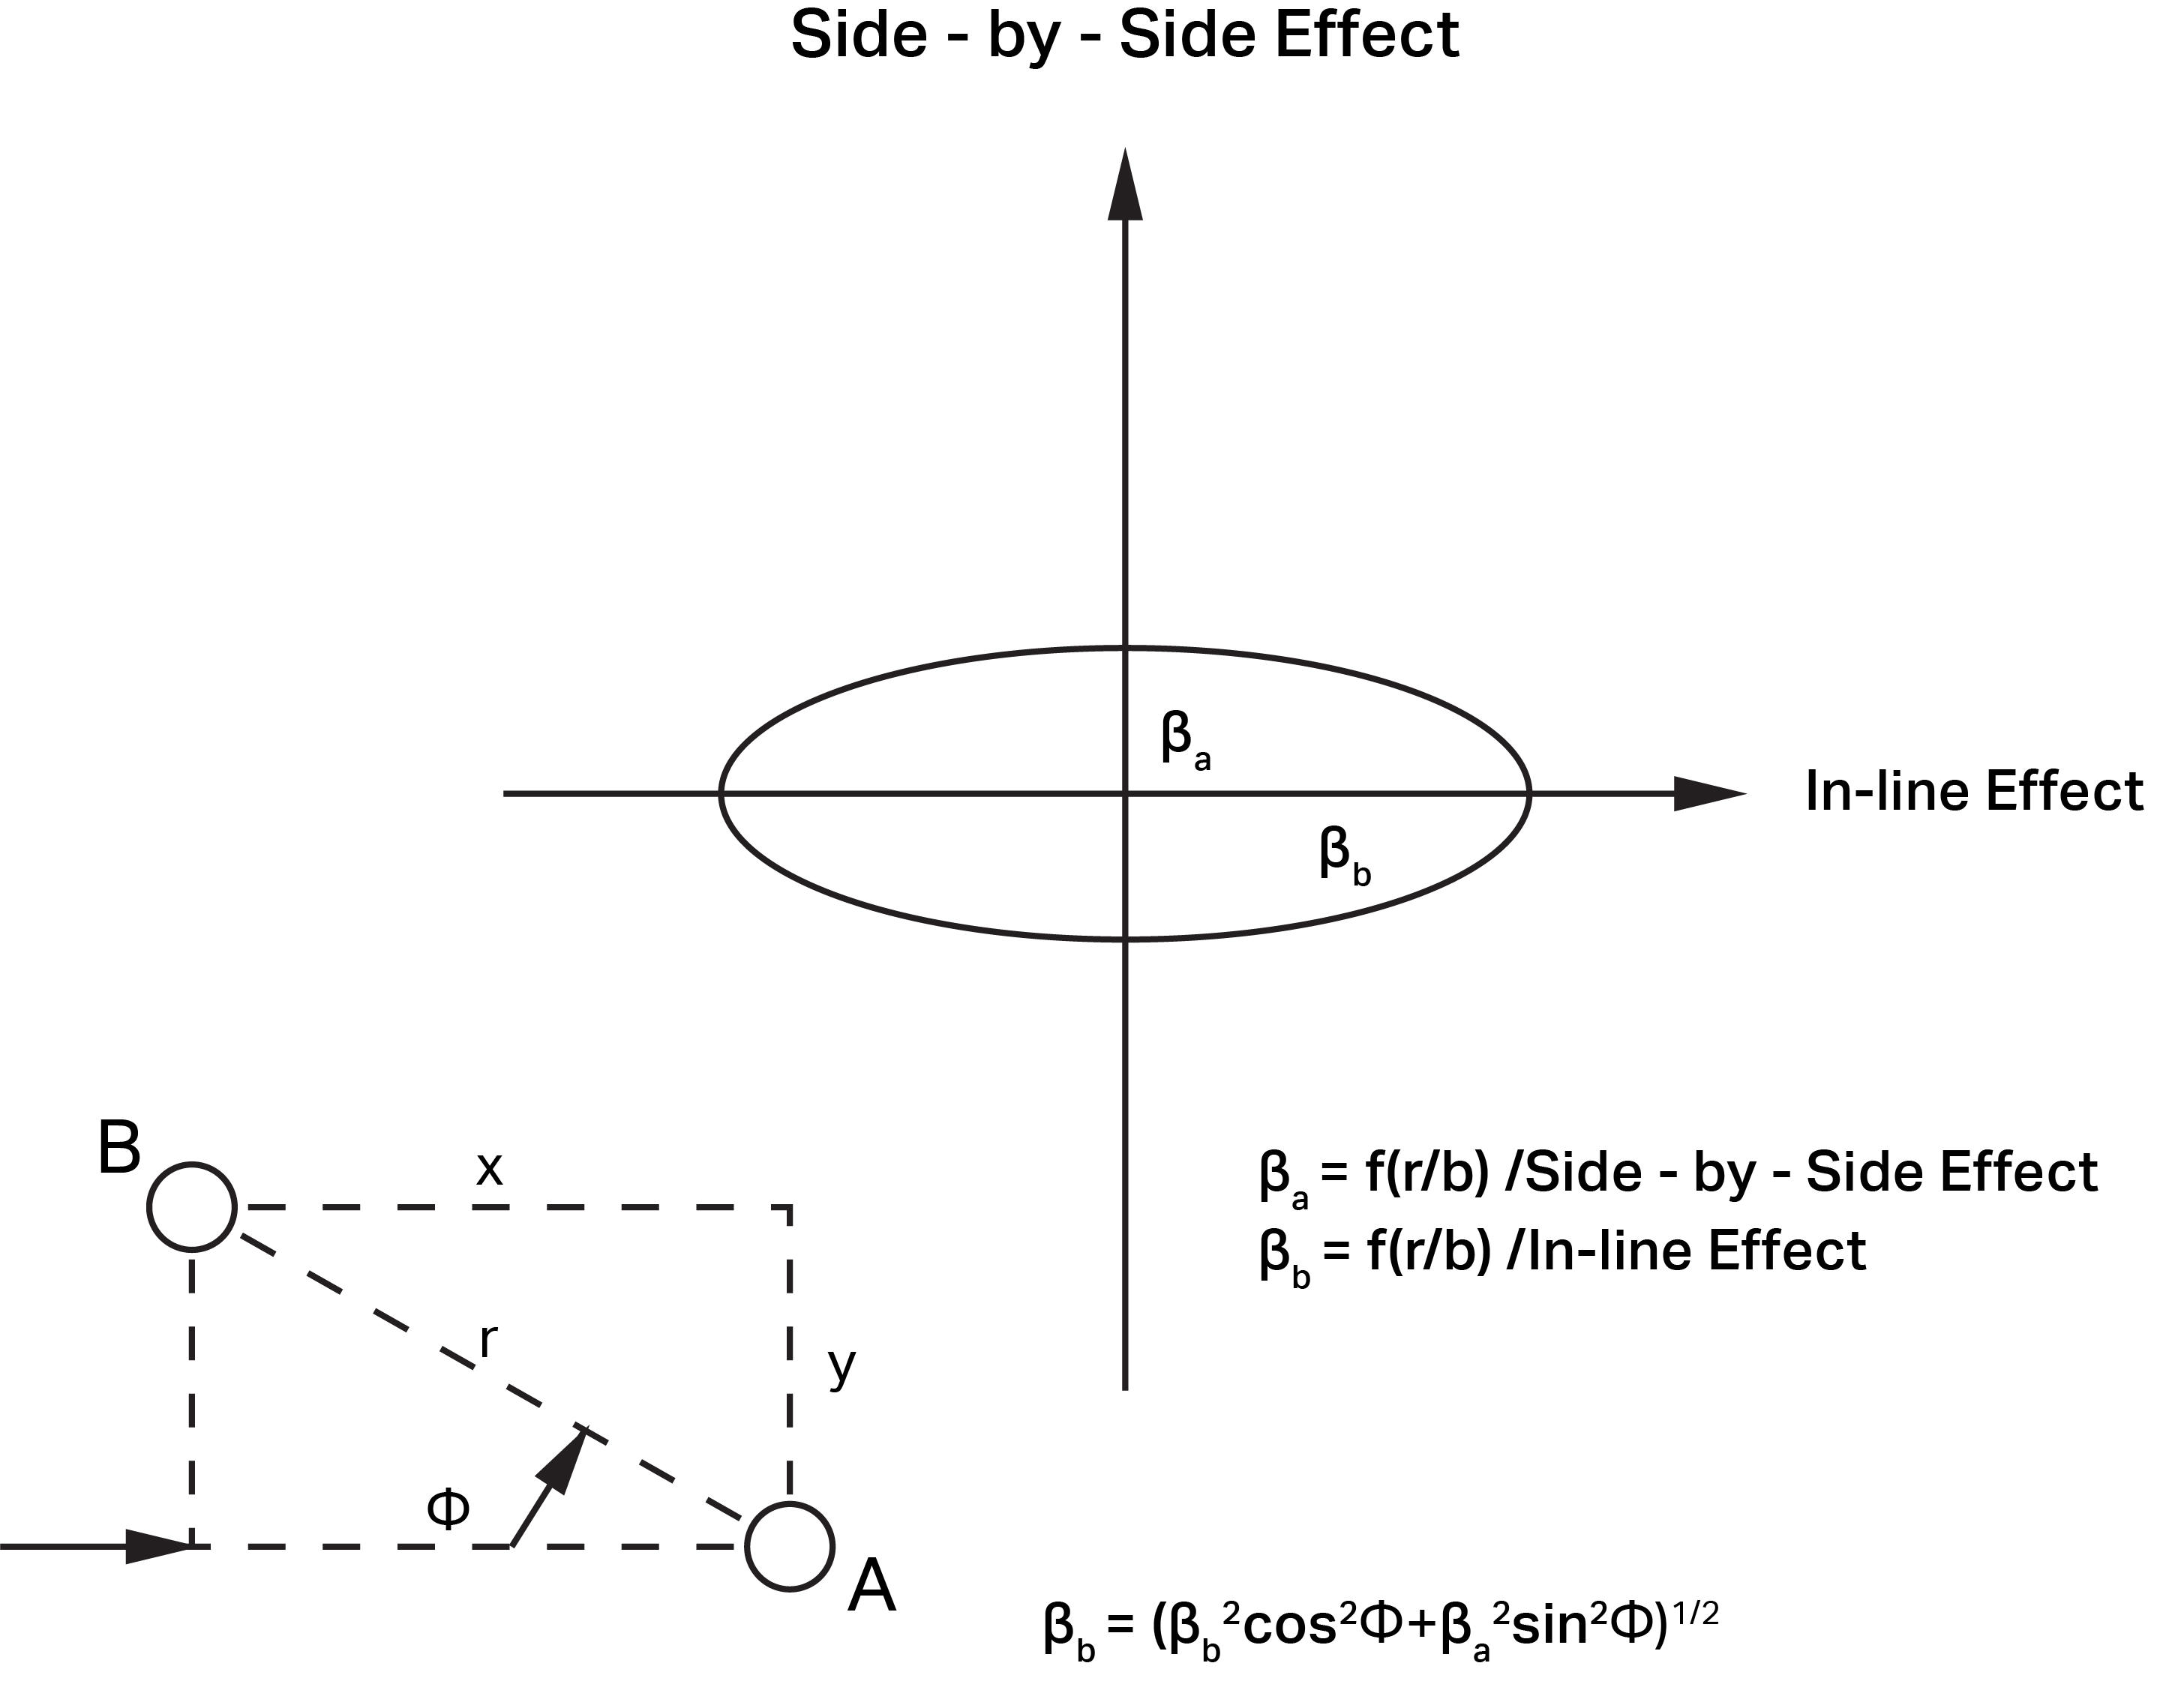
Skewed Piles
Skewed piles are piles that are not in-line or side-by-side relative to the direction of the applied load. To obtain a reduction factor for a skewed pile with respect to another pile, an equation for an ellipse in polar coordinates should be used:
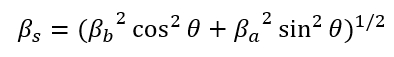
Where: