User-Defined
A user-defined soil model allows the user to input the t-z and q-z curves based on the ultimate skin friction or end bearing resistance and the curve shape. The curve shape is defined by entering stress to max stress ratios for various soil displacements. The stress to max stress ratio is multiplied by the ultimate skin friction or end bearing resistance for a depth to calculate the assumed soil response due to soil displacement. The stress to max stress ratios for each displacement value allows the user to vary the ultimate resistance value along the depth while maintaining the same t-z or q-z curve shape for the material. When the soil displacement exceeds the last (maximum) entered displacement value, the soil resistance is assumed to be the last entered resistance.
- Ultimate Unit Skin Friction: The maximum unit skin friction in that layer. The ultimate unit skin friction is multiplied by the ratio of the unit skin friction (
 ) to ultimate unit skin friction (
 ) to obtain the t-z curve at each depth within the layer. These ratios along with a corresponding soil displacement define the shape of a t-z curve which is essentially the skin friction produced by a soil displacement at a particular depth. The ultimate unit skin friction can be varied within a layer to produce t-z curves with the same shape, but different magnitudes at each depth.
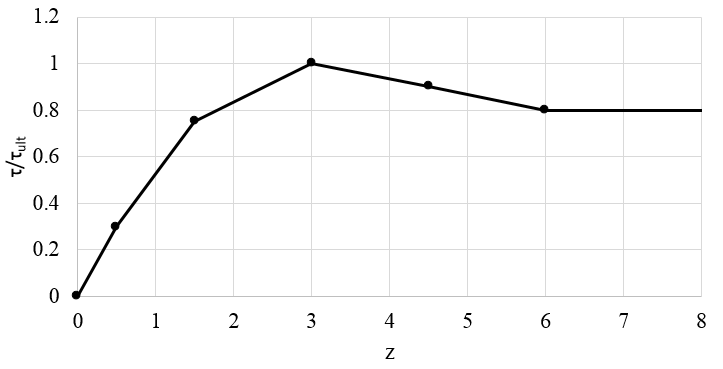
Typical t-z curve - Ultimate Unit End Bearing Resistance: the maximum unit end bearing resistance in that layer. The ultimate end bearing resistance is multiplied by the ratio of the end bearing resistance ( Q) to ultimate end bearing resistance (Qult) to obtain the Q-z curve at each within the layer. These ratios along with a corresponding soil displacement define the shape of a Q-z curve which is essentially the end bearing resistance produced by a soil displacement at the pile toe. The ultimate end bearing resistance can be varied within a layer to produce Q-z curves with the same shape, but different magnitudes at each depth.
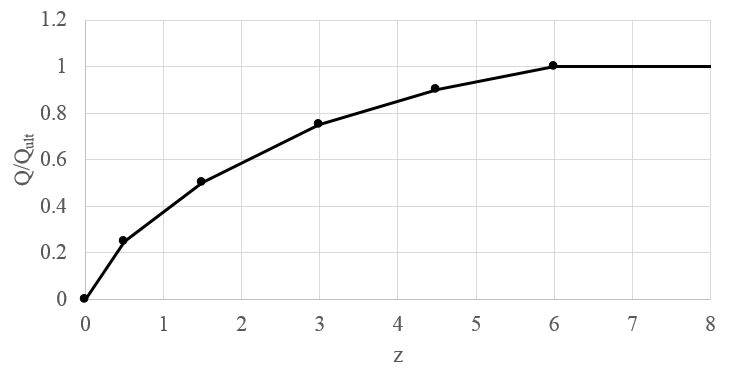
Typical Q-z curve
For more information, see the Axial Analysis Theory Manual.