Graph Pile Length
The Graph Pile Length option (right-click on a pile and select Graph Pile Length), is useful for determining critical pile length and allows users to view a graph of pile head deflection (or any other pile head results) vs pile length. The individual response curves for each pile length can also be viewed in terms of any result.
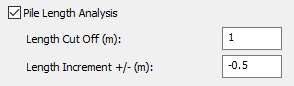
The pile length analysis is carried out based on the information entered in the Pile Length Analysis section of the Advanced tab of the Add Single Pile dialog.
Two graphs are displayed. By default Pile Head Deflection vs Pile Length is displayed on the left, and Displacement vs Depth for each pile is displayed on the right. These graphs can be customized, as outlined in the Customization Options section.
CUSTOMIZATION OPTIONS
The following customization options can be found in the sidebar:
- Data Selection - Checkboxes exist for each analysis and they can be checked on or off to remove individual sets of results from the right graph. Select All and Deselect All buttons are also available.
- Dual Graph Types - The graphs displayed are customized here.
- Left Graph - The following results are available (depending on the analysis being performed): Pile Head Deflection (X, Y, Z), Max Abs Beam Shear Force (X', Y'), Max Abs Beam Moment (X'Z', Y'Z') and Tip End Bearing.
- Right Graph - The same graphs that are available in the results dropdown in the Plan/3D View window are available (depending on the analysis being performed), as well as Skin Friction.
- Chart Controls - This is where marker and line options, legend display options, font options and axis options are customized. These customizations apply to both the right and left graphs as a whole.
- Series Options - This is where the graph color, marker type and marker size can be customized for each set of results.
- Vertical Axis Options - The vertical axis of each individual graph can be customized here in terms of scaling.
- Horizontal Axis Options - The horizontal axis of each individual graph can be customized here in terms of scaling.