List of Test Holes
The Test Holes page shows all the test holes of the Active Project (see how to change the Active Project).
To access this page:
Go to the left-hand navigation menu and select Data Entry & Design → Test Holes.
Site Investigation Progress
RSLog allows you to track project progress at any point of time. Because of the centralized database design of RSLog, changes made by any user is immediately made available to other users. This user could be working on field data collection using OnSite app, or accessing RSLog from the office, home or anywhere else.
The status of a test hole indicates at which phase of drilling / excavating it is. A progress bar at the top of the Test Holes page shows the site investigation progress:

Each color indicates specific progress status. You can customize the list of progress statuses and their colors on Settings page → Data Entry tab → Quality Management tab.
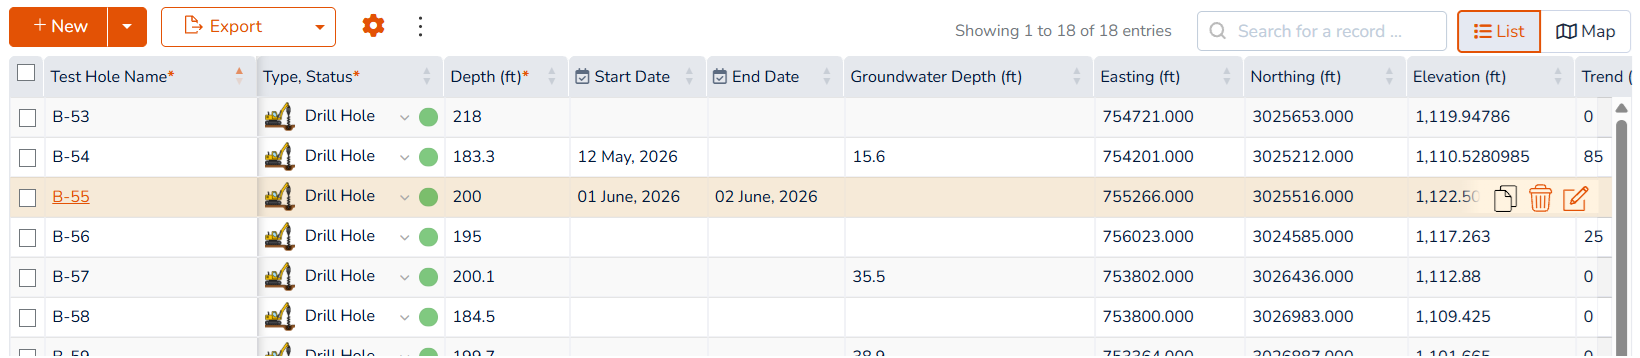
List View
The list of all test holes of the Active Project is shown in a table where you can add, edit, or delete a test hole (see working with tables). To view or edit complete test hole data, click test hole name on the first column:
Map View
In order to switch between the list view and map view, use the toggle at the top-right of the page (next to the search box). If the test holes are not shown on the map, please check the following:
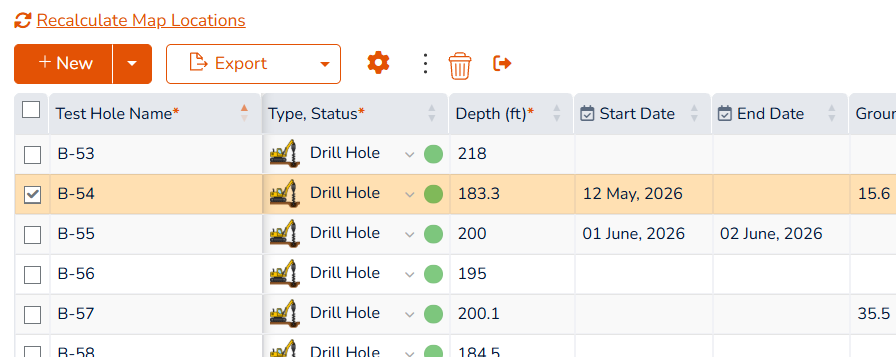
- Project CRS: Make sure the selected project coordinate system is correct (see project data entry page). If the project CRS is correct, try clicking the "Recalculate map locations" link at the top of list of test holes.
- Test Holes Coordinates: Check the coordinates entered for test holes on data entry page → General tab → Coordinates tab.
To export this map to various GIS formats click the Export button at the top-left of the map.
Copying a Test Hole
In order to copy a test hole, click the Copy button at the right end of that row. You will be prompted to enter the number of copies you wish to make.
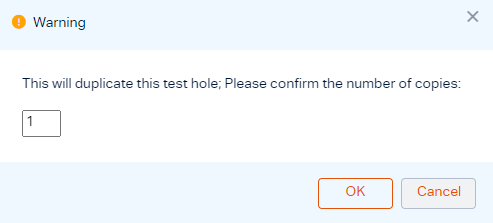
Click OK button to proceed. Please note depending on the number of copies selected, this operation may take from a few seconds to several minutes.
Moving a Test Hole
To move a test hole to another project, select the checkbox beside that test hole from the list, then choose the Move button from the top toolbar. Then select the destination project from the list and click Move.
Importing Boreholes From a CSV File
This allows you to add or update the list of test holes from a CSV file. If the test hole already exists, RSLog will update its data from the CSV file, otherwise it will add a test hole.
Creating the CSV File
Start by creating an Excel spreadsheet containing basic data for each test hole: name, depth, type, coordinates, contractor, equipment etc. Please make sure only one header row is present in your Excel file. Save this file in CSV format and try importing it to RSLog.
If you have columns for start date and end date, please make sure they are in yyyy-mm-dd format.
Importing the CSV File
To start importing the list of boreholes:
- Switch to the List view (table),
- Click the dropdown arrow on + New button, and select Import CSV File from the menu,
- Select the CSV file and apply column mapping as required, then click Import button (see this article for CSV import help).
Test Hole Data Entry
Please see this page for a detailed discussion on data entry for a test hole.