Rocscience International Conference 2025 is going to take place in Sydney, Australia Read more

Search Results

Graph Endpoints

The Graph Endpoints Graph endpoints feature allows users to generate an Endpoints graph of results.

To generate an Endpoints Graph:

  1. Select Graph Endpoints in the Interpret menu. The Chart Options dialog should appear. <the following image needs to be updated.>
  2. Chart Options dialog

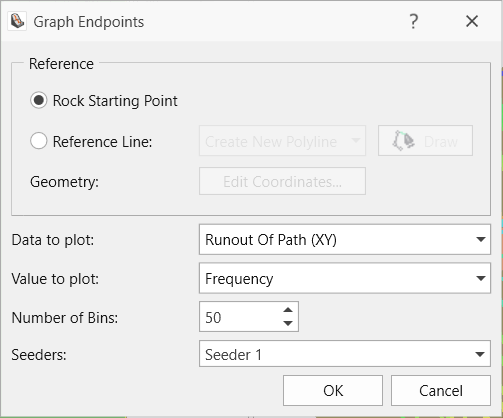
  3. Specify the Data to Plot.
  4. Specify the Value to Plot.
  5. Set the Number of Bins.
  6. Click OK.

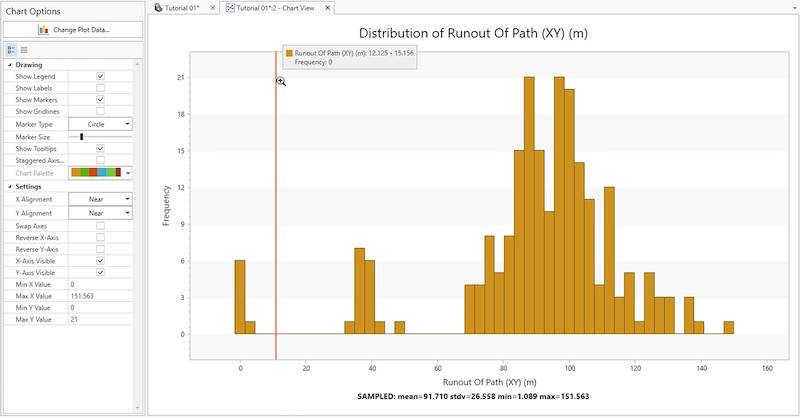
Below is an example of an Endpoints graph:

Tutorial 1 Endpoints graph

Data Types available to Plot include:

  • Runout of Path (XY)
  • Runout of Path (Z)
  • Runout of Path (Total)
  • Travel Time
Rocscience logo, click here to return to the homepage Portal Account Portal Account Log In Log Out Home Shopping Cart icon Click here to search our site Click here to close Learning Tech Support Documentation Info Chevron Delete Back to Top View More" Previous Next PDF File Calendar Location Language Fees Video Click here to visit Rocscience's LinkedIn page Click here to visit Rocscience's YouTube page Click here to visit Rocscience's X page Click here to visit Rocscience's Facebook page Click here to visit Rocscience's Instagram page Click here to visit Rocscience's Reddit page Bookmark Network Scroll down for more Checkmark Download Print Back to top Single User Multiple Users RSLog RocFall3 CPillar Dips EX3 RocFall RocPlane RocSlope3 RocSupport RocTopple RS2 RS3 RSData RSPile Settle3 Slide2 Slide3 SWedge UnWedge RocTunnel RocSlope2 Commercial License Education License Trial License Shop safe & secure Money-back guarantee