Plot Barrier Results in 3D
RocFall3 allows users to graph rock impact results along a barrier's length in 3D. The Plot Barrier Results in 3D tool displays barrier impact results in the viewport allowing users to identify and analyze critical regions along a barrier.
Below is the list of result types that can be plotted along each barrier:
- Total Kinetic Energy
- Translational Kinetic Energy
- Rotational Kinetic Energy
- Translational Velocity
- Rotational Velocity
- Impact Height
- Impact Angle
- Impact Angle (Absolute)
- Height Over Barrier
- Number of Hits
- Number of Rocks Over Barrier
To access the tool, the model must already have results computed and at least 1 barrier installed. Select Interpret > Plot Barrier Results in 3D to open the following dialog:
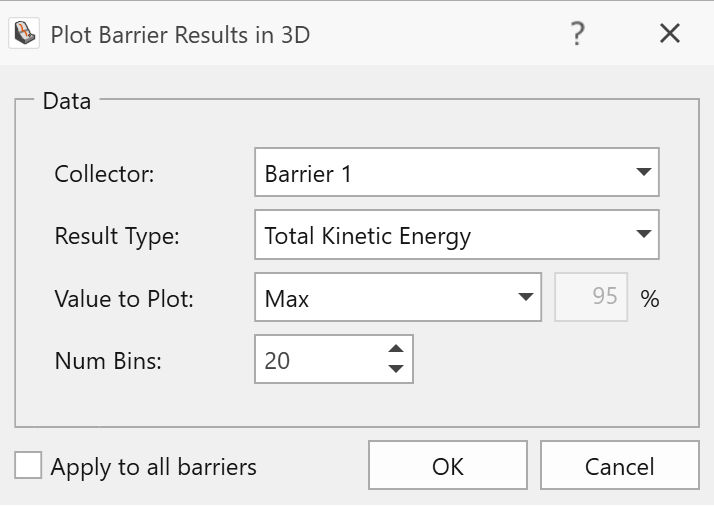
Collector
In the Collector dropdown, the user may select the barrier of interest.
Result Type
In the Result Type dropdown, the user may select the result type (e.g., height over barrier) to be graphed along the length of the selected barrier.
Value to Plot
For result types of a continuous nature, the user may plot the Maximum value or a given percentile. In the Value to Plot dropdown, the user may specify this information by choosing Max or Percentile, respectively.
If the user elects to graph a percentile value, the specified value can be input in the percentage field to the right.
For result types of a discrete nature, the Value to Plot is always Frequency. An example of a result type of a discrete nature is the Number of Hits.
Num Bins
The Num Bins field is used to specify the number of bins to be used for the graph. For example, if a barrier is 20 m in length, then a Num Bin value of 20 would segment the barrier into 1 m sections for graphing. A result is calculated for every bin based on the user selections for Result Type and Value to Plot.
It is important that the user inputs a value for the Num Bins that would establish a meaningful bin size (e.g., a meaningful bin size could be the barrier width between posts).
Apply to All Barriers
A 3D barrier plot may be generated for every barrier installed in the model. If the user intends to plot the same Result Type and Value to Plot for all 3D barrier plots, then "Apply to All Barriers" should be selected. For example, if the user would like all 3D barrier plots to show the 95 percentile translational kinetic energy, then "Apply to All Barriers" should be selected. Note that Num Bins is not included under this "Apply to All Barriers", meaning that the same number of bins cannot be applied to all 3D barrier plots. This is because barriers may vary in length and the Num Bins field determines the number of bins and the resulting bin size for each barrier plot.
Example Application
As an example, the following image shows rock paths impacting the barrier at many locations along its 300 m length. The user may be interested to know which sections of the barrier have larger impact kinetic energy values.
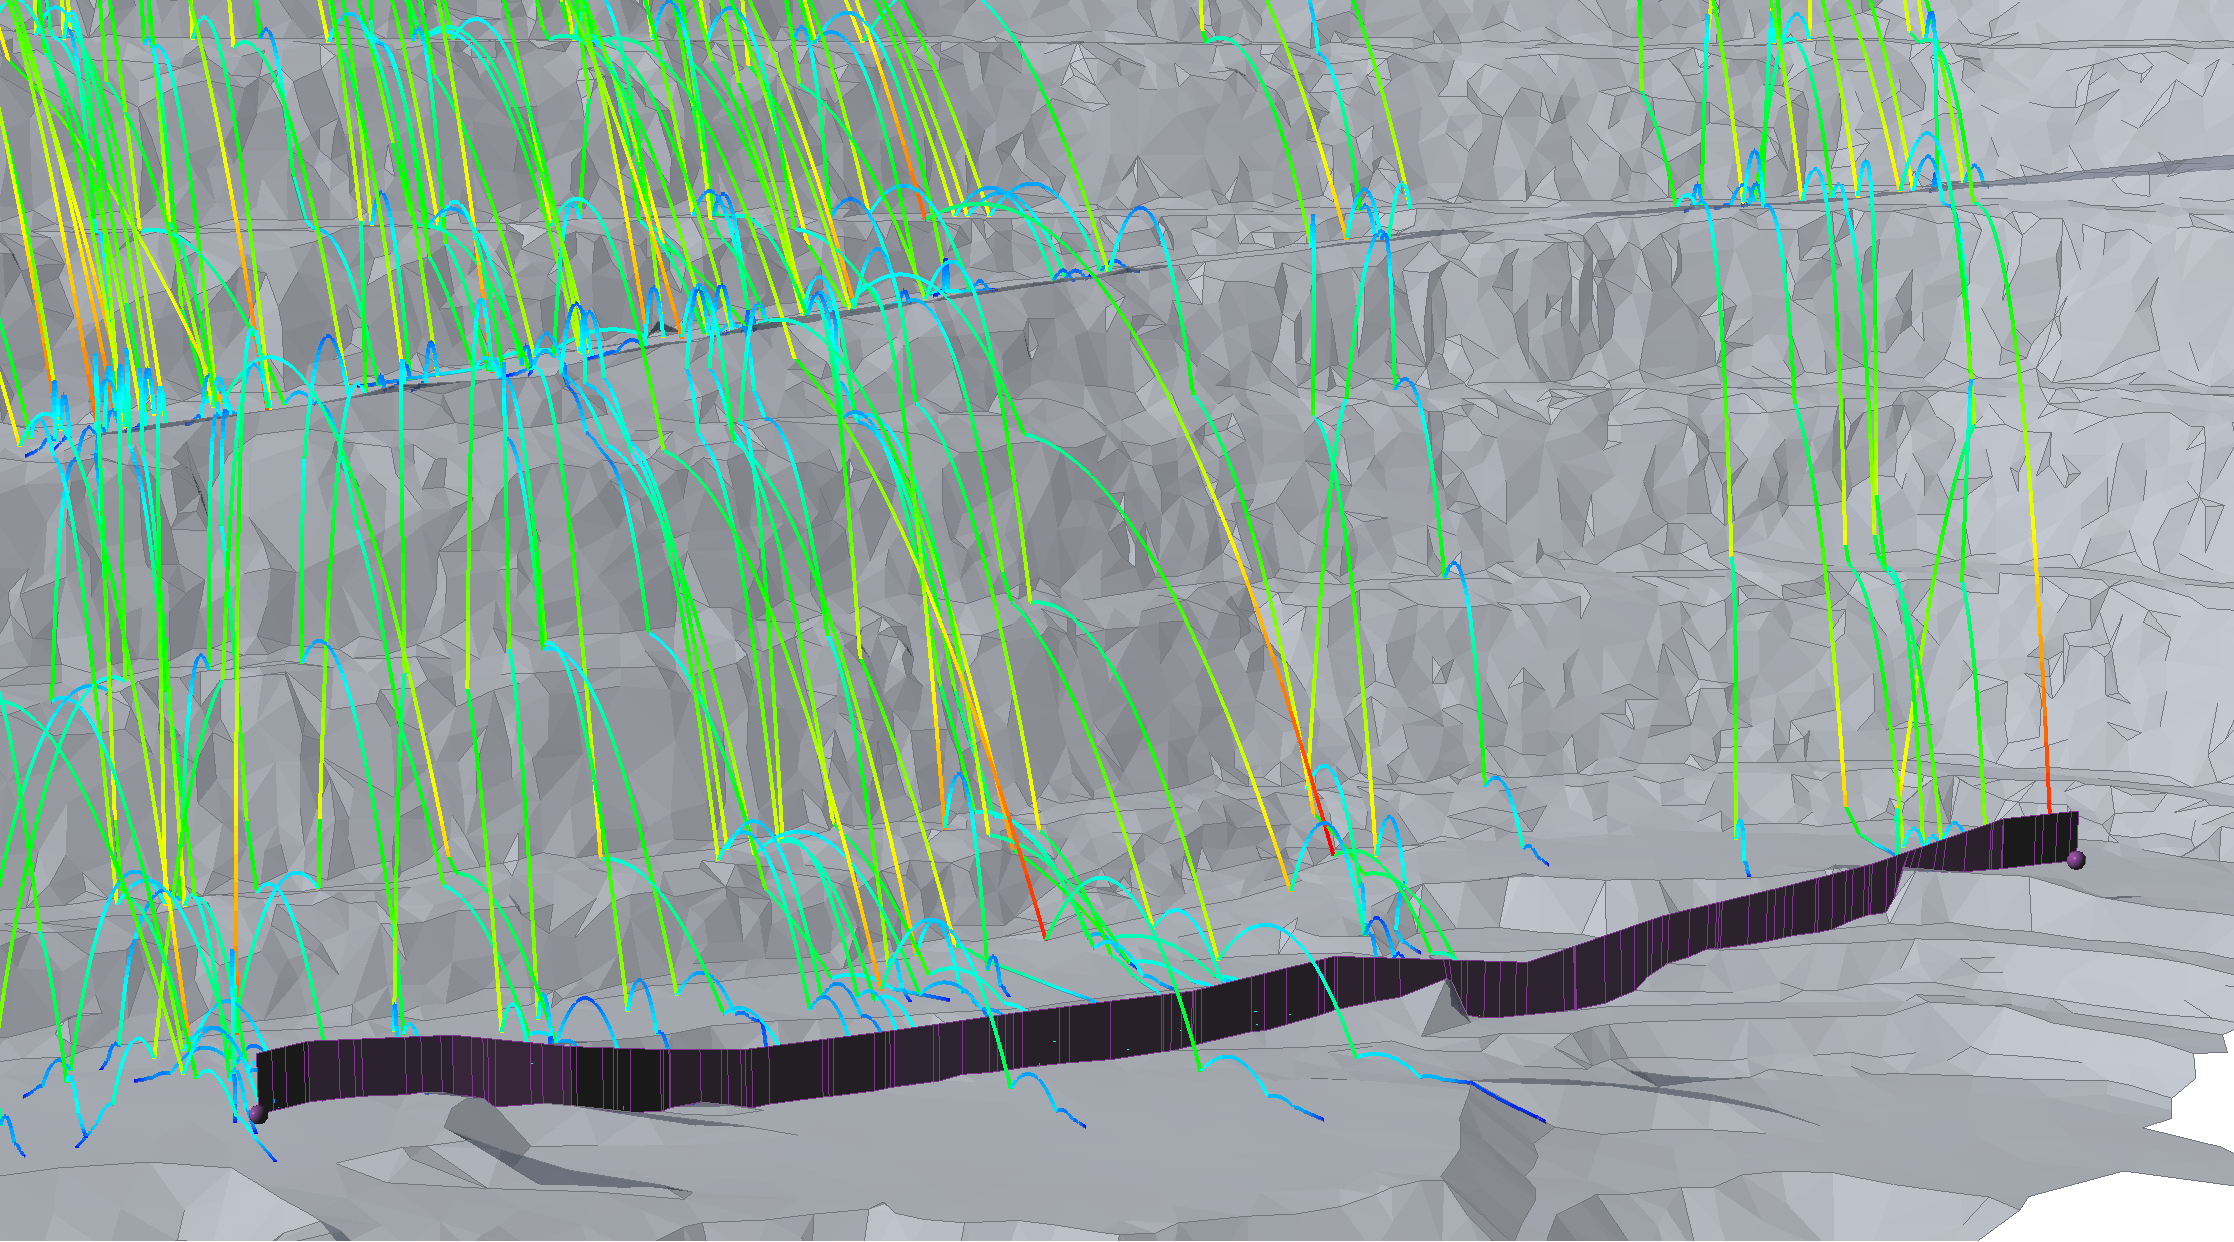
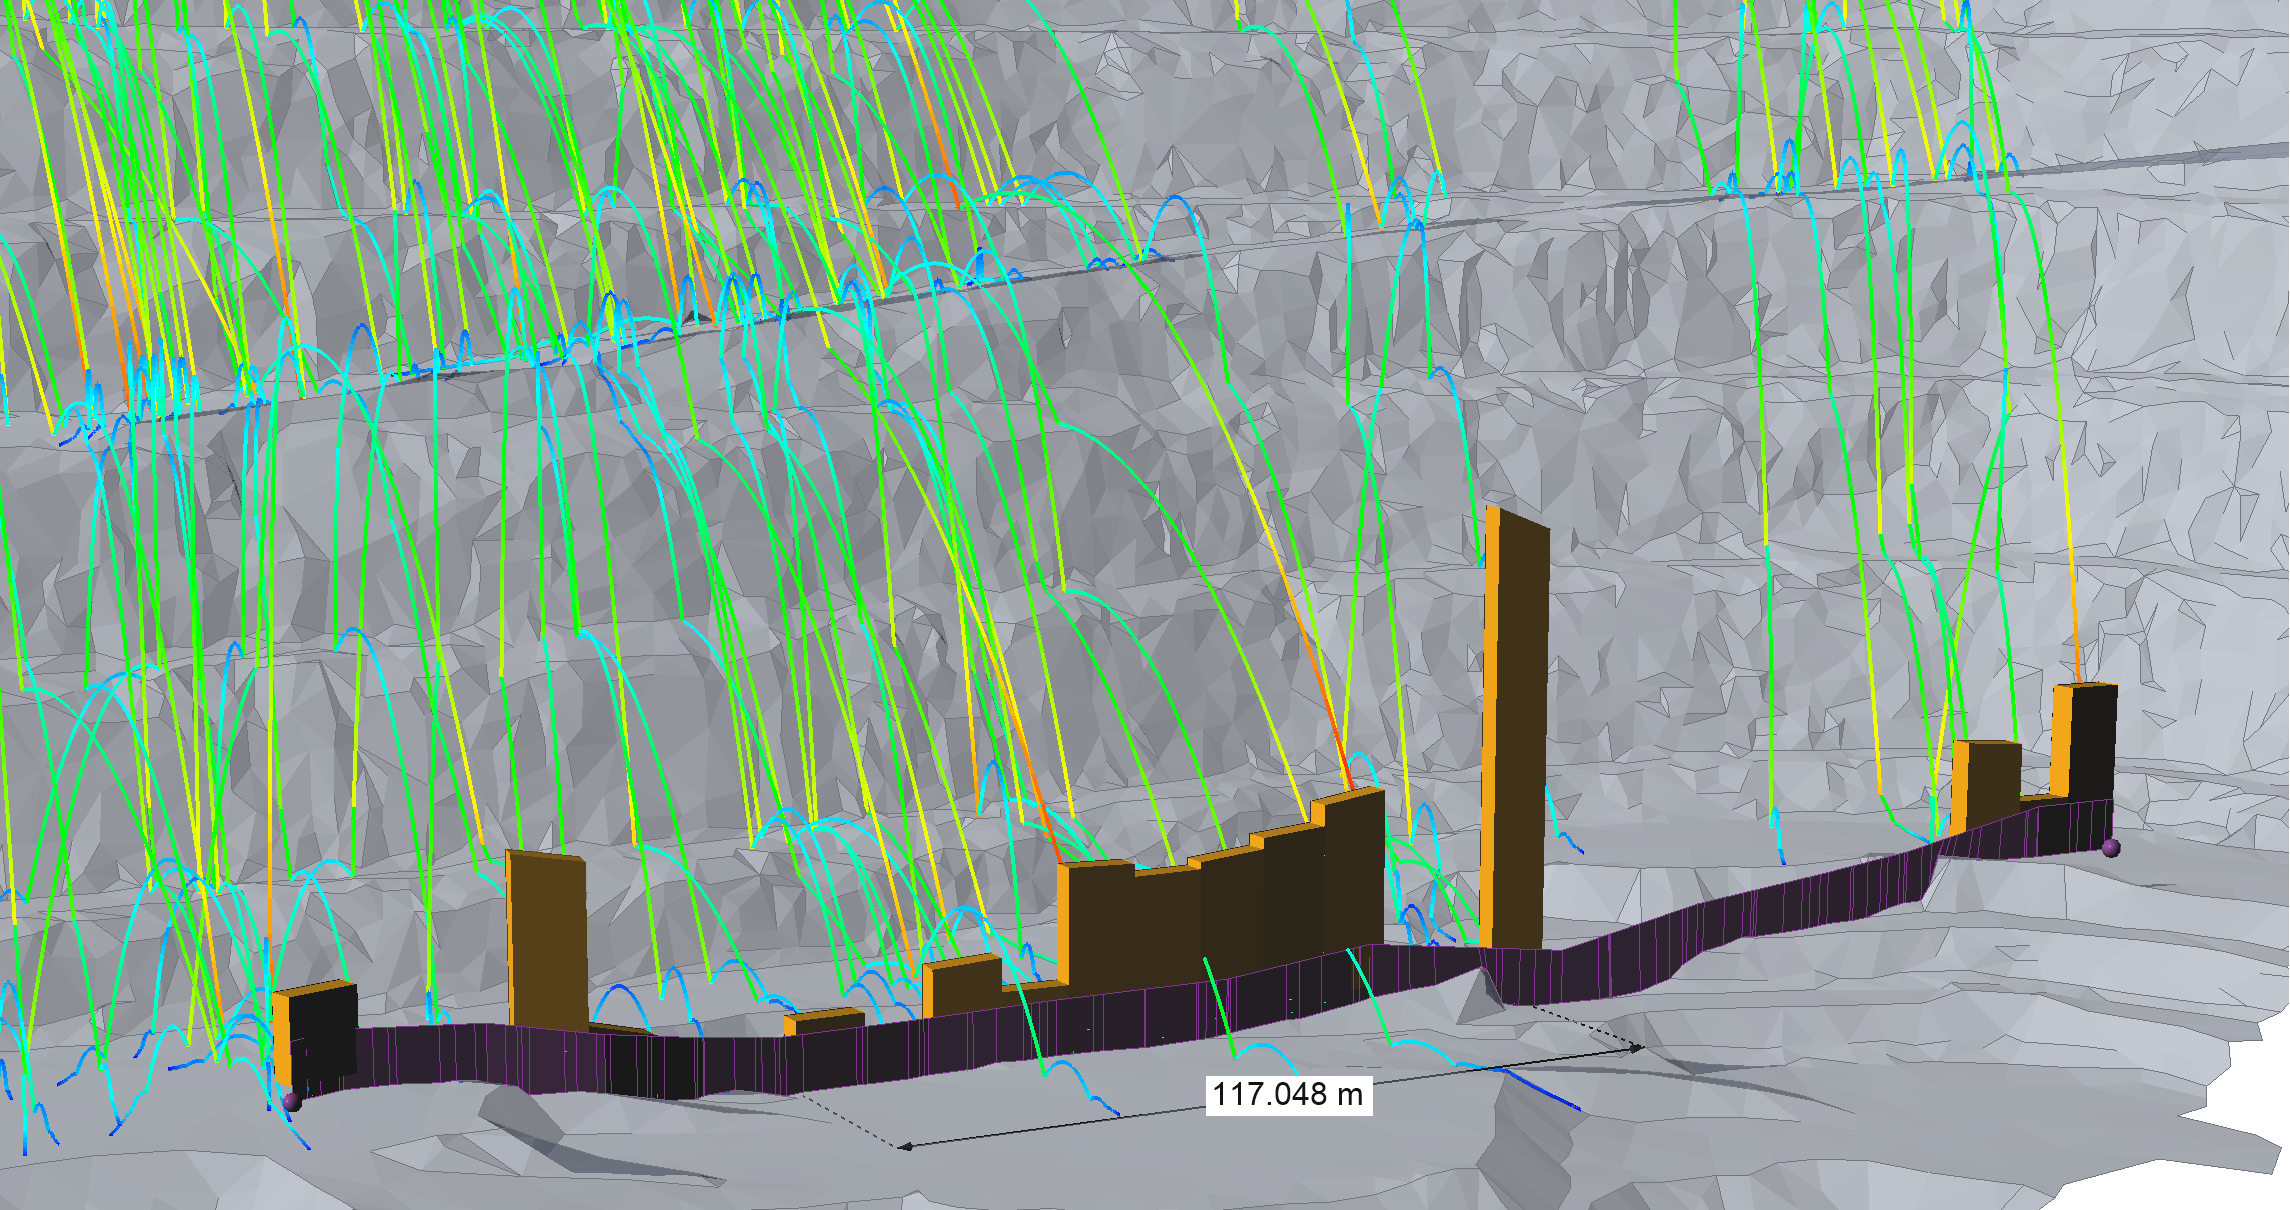
Plotting the Max Total Kinetic Energy indicates that near the middle is critical in terms of total kinetic energy. The critical section spans about 117 m.
The analysis can be taken one step further using the Graph Along Barriers tool, where the same 3D barrier plot can be displayed in a 2D graph view, and where the user may check the value in each bin of the graph and export results to Excel.
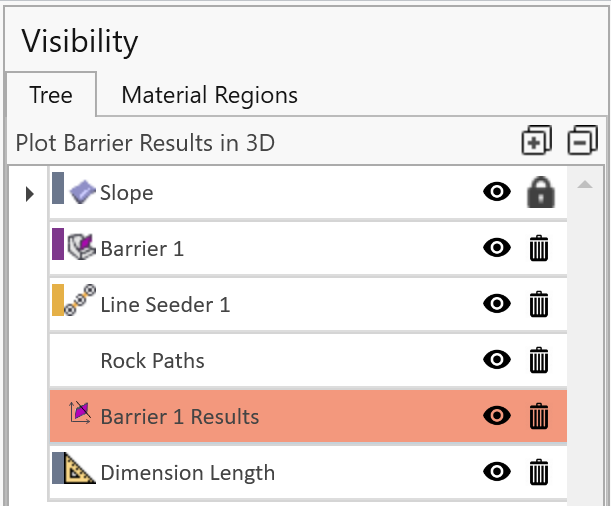
Note that once a 3D barrier plot has been generated, its properties may be accessed and modified from the properties pane. For every 3D barrier plot created, a barrier results node is also created in the visibility tree. Select a barrier results node to access the properties of the corresponding 3D barrier plot.
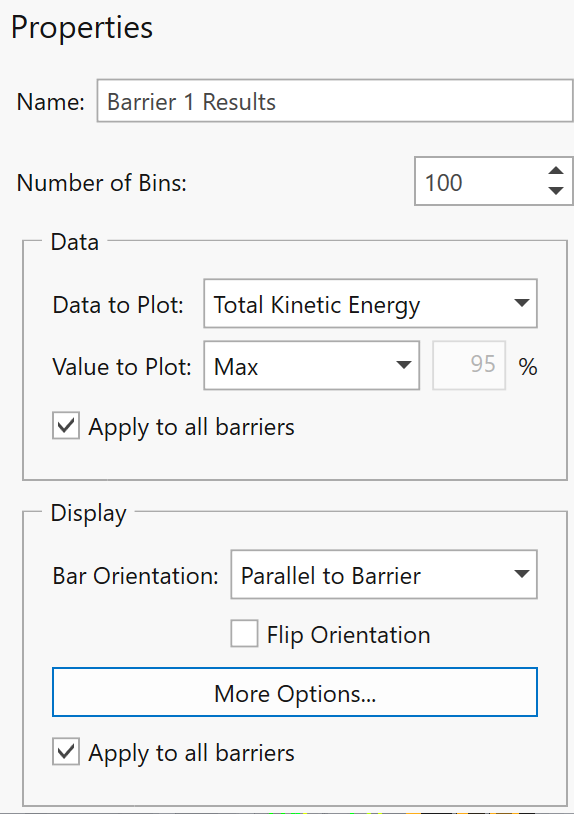
Each 3D barrier plot has its own set of properties, including display options.