Create Surface Heat Map
The colours of a Surface Heat Map represent the magnitude of scalar quantities projected on a slope surface. Each grid displays a colour representing the scalar magnitude of the variable of interest. Heatmaps can be used to quickly identify patterns or trends in a dataset and are especially useful when dealing with larger sets of rock paths.
- Select: Interpret > Create Surface Heat Map

There are six Data Type options that can be analyzed using the surface heatmap:
- End Points
- Impact Points
- Total Kinetic Energy
- Translation Kinetic Energy
- Rotational Kinetic Energy
- Bounce Height
For result types of a continuous nature (i.e., energy and height), the user may use the Value Type dropdown to plot the maximum, mean or a user-defined percentile value. For example, a heatmap of maximum translational kinetic energy represents the maximum of translational kinetic energies for the portions of all rock paths directly above each grid.
For result types of a discrete nature (i.e., count of end points and impact points), there is no Value Type since values are always given in terms of frequency. For example, a heatmap of impact points shows a spatial distribution of the frequency of rock points of impact. Users can use this feature to identify hot spots of rock impact.
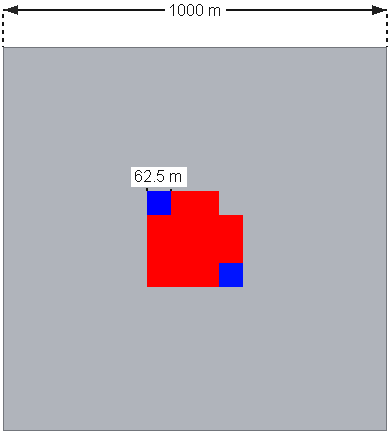
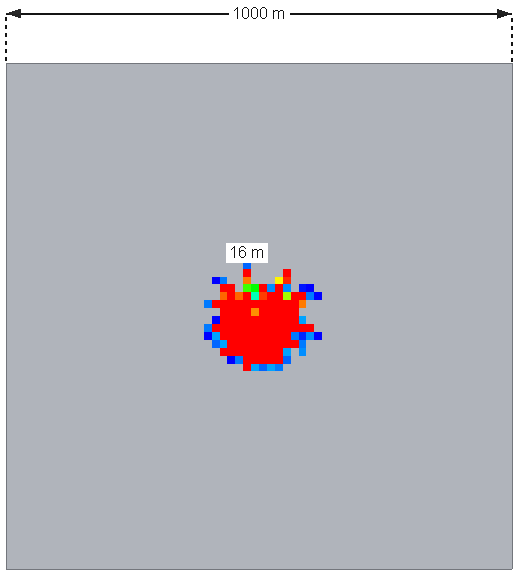
Histogram Resolution
The resolution value represents the number of pixels on each side of a square bitmap. In other words, a resolution of 16 displays a 16x16 bitmap of pixels. However, not all 256 (16x16) pixels can be seen as the bitmap is scaled to the size of the entire slope. To see every pixel, the slope would need to be a perfect square in plan view (XY), and each pixel would need to display different values to visualize the different colors.
A 1000 x 1000 m slope surface (from the XY view) is shown in each of the following two figures.
In the first figure, the histogram resolution is 16, so the length of each square bitmap is 62.5 m (e.g., 1000 m divided by 16). The second figure shows a histogram resolution of 64, so the length of each bitmap is approximately 16 m.
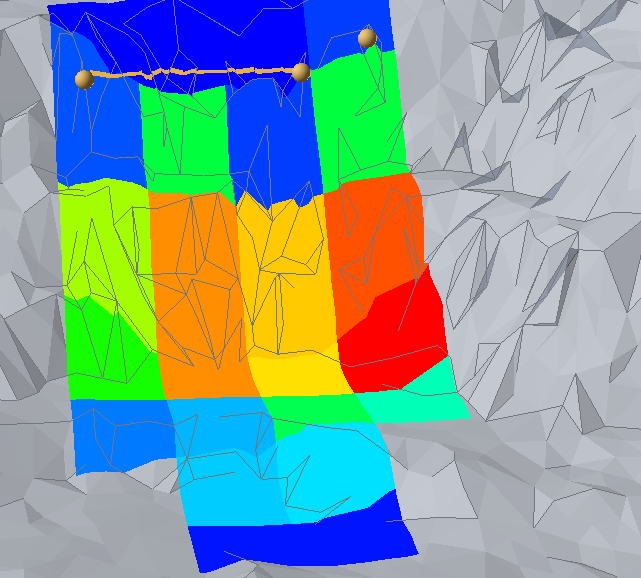
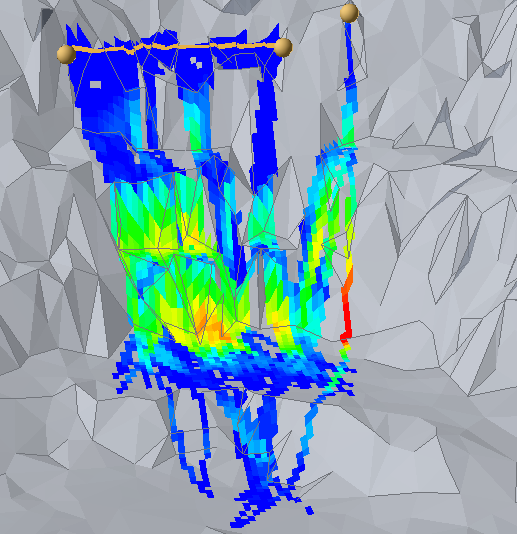
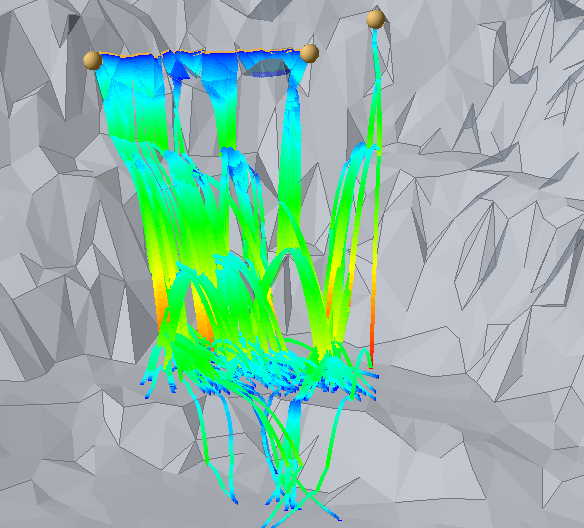
Example Application
As an example, the following image shows rock paths impacting the slope surface at many locations. The user may use the heatmap feature to help decide spatially where to place protection systems. For example, when deciding on a barrier placement, it is important to consider placement locations with lower bounce heights and energies.
As illustrated in the following two figures, a resolution of 16 does not give enough resolution for this purpose; however, a 64 or 256 resolution map is much more suitable for deciding on the protection location.