Barrier Display Results
The Barrier Display Results dialog allows customization of the 3D barrier plot display options.
To access the tool, there must be at least one 3D barrier plot generated (select Results > Plot Barrier Results in 3D), with at least one Barrier Results entity node in the visibility tree (a Barrier Results node is created for every 3D barrier plot).
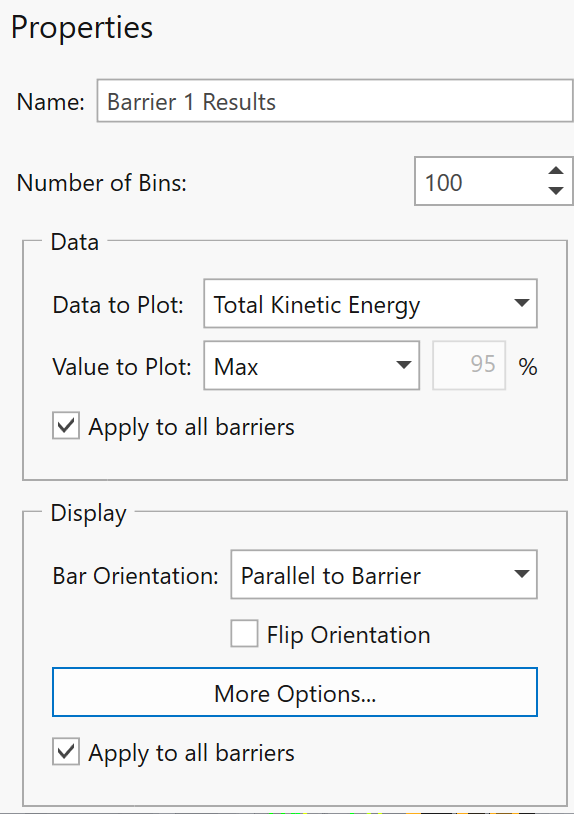
- Select a Barrier Results node in the Visibility tree
- In the Properties Pane, under Display, click More Options...
A dialog opens with options to customize the Bars and the Colors.
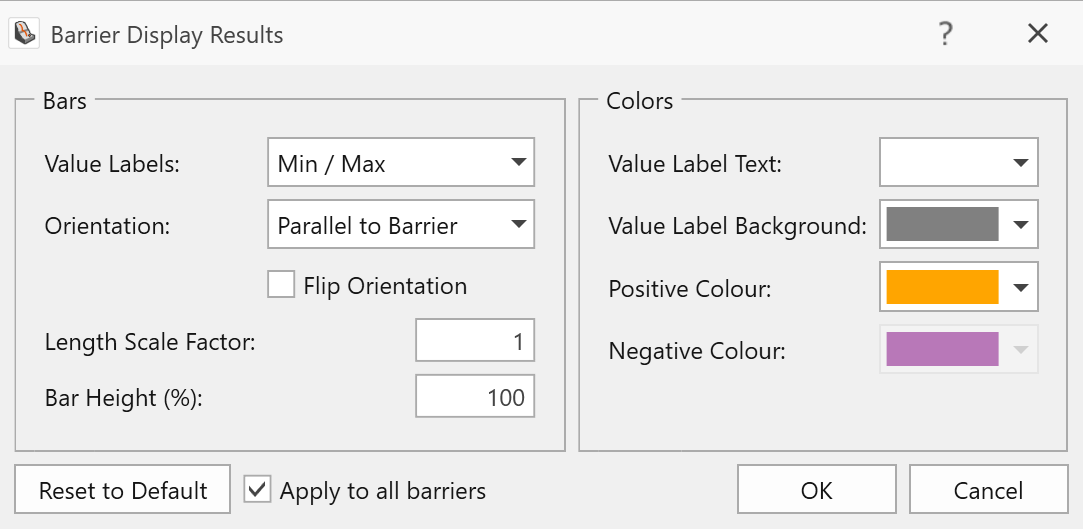
Bars
The Value Labels dropdown allows the user to display labels of the Minimum and Maximum values (Min/Max), or to display no labels at all (None). If Min/Max is selected, then the minimum value would be labeled next to the bar on the 3D barrier plot that is the minimum of all bars, and the maximum value would be labeled next to the bar on the 3D barrier plot that is the maximum of all bars.
The Orientation dropdown allows the user to change the orientation of the 3D bars being displayed. The orientation options are:
- Parallel to Barrier
- Normal to Barrier
- Horizontal
- Vertical
Selecting the Flip Orientation checkbox reverses the orientation of the bars.
The Length Scale Factor allows users to adjust the bar display lengths. The default scale factor is always 1, and bar lengths are scaled proportionally according to the scale factor. For example, a scale factor of 0.5 would halve the default bar lengths and a scale factor of 2 would double the default bar lengths.
The Bar Height allows users to adjust the thickness of the bars.
Colors
- Value Label Text - allows users to customize the color of the font used for the Value Labels.
- Value Label Background - allows users to customize the background color for the Value Labels.
- Positive Color - controls the color of the bars containing values greater than zero.
- Negative Color - controls the color of the bars containing values less than zero.
Apply to all barriers
Selecting Apply to all barriers allows the current barrier display settings to be applied to all 3D barrier plots. If the user entered this dialog with the intention of modifying the display settings of just the selected 3D barrier plot, then Apply to all barriers should be de-selected.