Rocscience International Conference 2025 is going to take place in Sydney, Australia Read more

Search Results

Graph Barriers

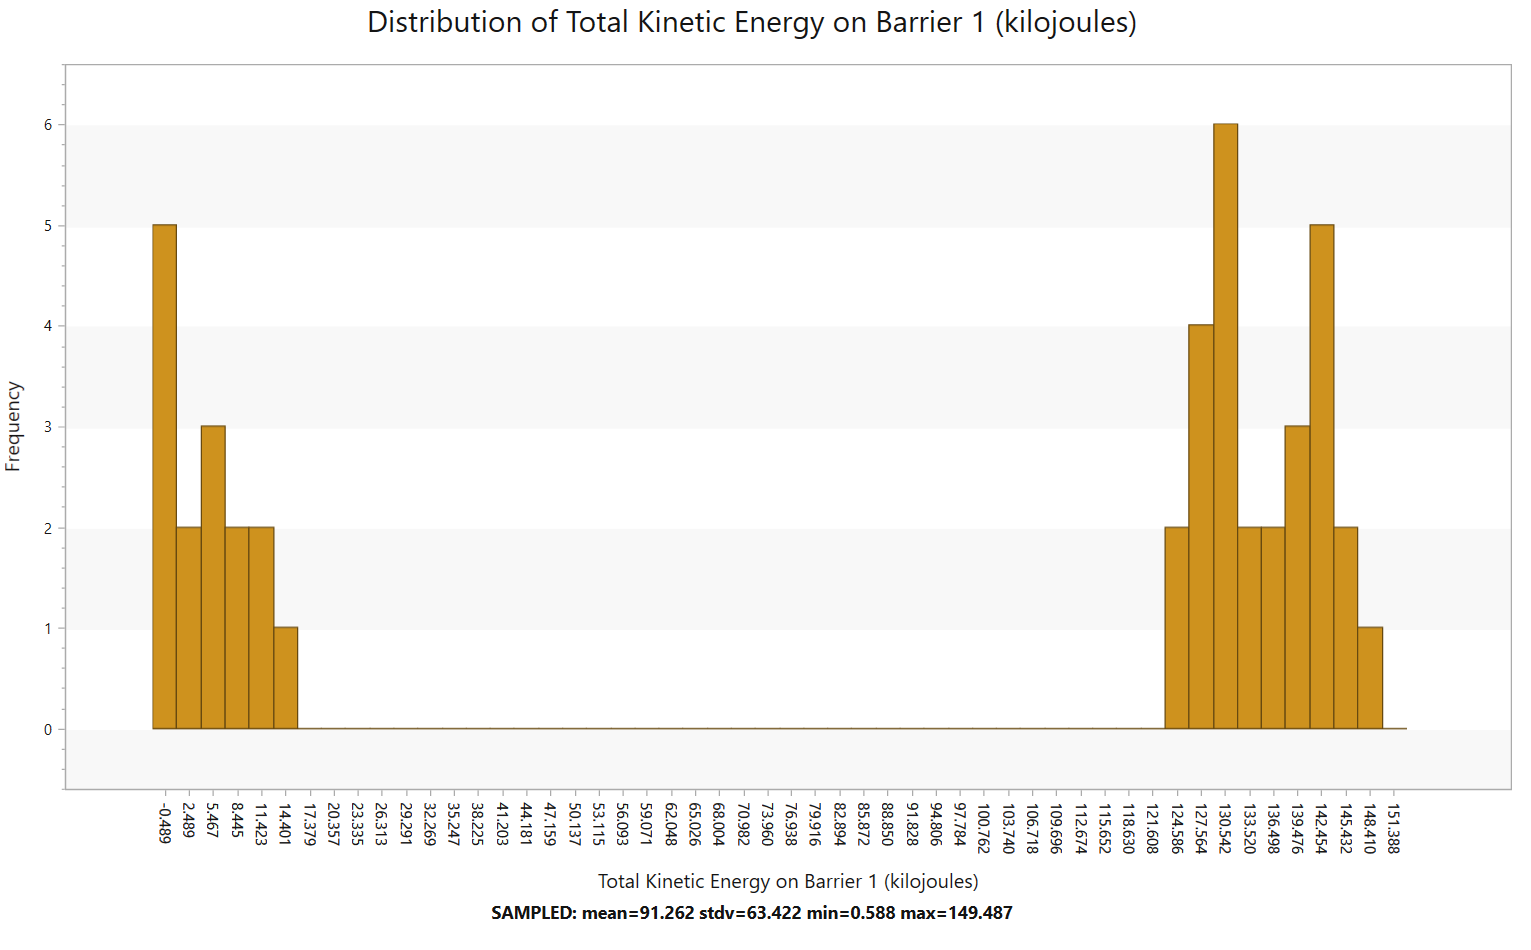
RocFall3 allows users to graph frequency data from impacting rocks against barriers in the model by using the Graph Barriers tool. This tool is useful for understanding the amount of energy imparted onto the barriers from falling rocks. You can also view the maximum height at which a rock has impacted a barrier.

Select: Interpret > Graph Barriers

The Chart Options dialog will appear. Here, you can:

  • Select the barrier of interest in the Collector dropdown menu
  • Select the type of data you want in the chart (Energy, Velocity, Bounce Height)
  • Select the frequency value you want in the chart (Number of Rocks, Percent of Rocks)
  • Set the Number of Bins you want your data to be categorized
  • Option to display a Cumulative Plot

Click OK to save and open the graph.

Graph Barrier Results
RocFall3: Example of Barrier Graph
Rocscience logo, click here to return to the homepage Portal Account Portal Account Log In Log Out Home Shopping Cart icon Click here to search our site Click here to close Learning Tech Support Documentation Info Chevron Delete Back to Top View More" Previous Next PDF File Calendar Location Language Fees Video Click here to visit Rocscience's LinkedIn page Click here to visit Rocscience's YouTube page Click here to visit Rocscience's X page Click here to visit Rocscience's Facebook page Click here to visit Rocscience's Instagram page Click here to visit Rocscience's Reddit page Bookmark Network Scroll down for more Checkmark Download Print Back to top Single User Multiple Users RSLog RocFall3 CPillar Dips EX3 RocFall RocPlane RocSlope3 RocSupport RocTopple RS2 RS3 RSData RSPile Settle3 Slide2 Slide3 SWedge UnWedge RocTunnel RocSlope2 Commercial License Education License Trial License Shop safe & secure Money-back guarantee