28 - Using RSLog Cross Sections in Slide2
1.0 Introduction
RSLog allows you to log test holes for soil and rock, in geotechnical, environmental, oil and gas, or mining projects. A feature of RSLog is the ability to design a cross section with your field data. This cross section can be easily imported into Slide2.
In this tutorial you will learn how to:
- Create a cross section in RSLog
- Bring the section into Slide2 using your RSLog account (online)
- Bring the section into Slide2 by uploading a file (offline)
2.0 RSLog Project
On your web browser, go to the RSLog login page: https://www.rslogonline.com/ and login with your credentials.
We will be importing the RSLog project from Excel. You can download a zip folder of the necessary excel files here. Once this is done, begin the import process in RSLog (as explained below):
- In the left-hand navigation pane, select Import.
- Under RSLog Excel Templates, click Import.
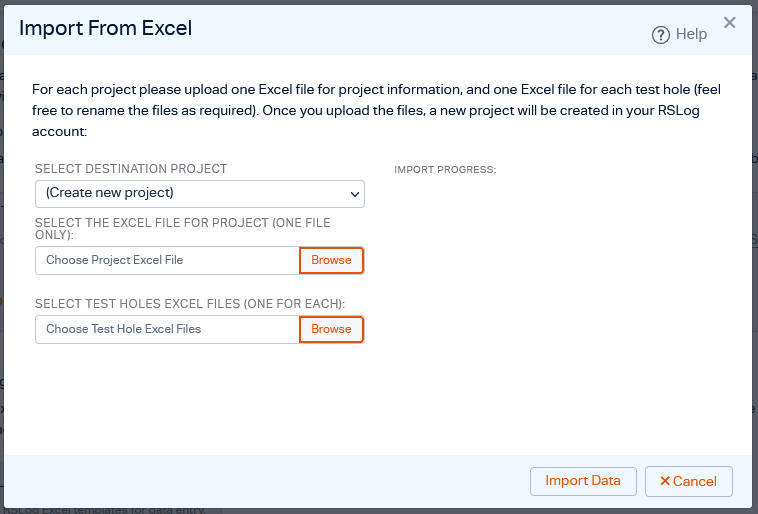
- For Destination, select Create New Project.
- Under Browse to select the Project Info Excel File, click Browse.
- Navigate to the downloaded excel files .
- Load in “ProjectTemplate.xlsx.”
- Now under Browse to Select Boreholes, click Browse.
- In the same directory, select all the “Testhole_....xlsx” files and load them in.
- Click Import Data.
Once done, you will be taken to the Test Holes page:
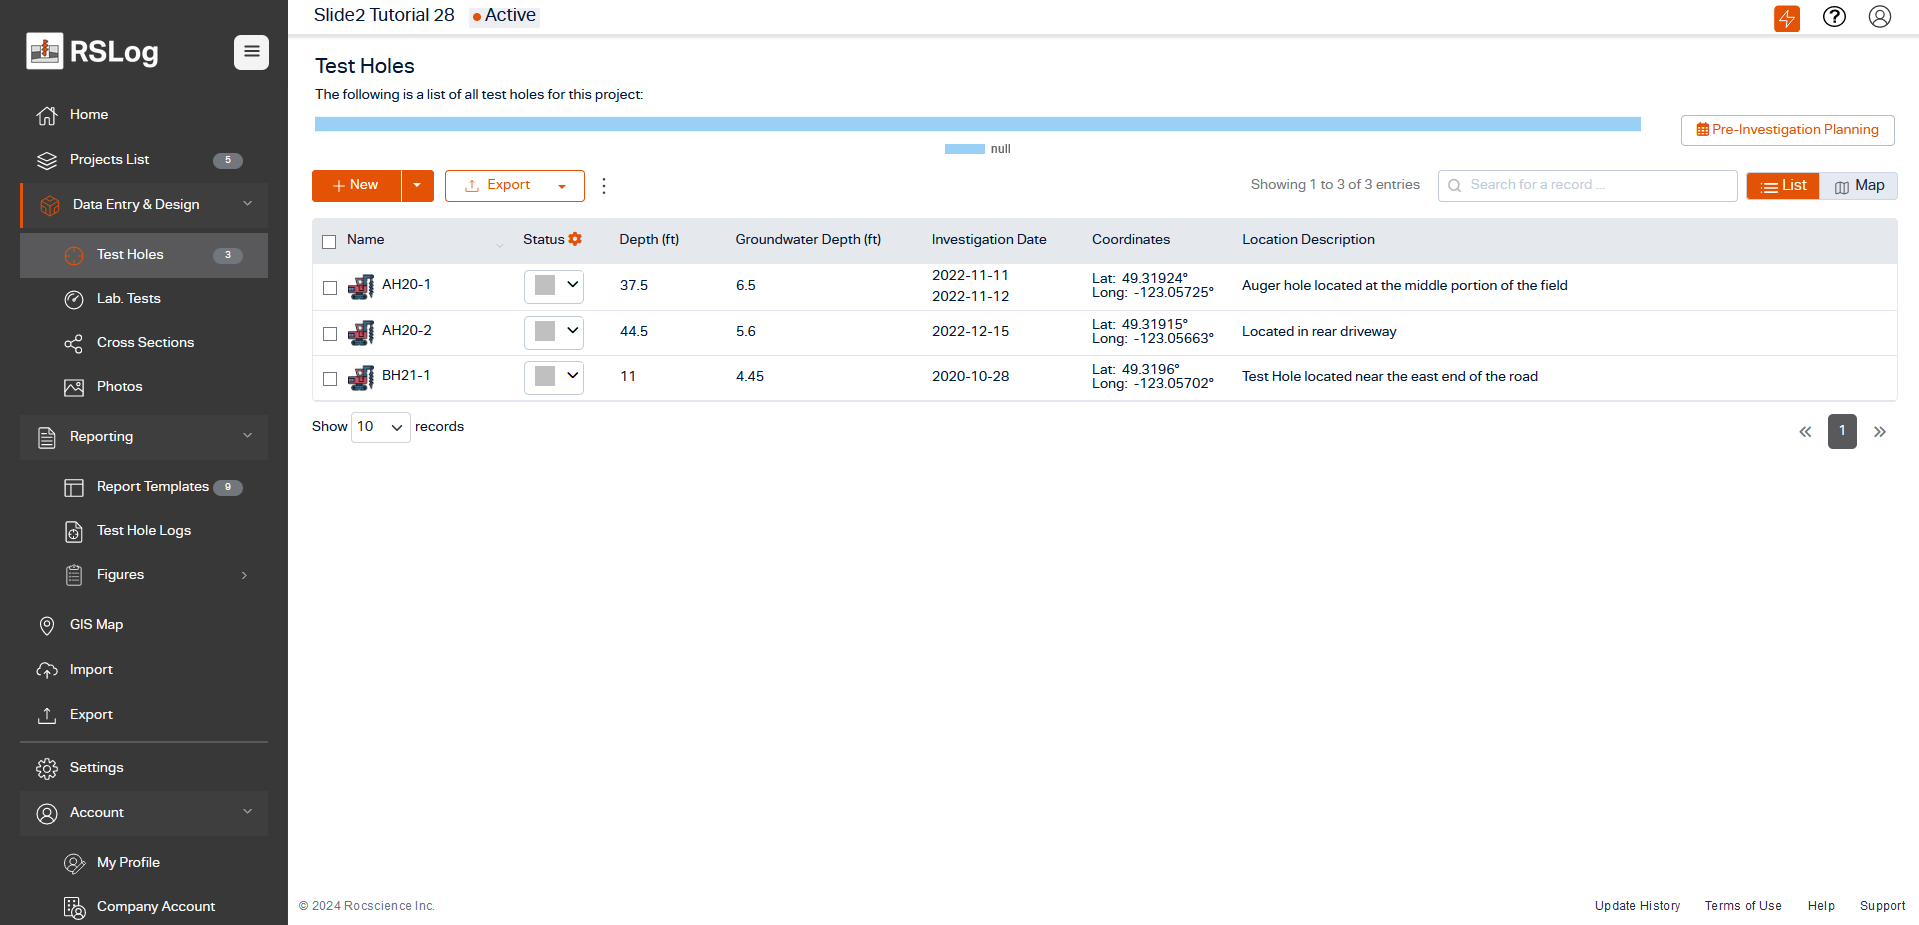
Three test holes have been defined for this project. Notice the name of the active project “Slide2 Tutorial 28” at the top left of the page.
- For any of the Test Holes, click the Edit Item icon to see more information.
- Manually enter the latitude and longitude for each testhole as shown below.
Borehole |
Latitude |
Longitude |
AH-20-1 |
49.31924 |
-123.05725 |
AH20-2 |
49.31915 |
-123.05663 |
BH21-1 |
49.3196 |
-123.05702 |
3.0 Create Cross Section in RSLog
We will create a simple cross section between boreholes 1 and 2:
- Select Data Entry & Design > Cross Sections
- Click Open Cross Section Designer
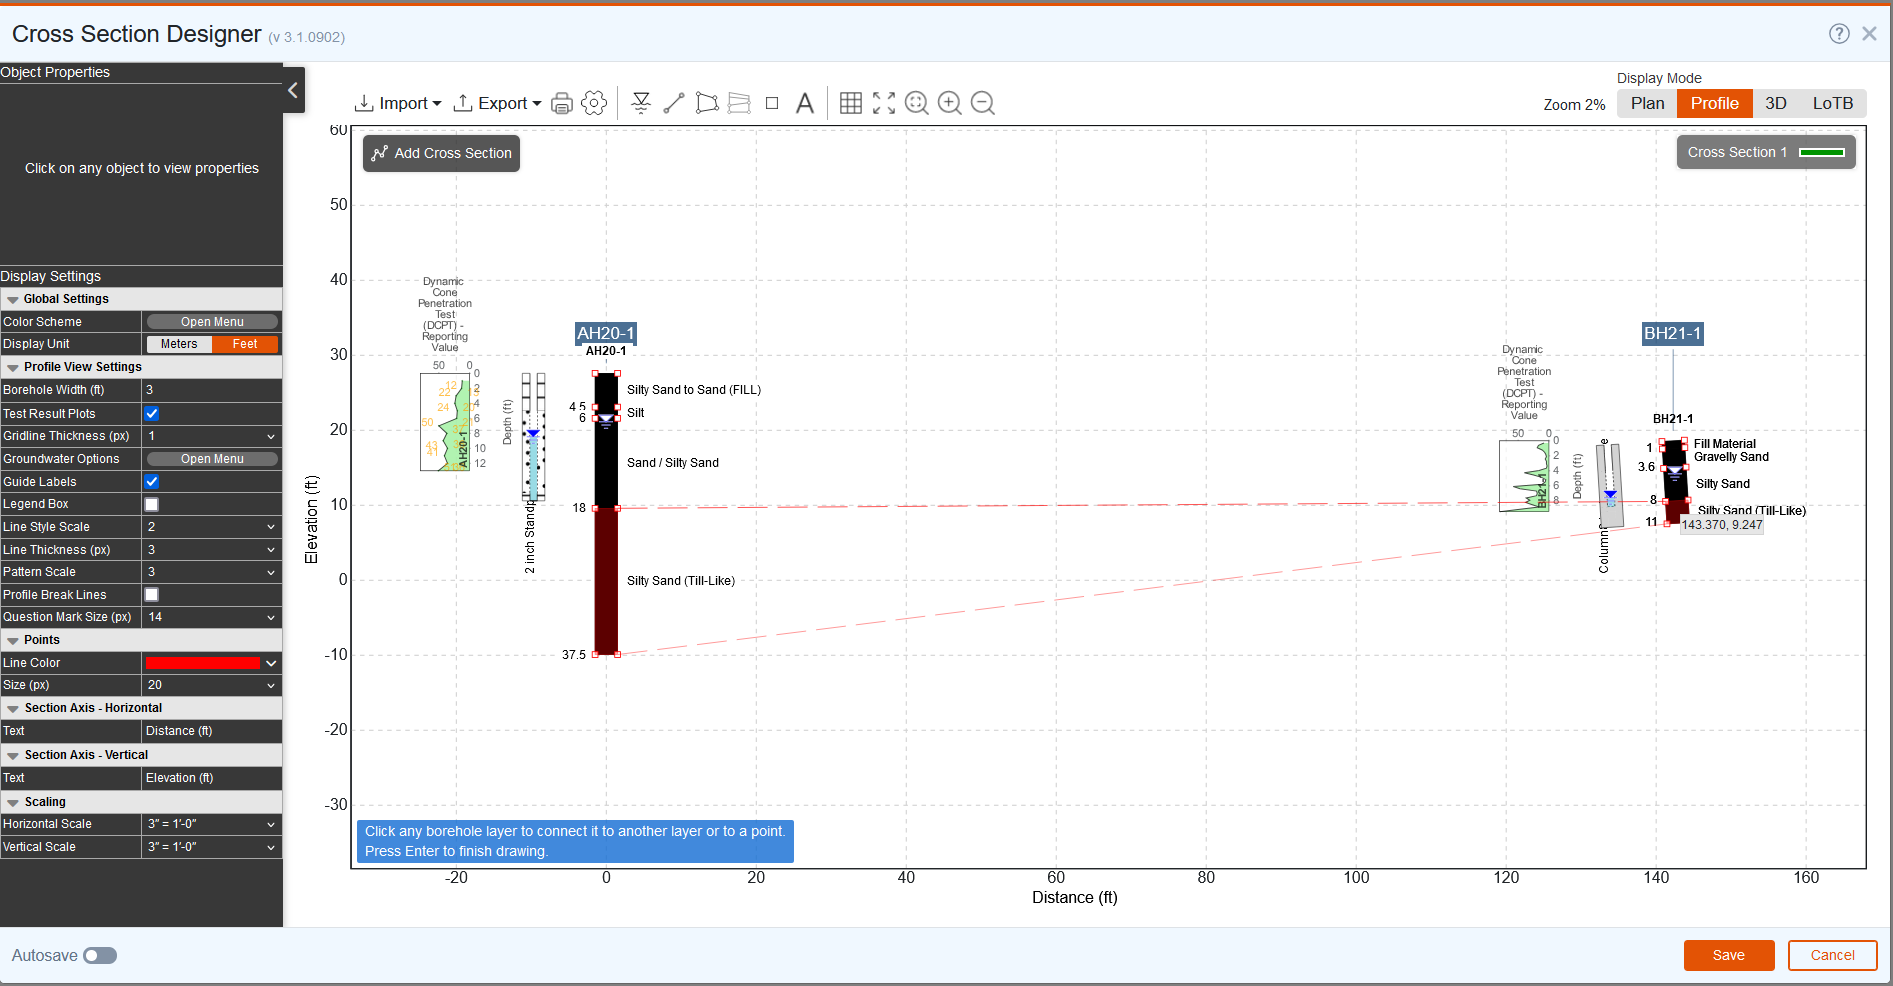
- Click Add Cross Section at the top left.
- Now, single-click on AH20-1. Make sure to click in the center of the blue symbol.
- Double-click on BH21-1 to finish defining the cross section.
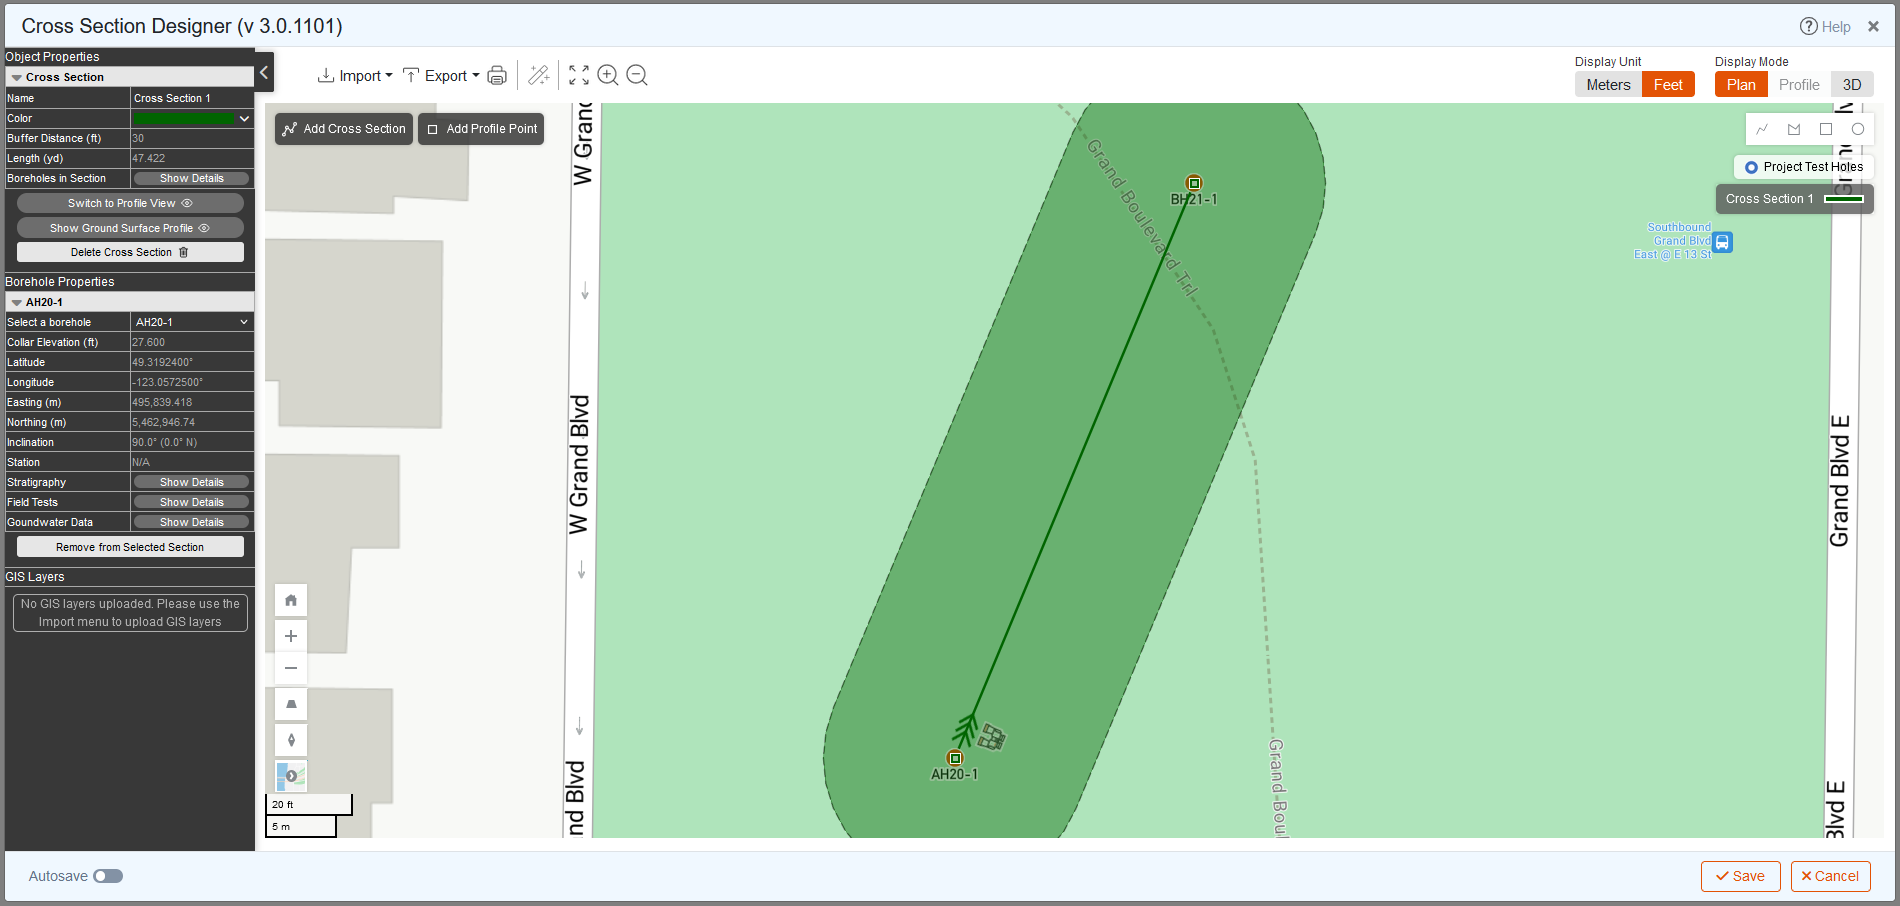
- In the left hand navigation, click Switch to Profile View (or select Display Mode > Profile in the top right of the screen). Click and drag the Materials Legend out of the way (or under Profile View Settings, uncheck the Legend Box checkbox).
We will design a simple cross section as follows:
- Select the Strata
 icon in the toolbar.
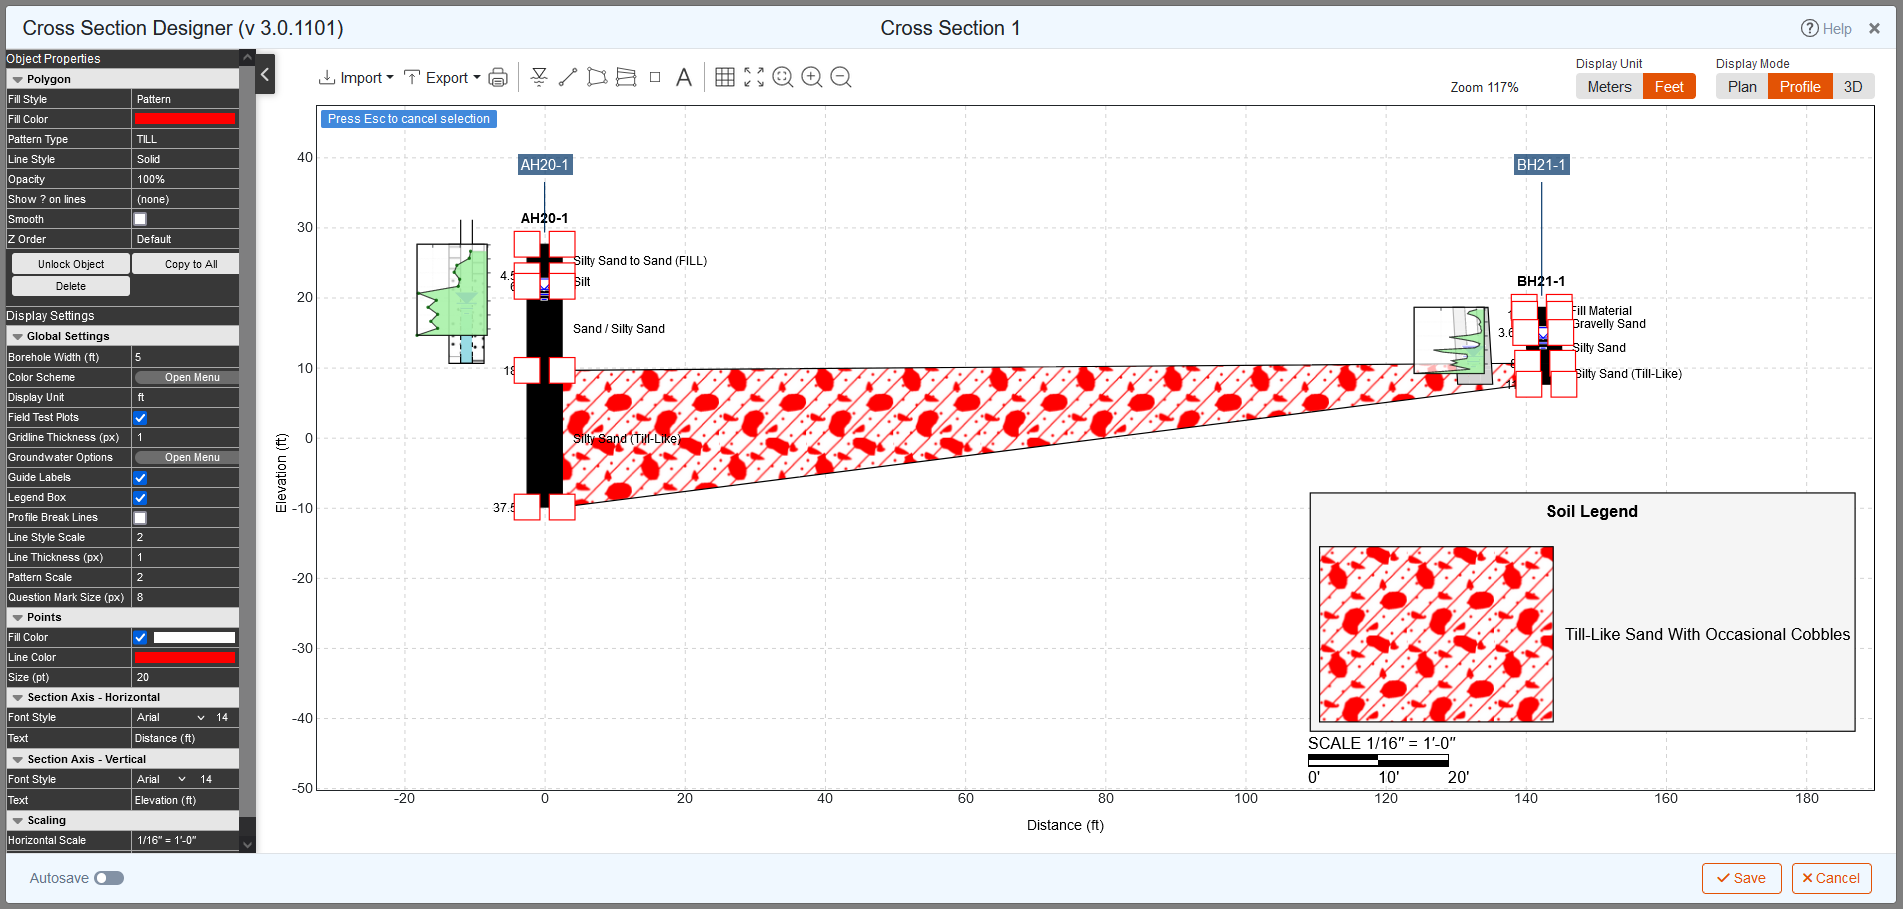
 - Starting with the left borehole (AH20-1), and the bottom layer, click on the Silty Sand (Till-Like) polygon.If you are unable to see the labels for the soil strata, go to the Object Properties pane on the left, and for Lithologic Description, change Layer Description to Title. You may also wish to increase the font size to 12 for easier viewing. Do this for both Test Holes.
- Now scroll over to the second borehole by clicking and dragging if necessary, and click on the Silty Sand (Till-Like) polygon. Then press Enter:
We will assign the appropriate material to this layer. - Click on the polygon we just created.
- In the Object Properties on the left side, under Polygon, select Fill Style = Pattern. Then select Pattern Type = TILL: Till-Like Sand with Occasional Cobbles.
- Change the Fill Colour to a shade of red.
Your screen will look as shown:
Using the same methodology, we will define a very simple cross section for import into Slide2. Note that there are many more advanced options in RSLog for defining these cross sections. For more information on defining cross sections in RSLog, see Cross Section Overview in the RSLog help.
Let’s continue defining our section.
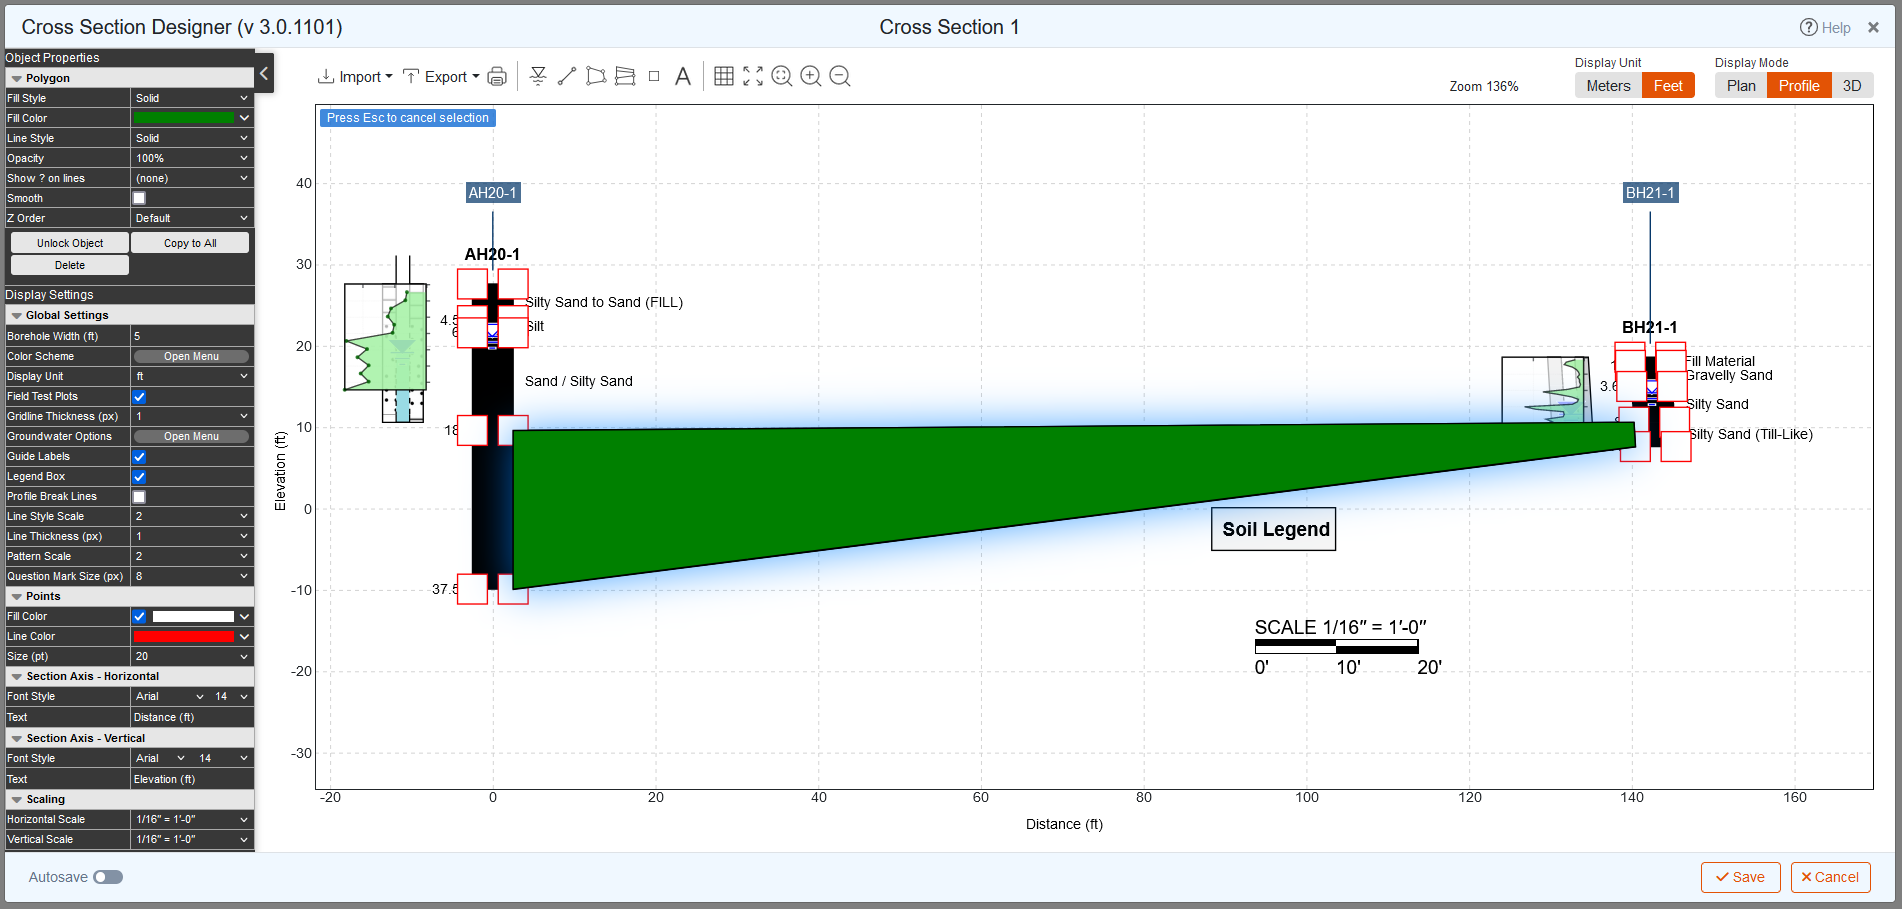
Silty Sand with Gravel
- Using the same steps above, use the Strata option to connect Silt and Sand/Silty Sand in borehole AH20-1 with Silty Sand in borehole BH21-1.
- In the Object Properties on the left side, under Polygon, set Fill Style = Pattern, and Pattern Type = SM: Silty Sand with Gravel.
- Change the Fill Color to a shade of green.
Gravelly Sand
- Use the Strata option click on the Gravelly Sand polygon in borehole BH21-1.
- This time in borehole AH20-1 click on the vertex right above our green polygon. Then press Enter. This will simulate this layer ending at that vertex.
- In the Object Properties on the left side, under Polygon, set Pattern Type = GW: Well Graded Gravel with Sand.
- Change the Fill Colour to a shade of blue.
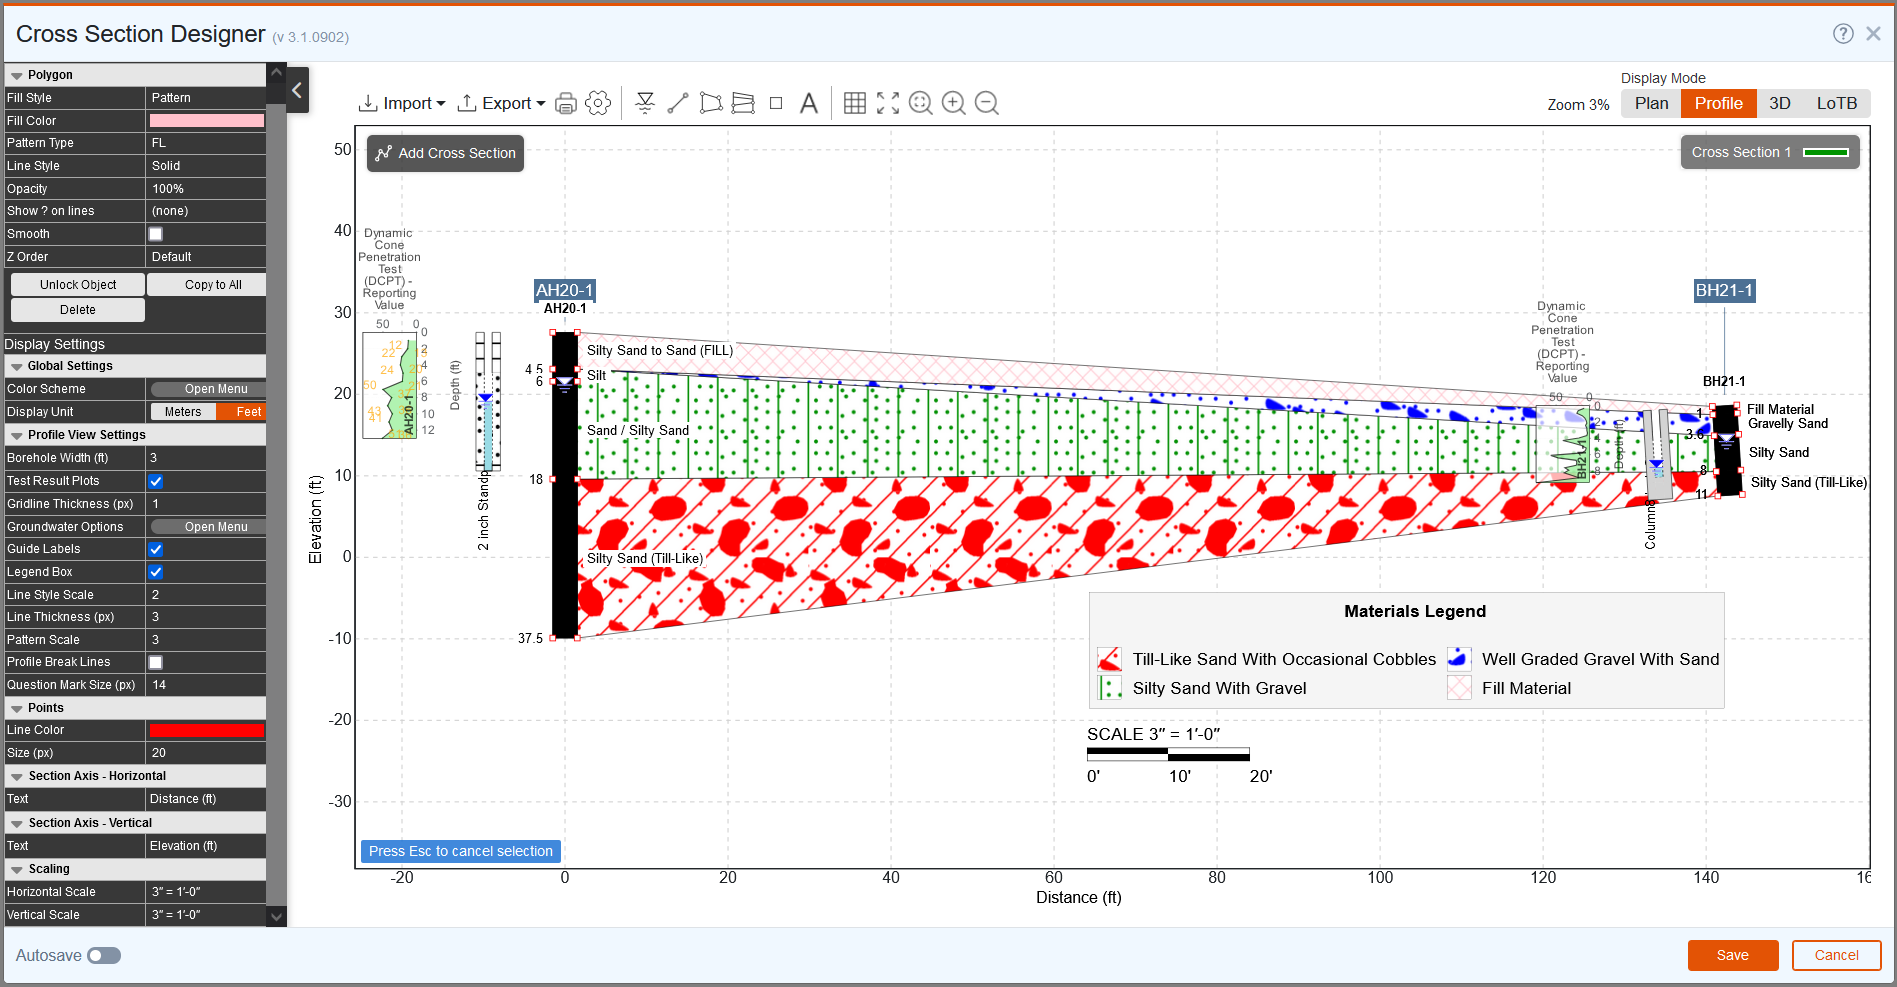
Fill Material
- Finally, use the Strata option to connect Silty Sand to Sand (FILL) in borehole AH20-1 with Fill Material in borehole BH21-1.
- In the Object Properties on the left side, under Polygon, set Fill Style = Pattern, and Pattern Type = FL: Fill Material.
- Change the Fill Color to a shade of pink.If you turned off your Legend Box, you can turn that back on now.
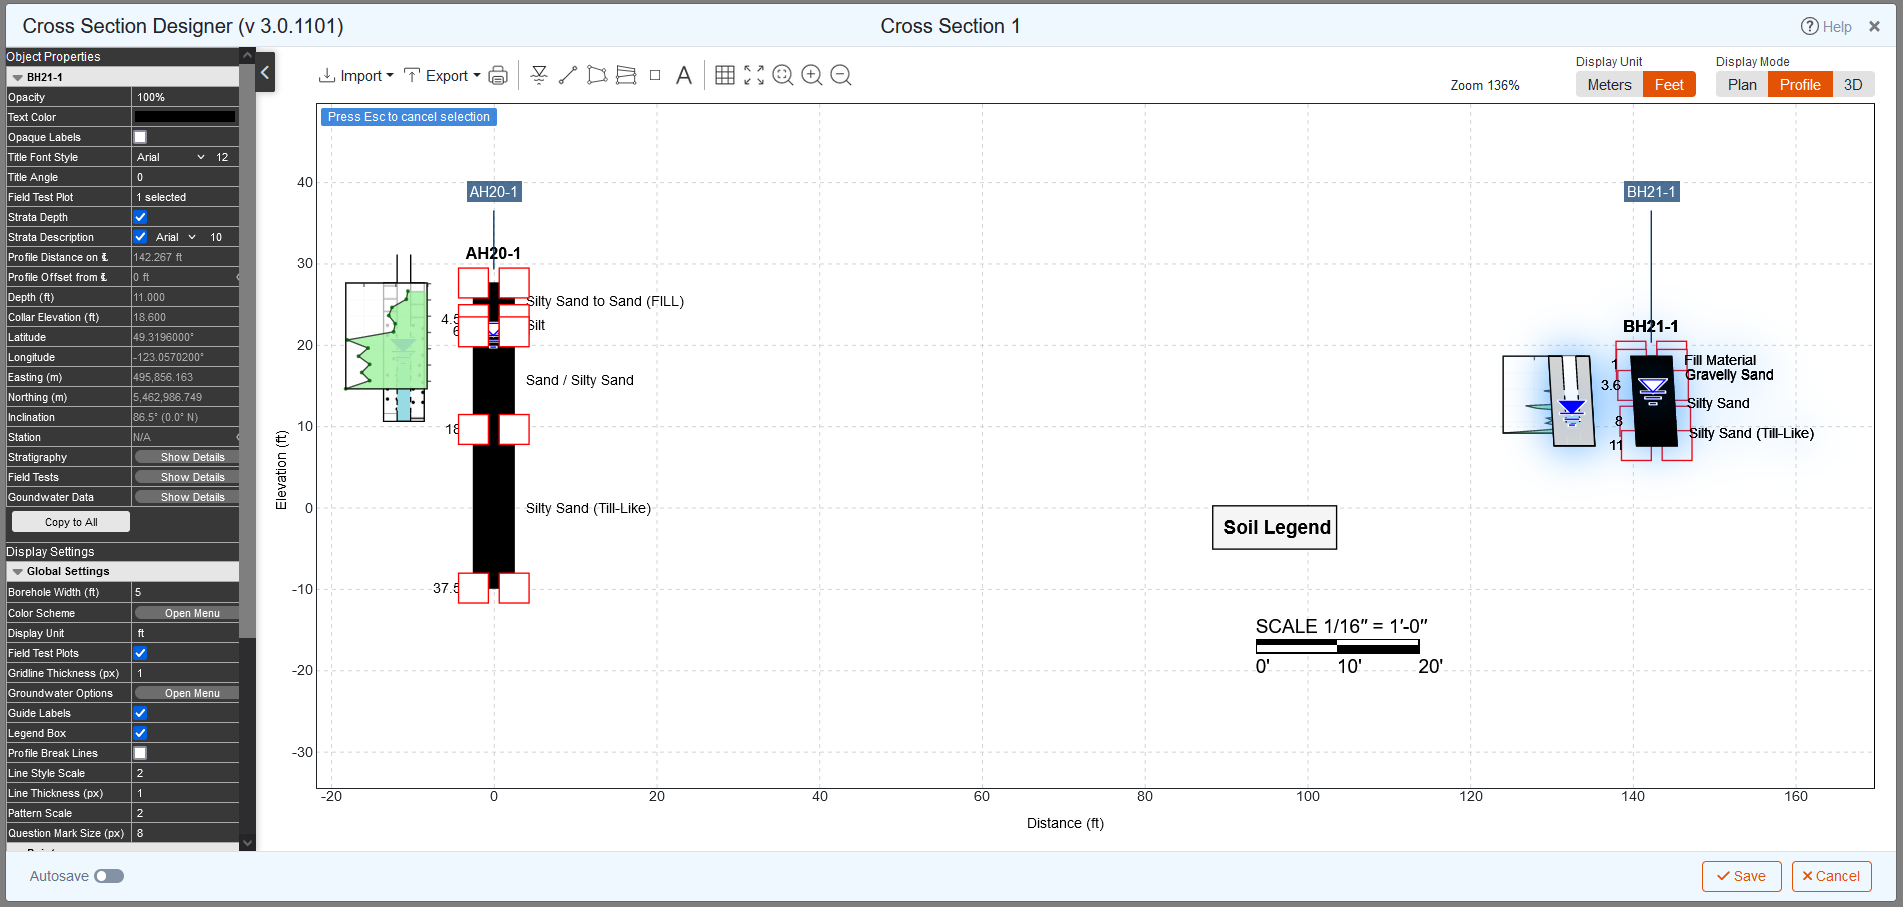
Your cross section will look as follows:
- Click Save in the bottom right.
4.0 Import Cross Section to Slide2 (Online)
We will now import this section into Slide2 as a soil profile. To do this:
- Launch Slide2.
- Select File > Import > Import RSLog Cross Section or use the toolbar icon
 .
. - Select Import from RSLog Account and click Next. You will see the dialog below:
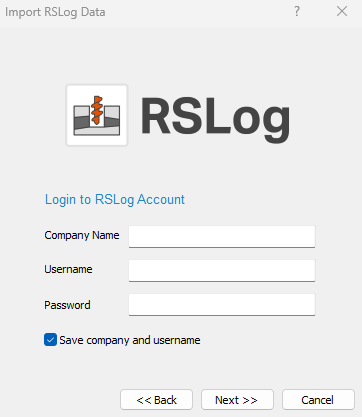 You can import cross sections either by logging into your RSLog account (online) or by importing a file saved to your machine (offline). We will use the online method. See the end of the tutorial for details on the offline method.
 - Input your credentials in the dialog and click Next. If multi-factor authentication is enabled on your account, another dialog will open and you will have to input an authentication code sent to your email before continuing.
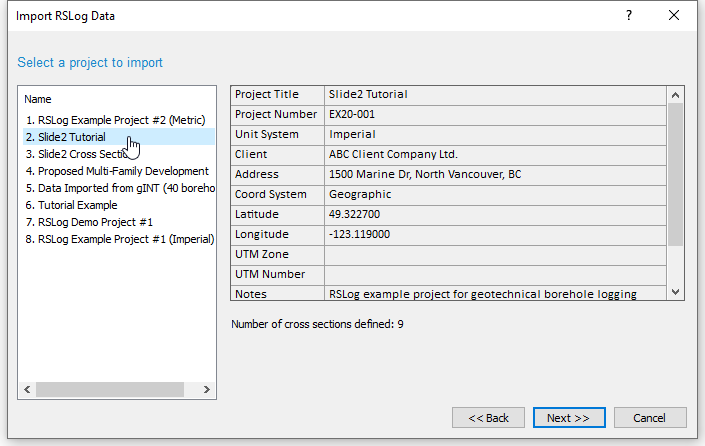
- You will now see the list of projects in your account. You can click on each one on the left side to see general details about each project.
- Select Slide2 Tutorial 28 on the left side and click Next.
- You will now see a preview image of the cross section we defined for this project.
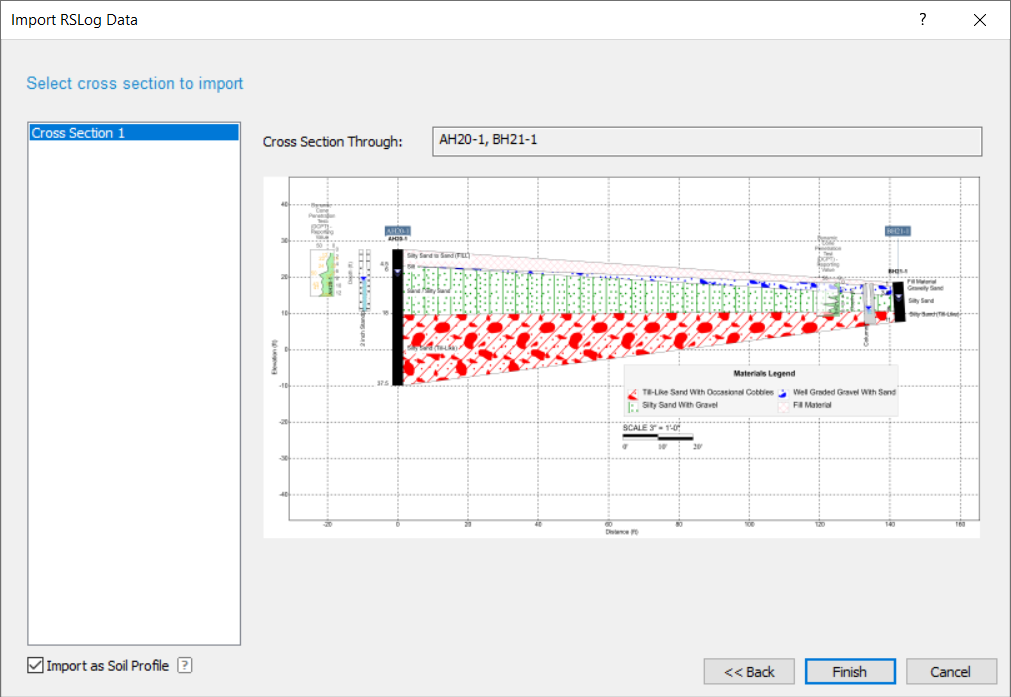
- Notice the Import as Soil Profile checkbox. By default, this is on, since the user would most likely need to cut the slope out of their cross section in Soil Profile mode. If you want to import the cross section directly as a slope, you can uncheck this box.
- Click Finish.
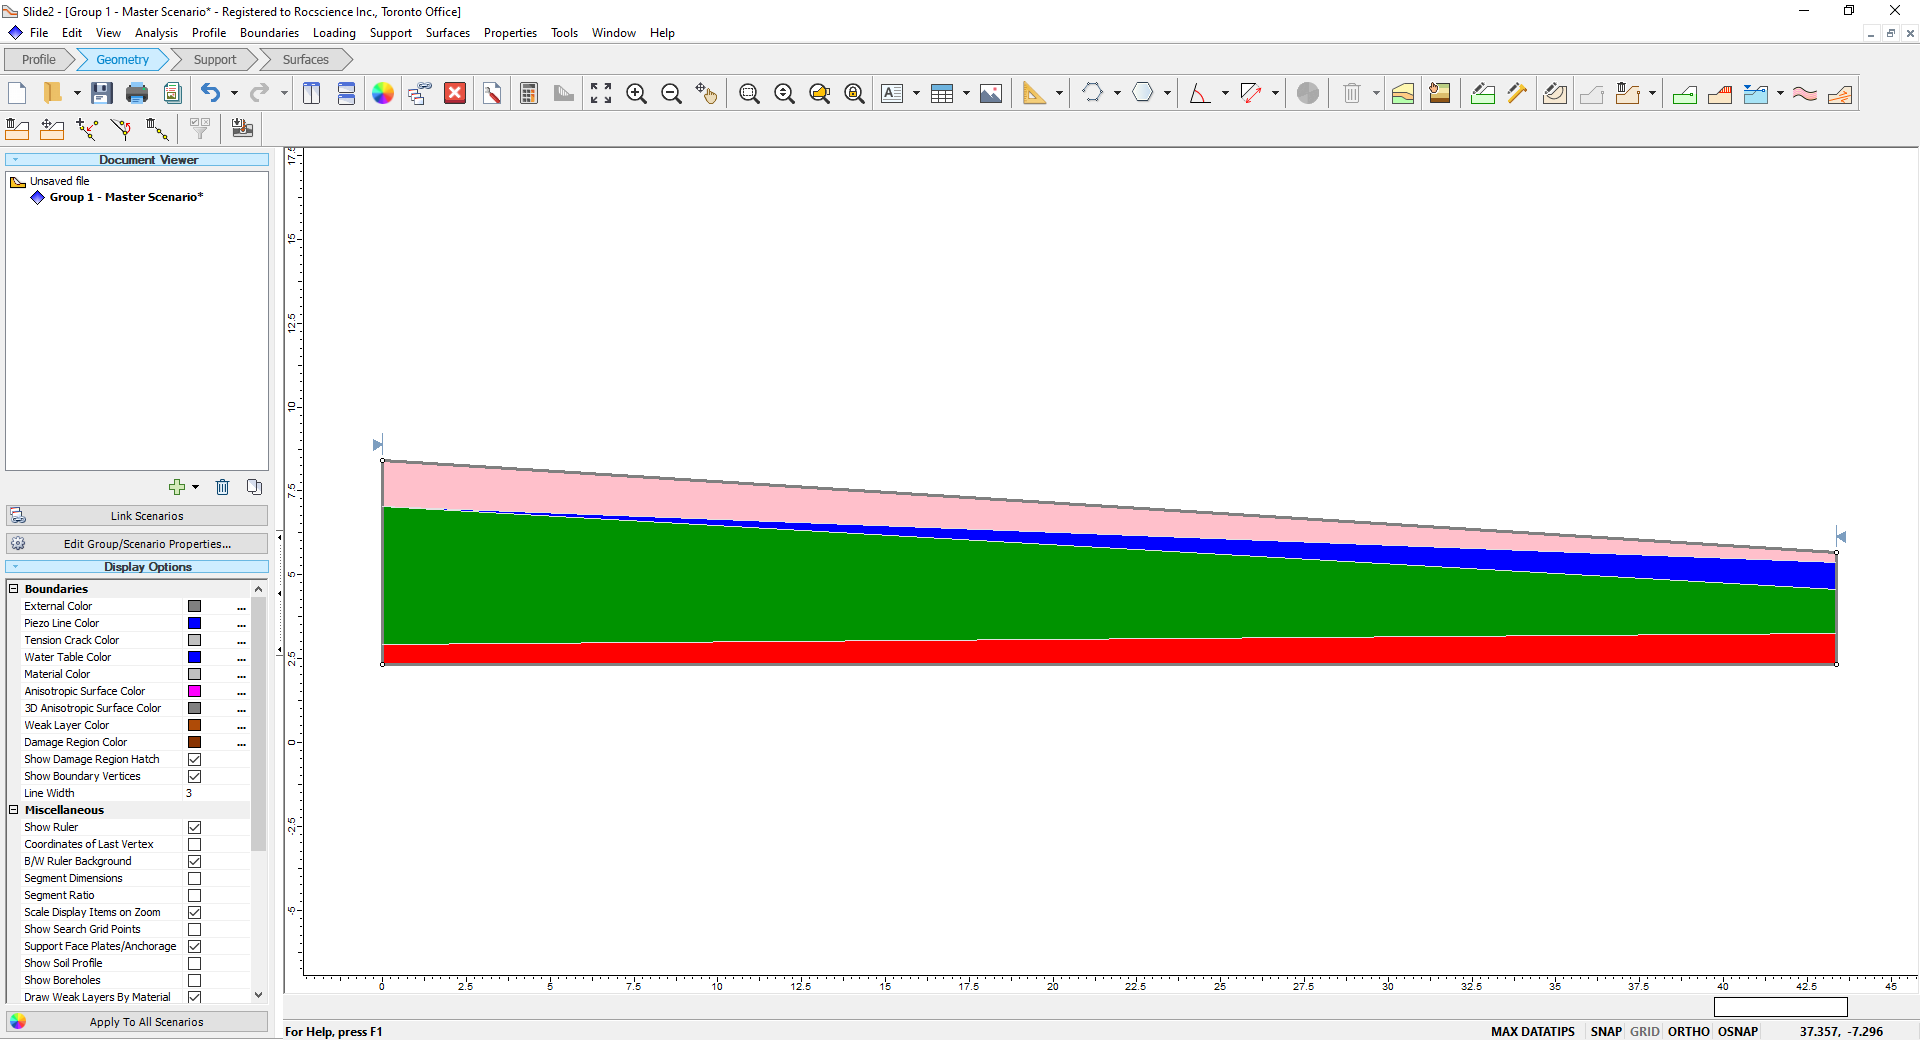
- You will see the cross-section as shown:
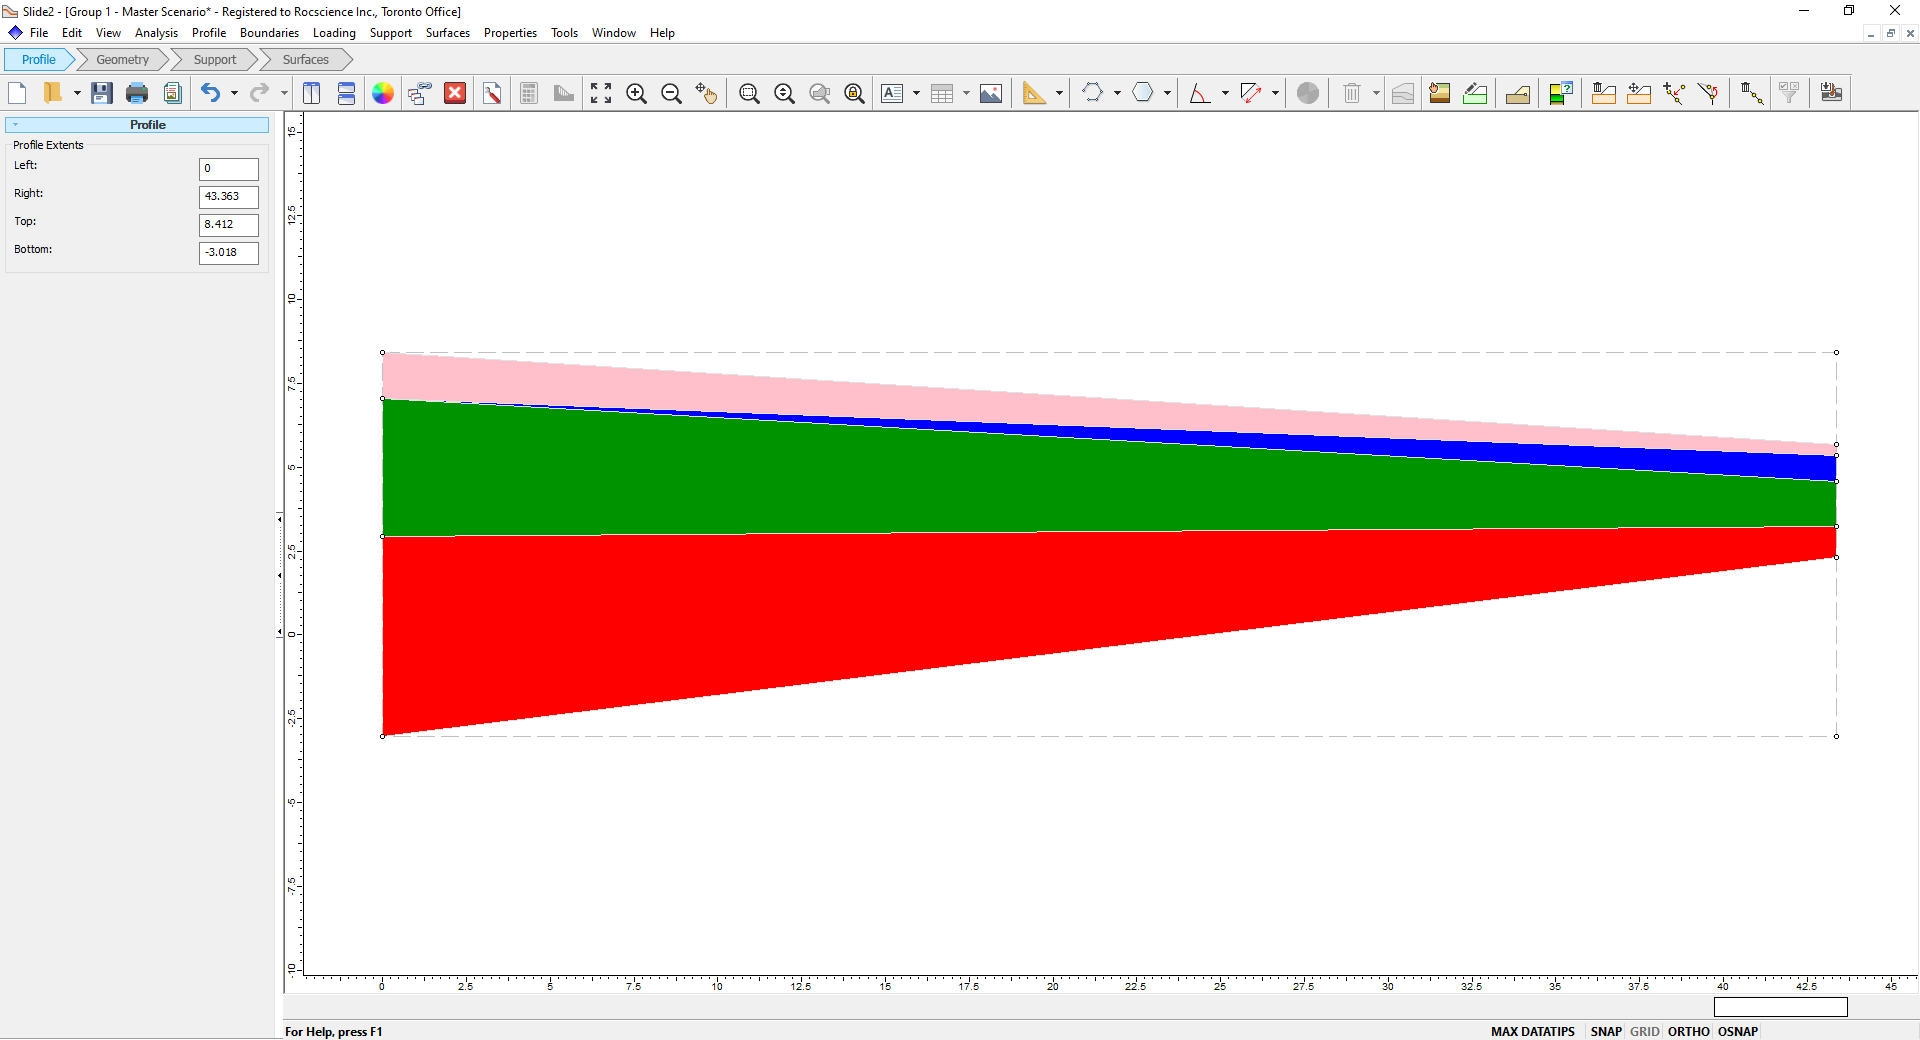
Notice that the colours are imported from the RSLog section. Select Properties > Define Materials. The materials displayed are named after the selected hatch. All materials are default Mohr-Coulomb and will need to be defined by the user. Click Cancel.
We can now cut the desired slope out of the section:
- Select the Geometry workflow tab.
- Select Boundaries > Add External Boundary.
- Click Add External as Window
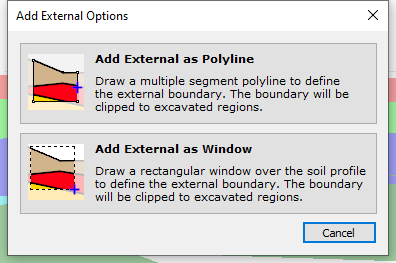
- Click on the top, left-most vertex.
- Then click on the bottom, right-most vertex (the right, bottom corner of the red layer).
- Click Yes in the warning message.
- Go to View > Display Options. Uncheck the Profile checkbox to hide the profile boundaries.
Your model will look as shown:
The user can then proceed with material property definitions and compute the analysis. This concludes the tutorial.
5.0 Import Cross Section to Slide2 (Offline)
The above example demonstrates the import of the RSLog cross section by logging into your RSLog account. If you won’t have internet access while making your Slide2 model, you can export the RSLog section ahead of time as follows:
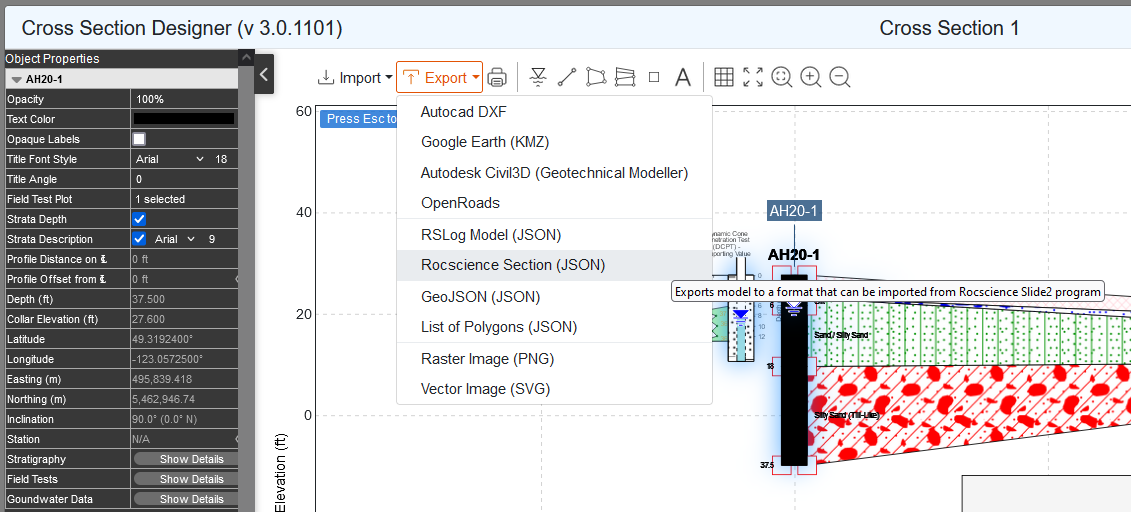
- In RSLog open our cross section.
- Click on the Export button at the top and select “Rocscience Section (JSON)”. This downloads a Rocscience Section file.
- In Slide2 select File > Import > RSLog Cross Section.
- This time, select Import from File and click Next.
- Click the Browse button.
- Select the file you downloaded in step 2 above and click Open.
- Click Finish in the wizard.