7 - Support Tutorial
1.0 Introduction
Various types of slope reinforcements (Supports) can be modelled in Slide2. This tutorial will demonstrate the modelling of a Grouted Tieback support system.
To show the impact of support on a slope, we will first determine the safety factor of the slope without any support and then with support.
Finished Product
The finished product of this tutorial can be found in Tutorial 07 Support.slmd in the Slide2 tutorials folder. All tutorial files installed with Slide2 can be accessed by selecting File > Recent Folders > Tutorials Folder from the Slide2 main menu.
2.0 Model Geometry
Open the Slide2 tutorials folder and select ‘Tutorial 07 Support – starting file.slmd’. The starter file has geometry and material properties already defined. The model comprises a rock fill embankment built on a single material layer.
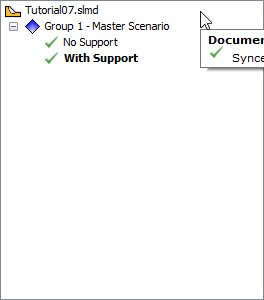
We will first create two scenarios from the Master Scenario.
-
Right-click on Group 1-Master Scenario in the Document Viewer and select Add Scenario
 Repeat this action to create a second scenario.
 - Rename the scenarios ‘No Support’ and ‘With Support’ respectively, using the right-click option.
- Now click on the ‘No Support’ scenario. We will start by computing the factor of safety of the non-reinforced slope.
- Select Analysis > Compute
 and choose the ‘No Support’ scenario to only run that analysis.
 - When computations are done, select Analysis > Interpret
 to view results. (This will launch the Interpret window).
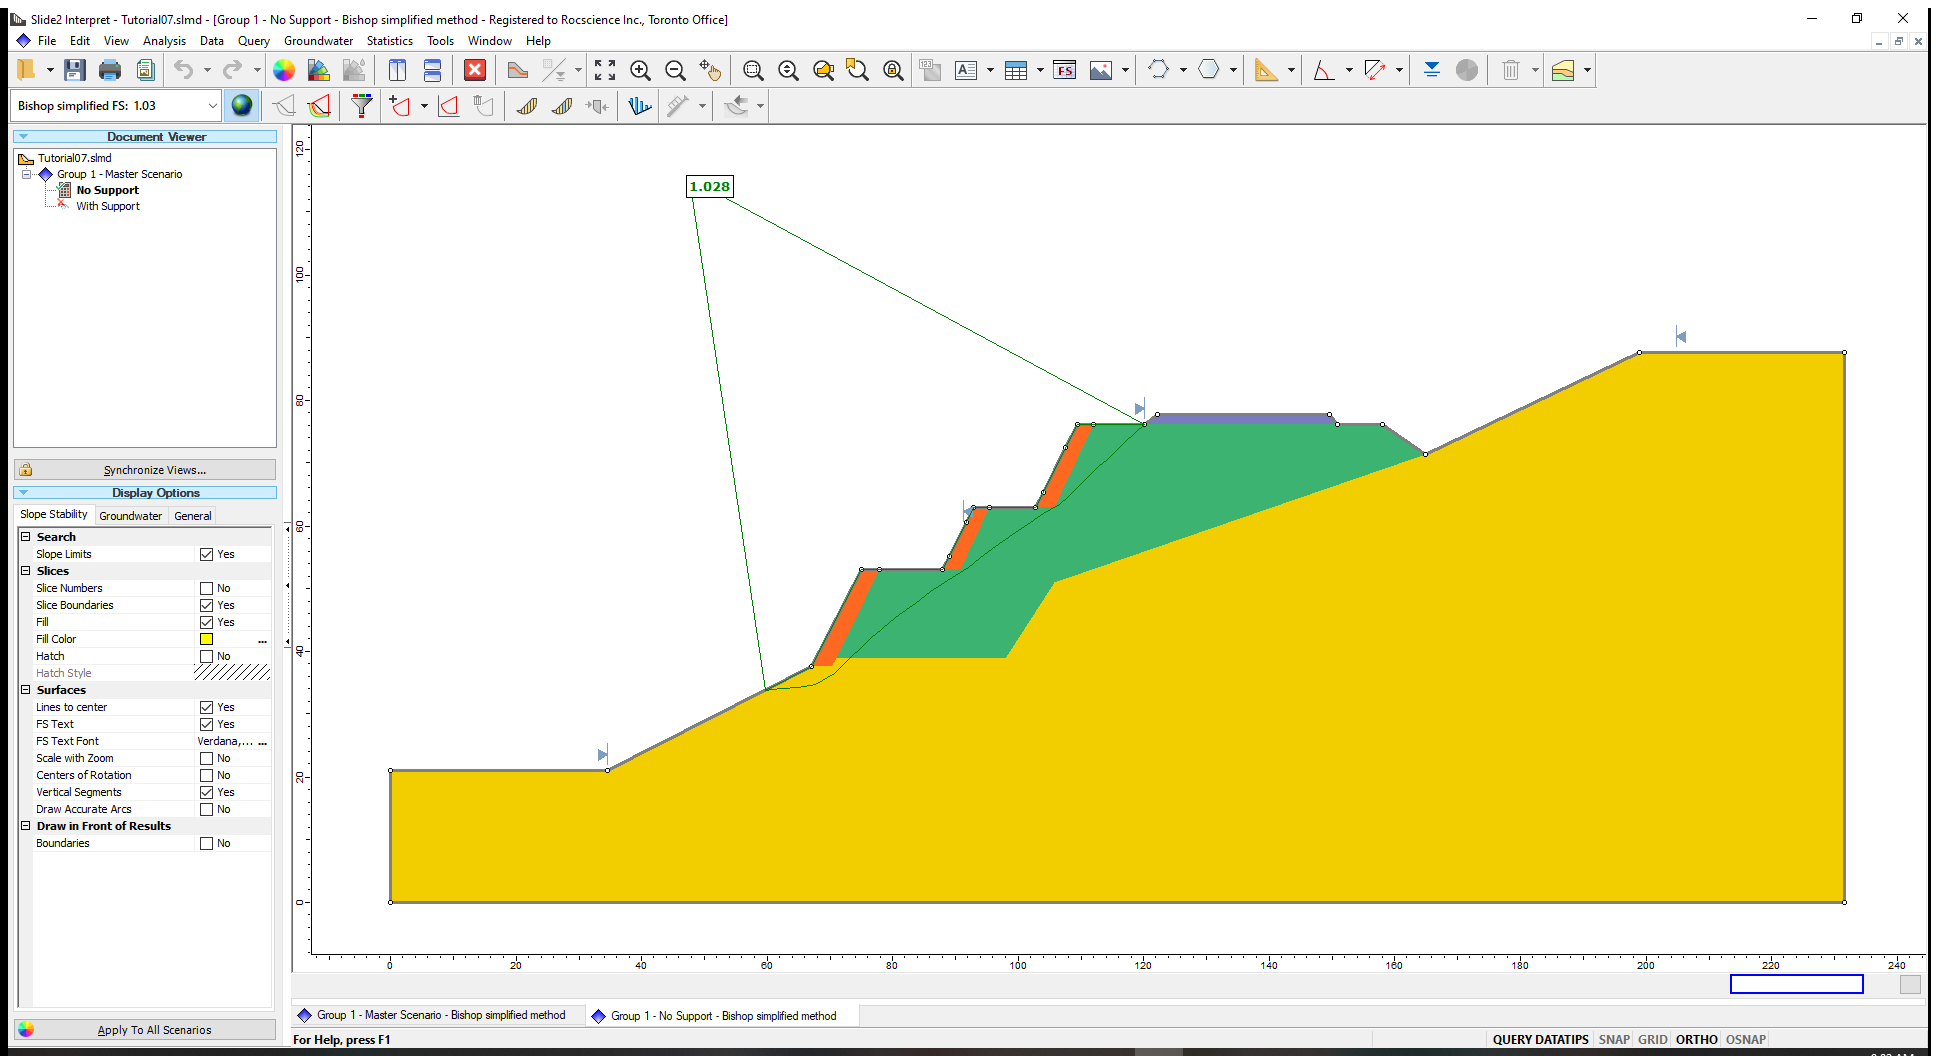
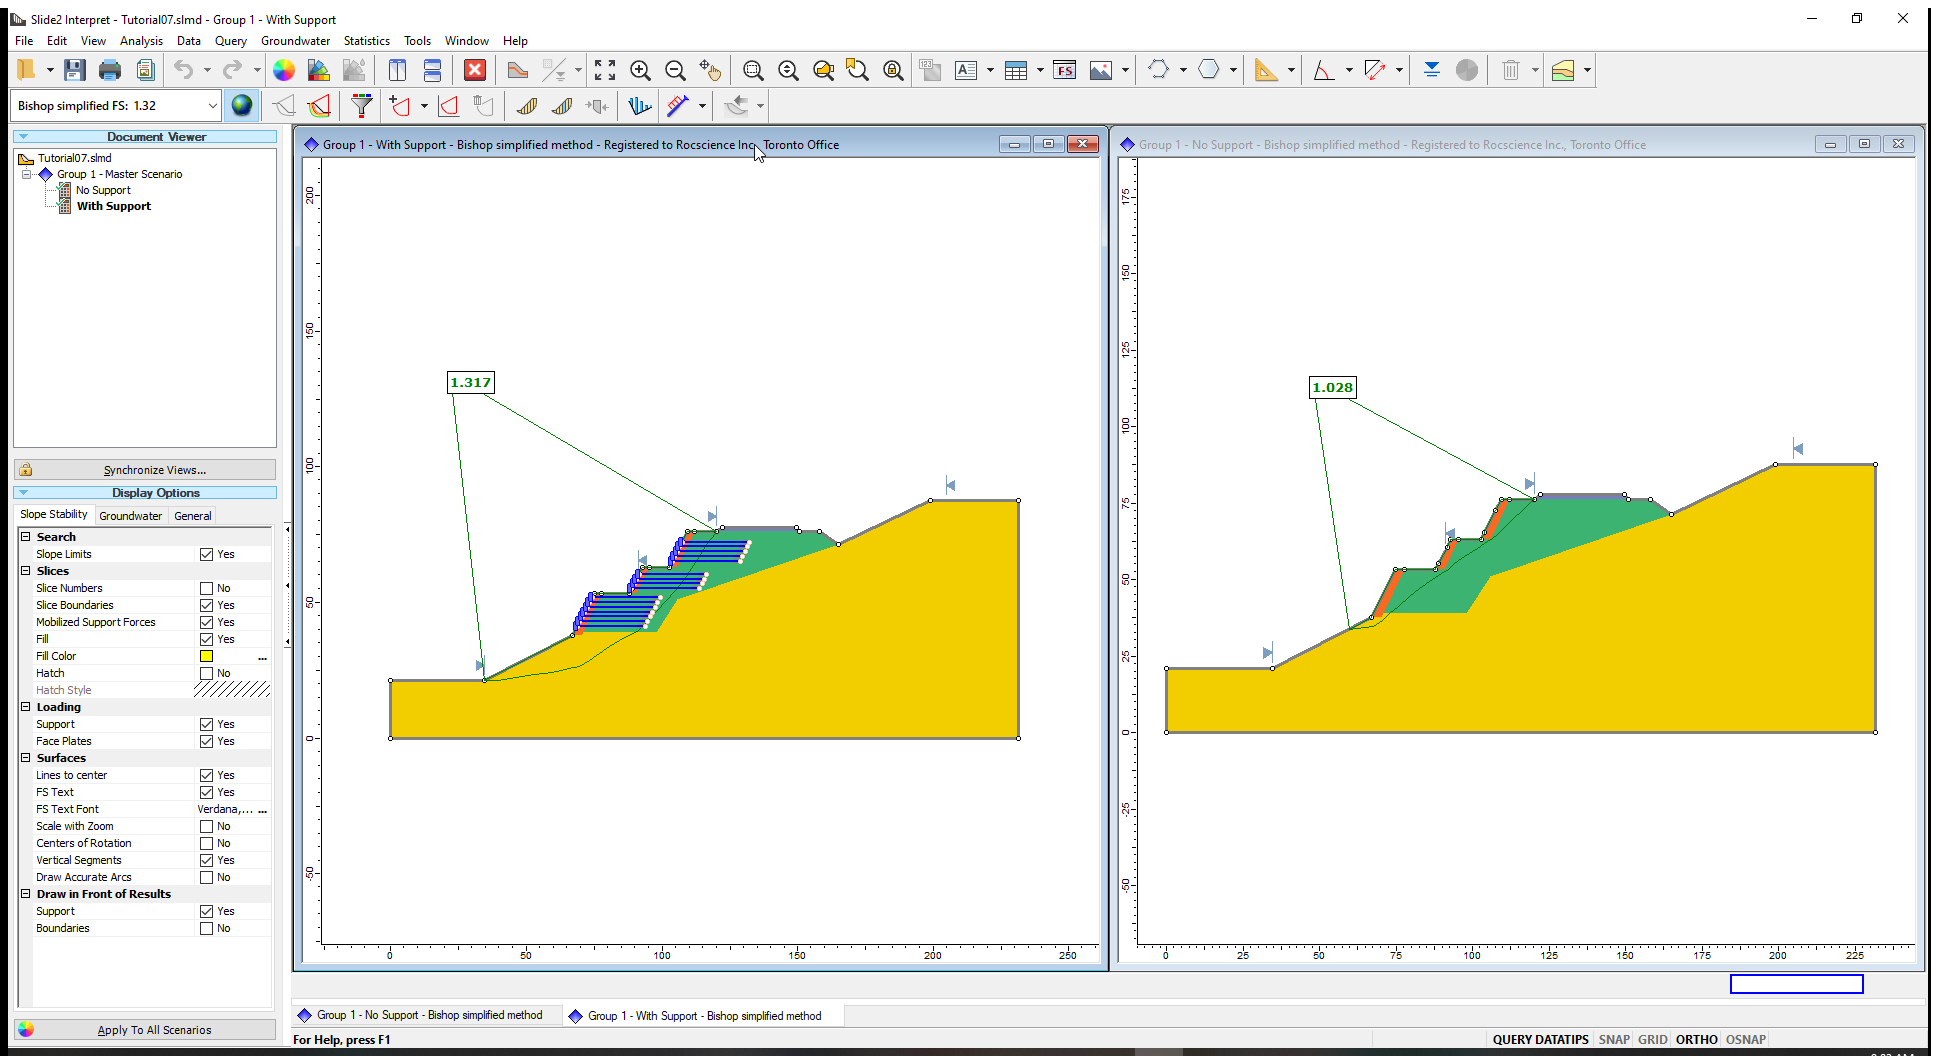
From the analysis, the safety factor of the slope as shown above is just above 1.0 and lies mainly within the green rock fill.We will add support to the rock fill and run the analysis again.
- Close the Interpret window to return to Modeller.
- Select the ‘With Support’ scenario to add support to the slope.
3.0 Support
We will support the rock fill embankment with uniformly spaced Grouted Tiebacks. We will also define the properties of the support.
3.1 Add Support Pattern
To add a support pattern:
- Select Support > Add Support Pattern
 to open the Support Pattern dialog.A Support must intersect a slip surface to improve its factor of safety. If a support element does NOT intersect a slip surface, it will NOT apply support forces to the slip surface and will therefore not affect the safety factor of that slip surface.
Different lengths of supports with different spacing can be used when applying supports. We will apply uniformly spaced Grouted Tiebacks in this tutorial.
Enter the following parameters:
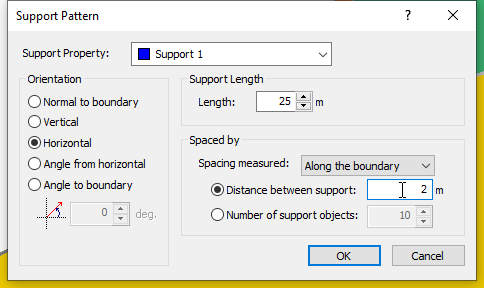
Orientation Length (m) Distance between support (m) Horizontal 25 2 - Click OK to close the dialog when done.
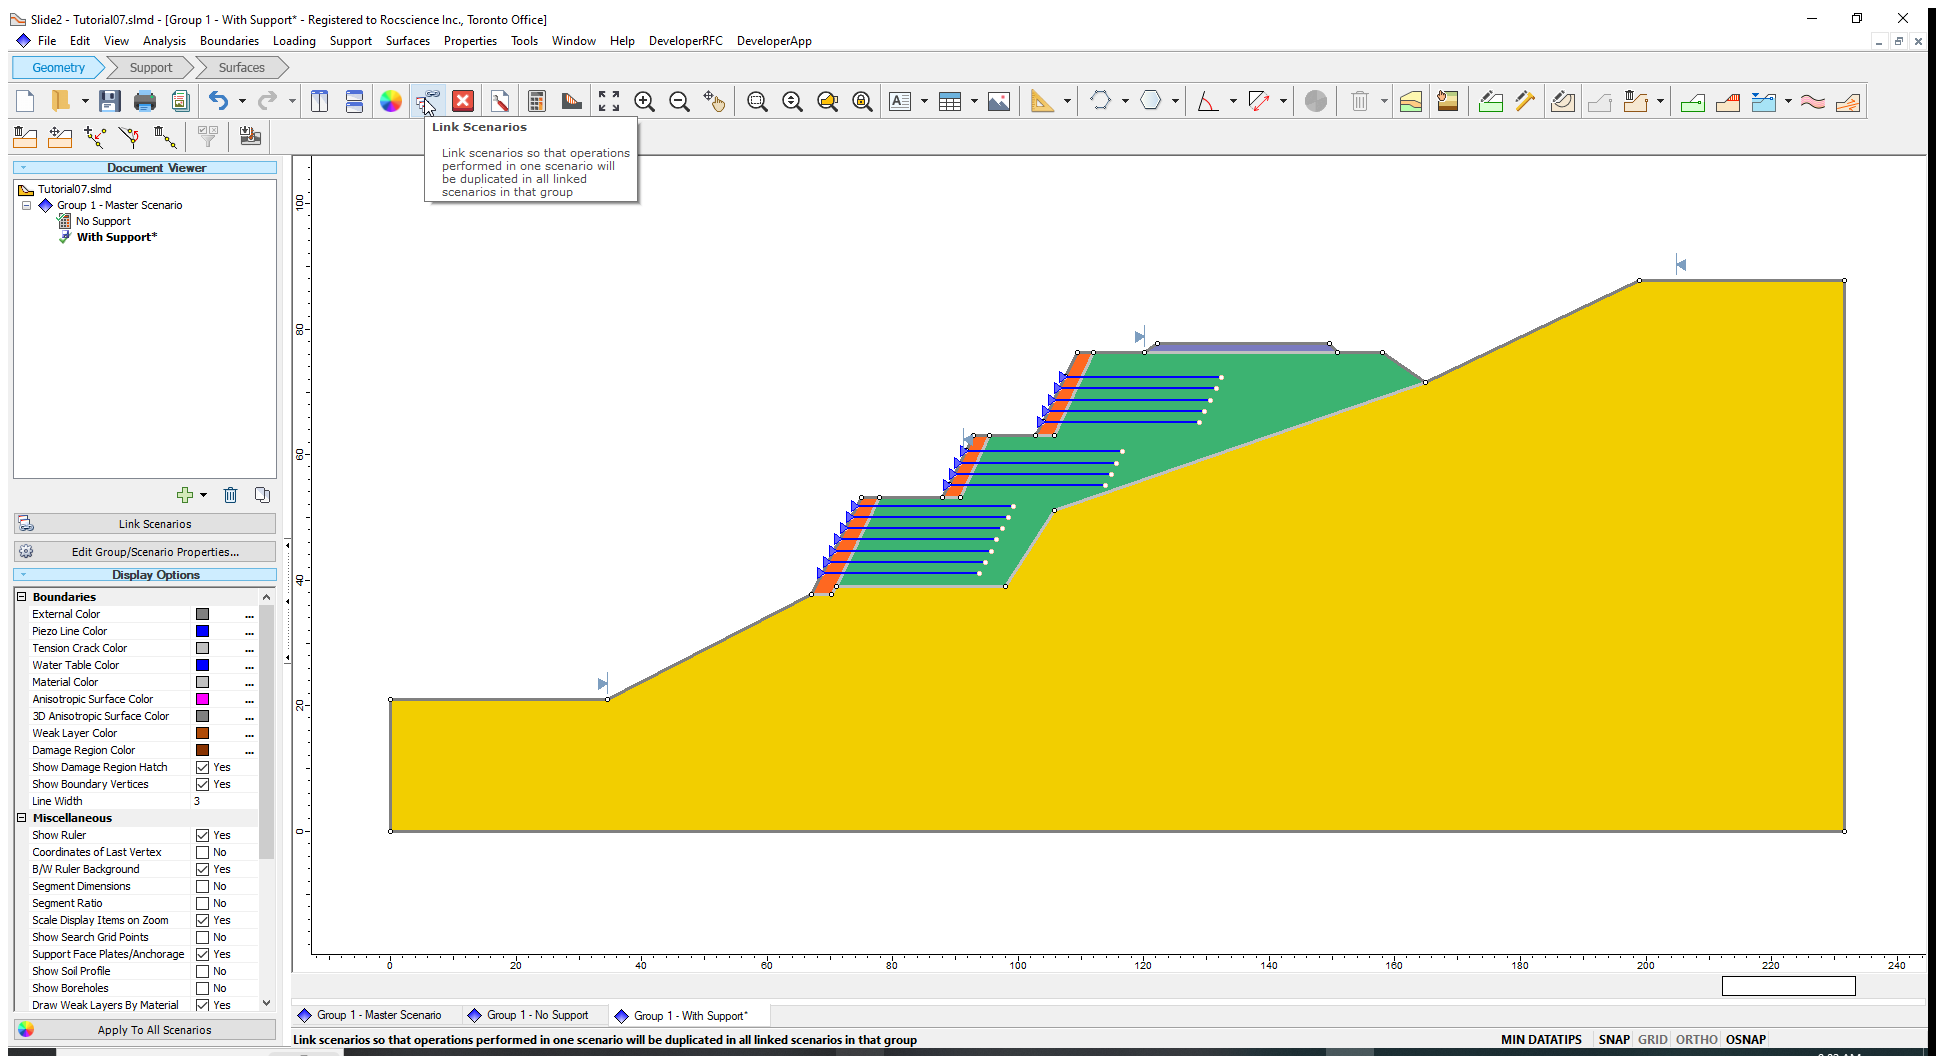
- Enter the first and second coordinates (69,41) and (74,52) in the Prompt line, pressing enter after each point, to apply the support pattern to the face of the rock fill embankment.
- The second and third set of supports we will assign visually, using the pre-defined vertices.
- Select Support > Add Support Pattern and add support between the two vertices on the second bench (see figure below). Then repeat the steps with the vertices on the third bench.
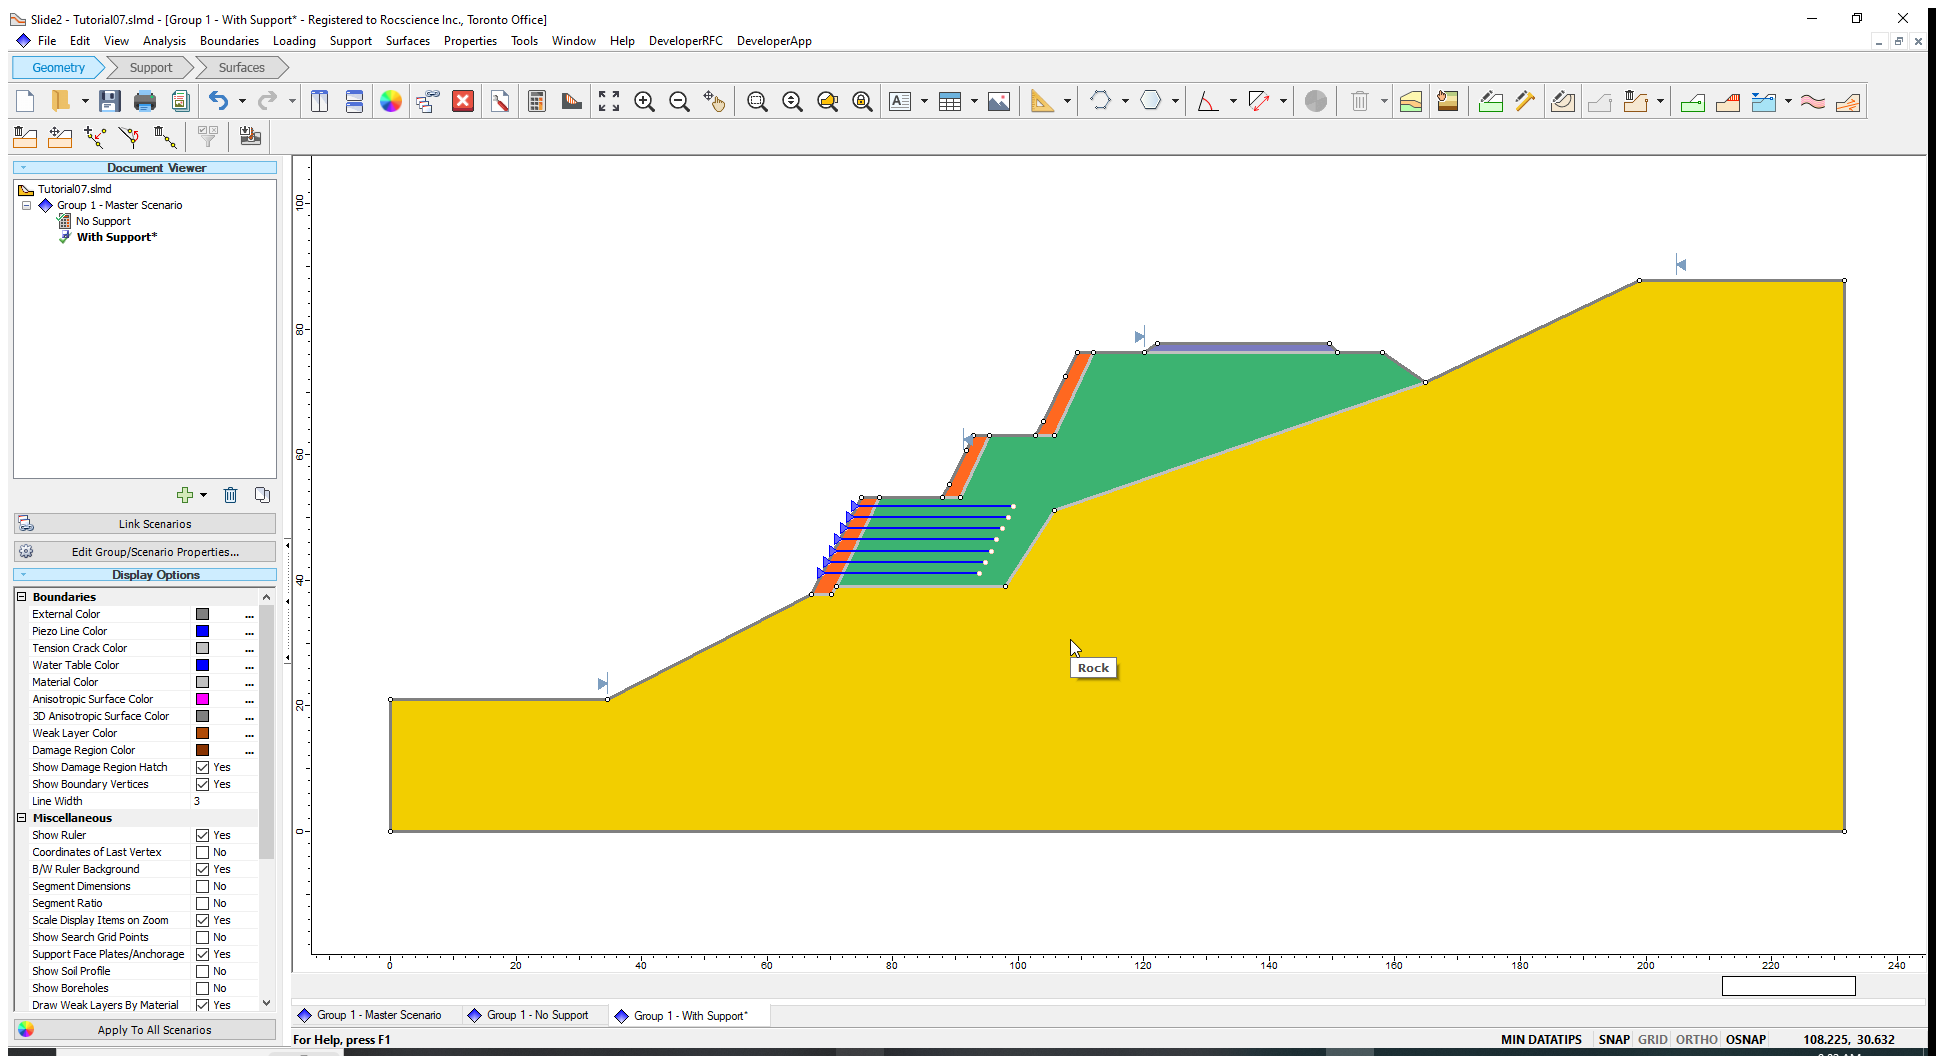
Your model with all the supports applied should look like this:
3.2 Define Support Properties
Now we will define the properties of the Grouted Tieback support.
- Select Properties > Define Support

- Select Support 1 and change the Support Type to Grouted Tieback.
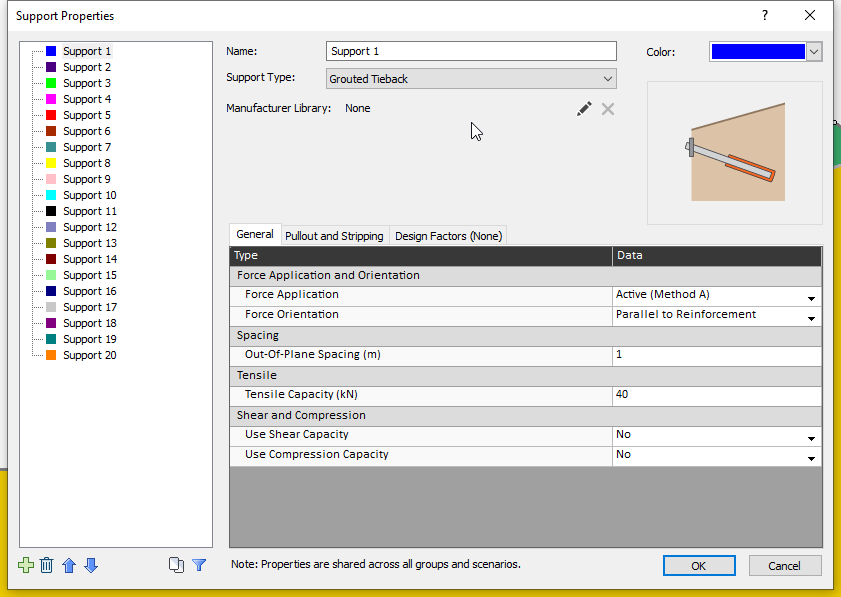
The Manufacturer Library option in the Support Properties dialog can be used to reference the support properties of dozens of widely used support types. The available manufacturers have collaborated with Rocscience to provide these specifications for the convenience of users.
We will use a Dextra ASTEC Active Anchor TB3-10 from the Dextra manufacturer as our Grouted Tieback support.
To access the Manufacturer Library:
- Click the Edit
 button next to the Manufacturer Library field.
 - Select the following specifications:
- Manufacturer: Dextra
- Type: ASTEC Active Anchor
- Designation: TB3-10
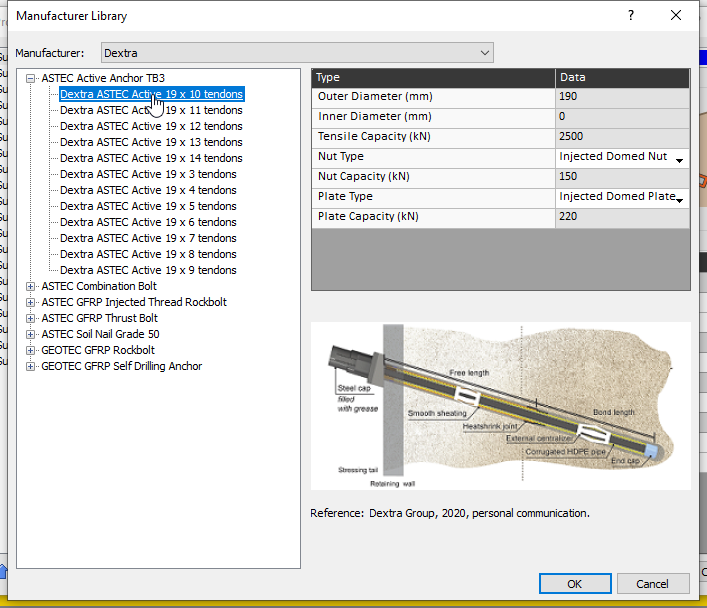
- Notice the data associated with this support on the right-hand side. The tensile capacity will be used for our grouted tieback’s tensile capacity and the minimum of the plate and nut capacities will be used for the plate capacity.
- Click OK to close the dialog and return to the Support Properties dialog.
The type of Grouted Tieback Support (TB3-10) is now displayed beside the Manufacturer Library field.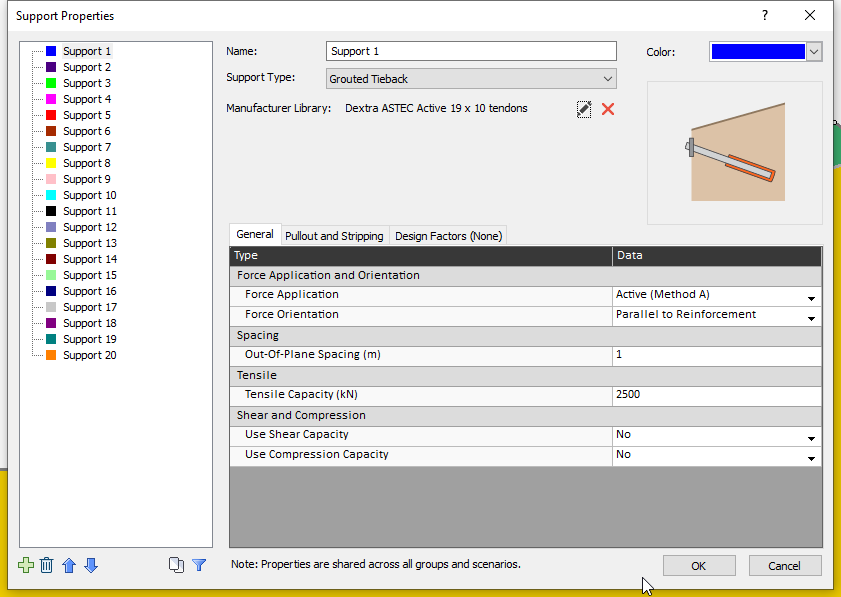
Under the General tab, the Tensile Capacity of the support is 3000 kN as seen in the Manufacturer Library. Under the Pullout and Stripping tab, the Plate Capacity is 2500 kN/m.
- We will keep the defaults for the other parameters. Click OK.
We can now compute our model with supports.
4.0 Compute
- Click on the Compute icon
and select both scenarios to begin computations.
5.0 Interpret
- Once calculations are completed, click the Interpret icon to interpret/view the results.
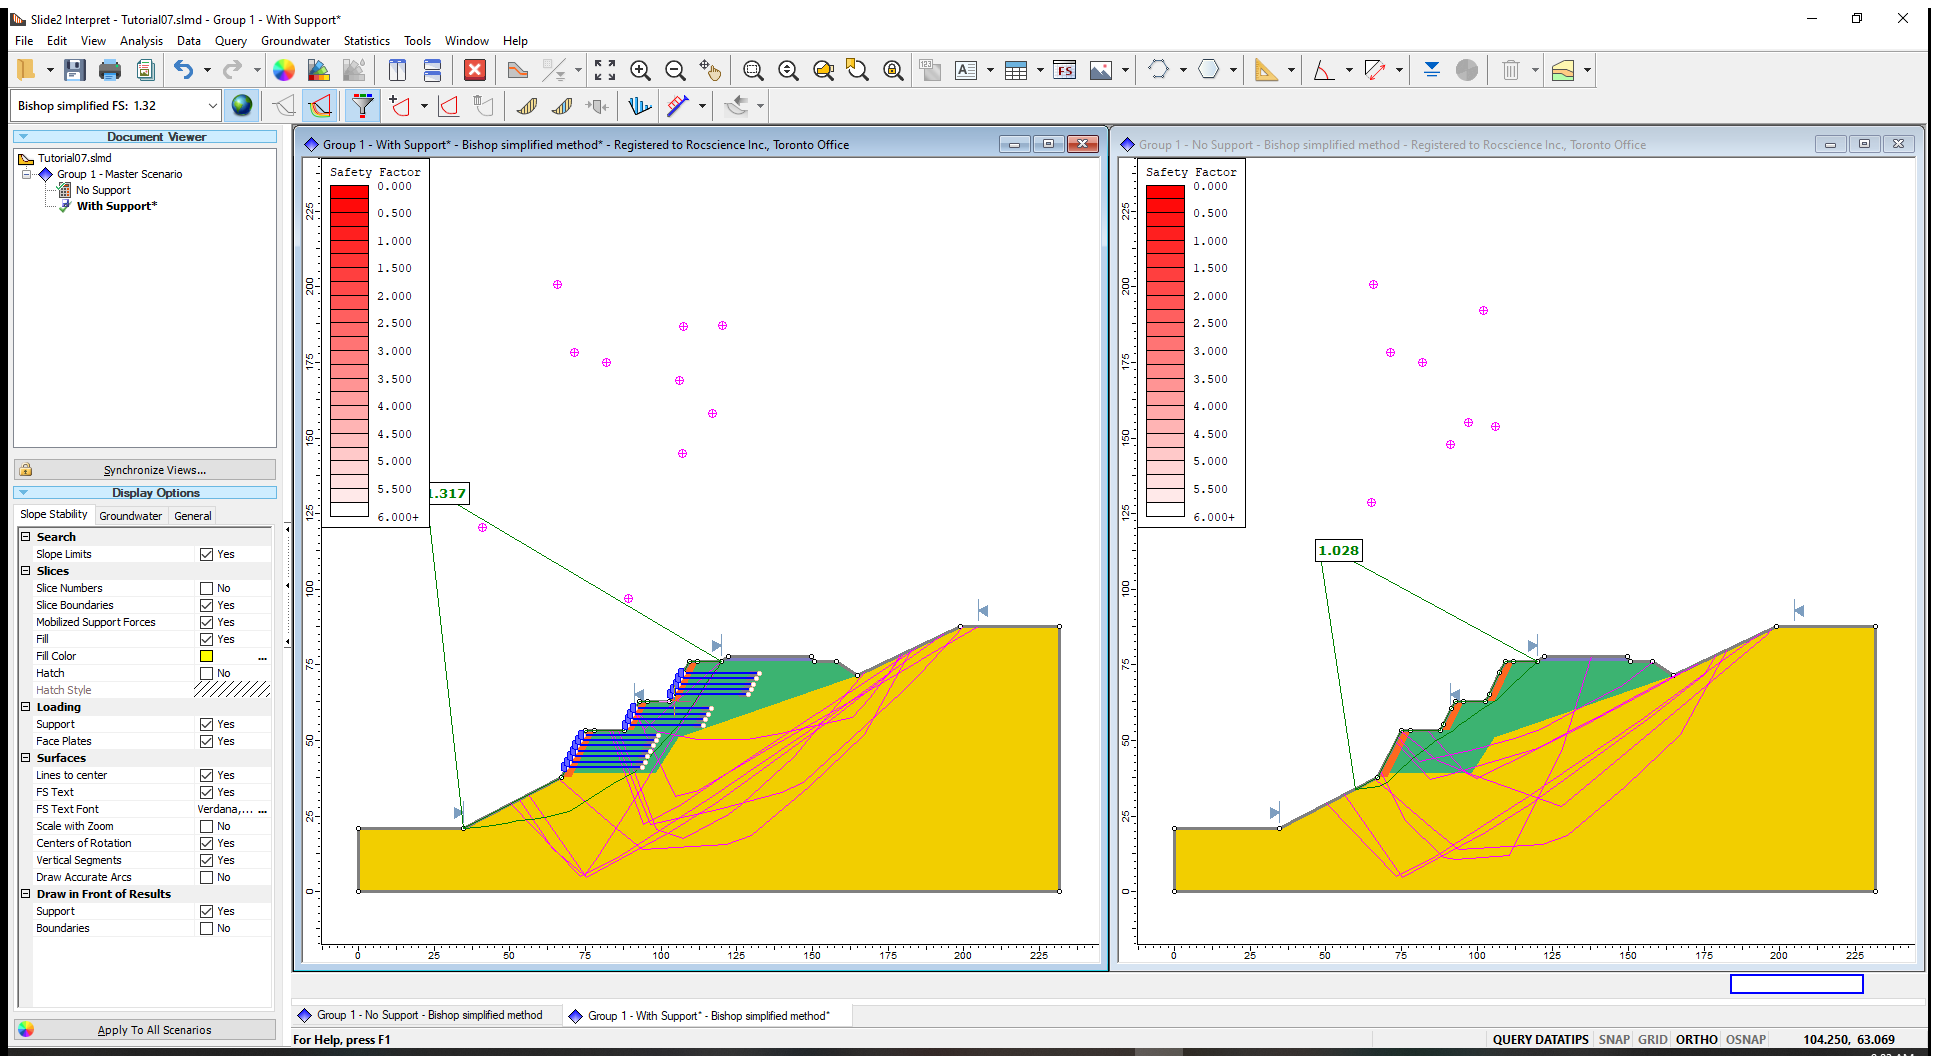
- For easy comparison of the two scenarios, select Window > Tile Vertically or click the Tile Window Vertically
 icon
to display results side by side as shown below. You can also select View > Zoom > Lock View
icon
to display results side by side as shown below. You can also select View > Zoom > Lock View  This will allow us to zoom in and out of both models at once.
The Spencer factor of safety of the slope without support is approximately 1.04, which is unsafe, and the critical slip surface lies within the rock fill embankment.
After installing support, the safety factor of the slope increased from 1.0 to 1.3.
The addition of support also changed the location of the Global Minimum surface to be deeper in the slope.
5.1 Filtering Surfaces
We will filter out:
- Slip Surfaces with the lowest factors of safety, for each scenario
- Slip Surfaces for which no safety factor was calculated (Invalid surfaces).
Perform the following actions for both of the scenarios:
- Select Data > All Surfaces
 to view all Slip Surfaces generated from the analysis.
 - Click the Zoom All
 button to view your entire window as shown below.
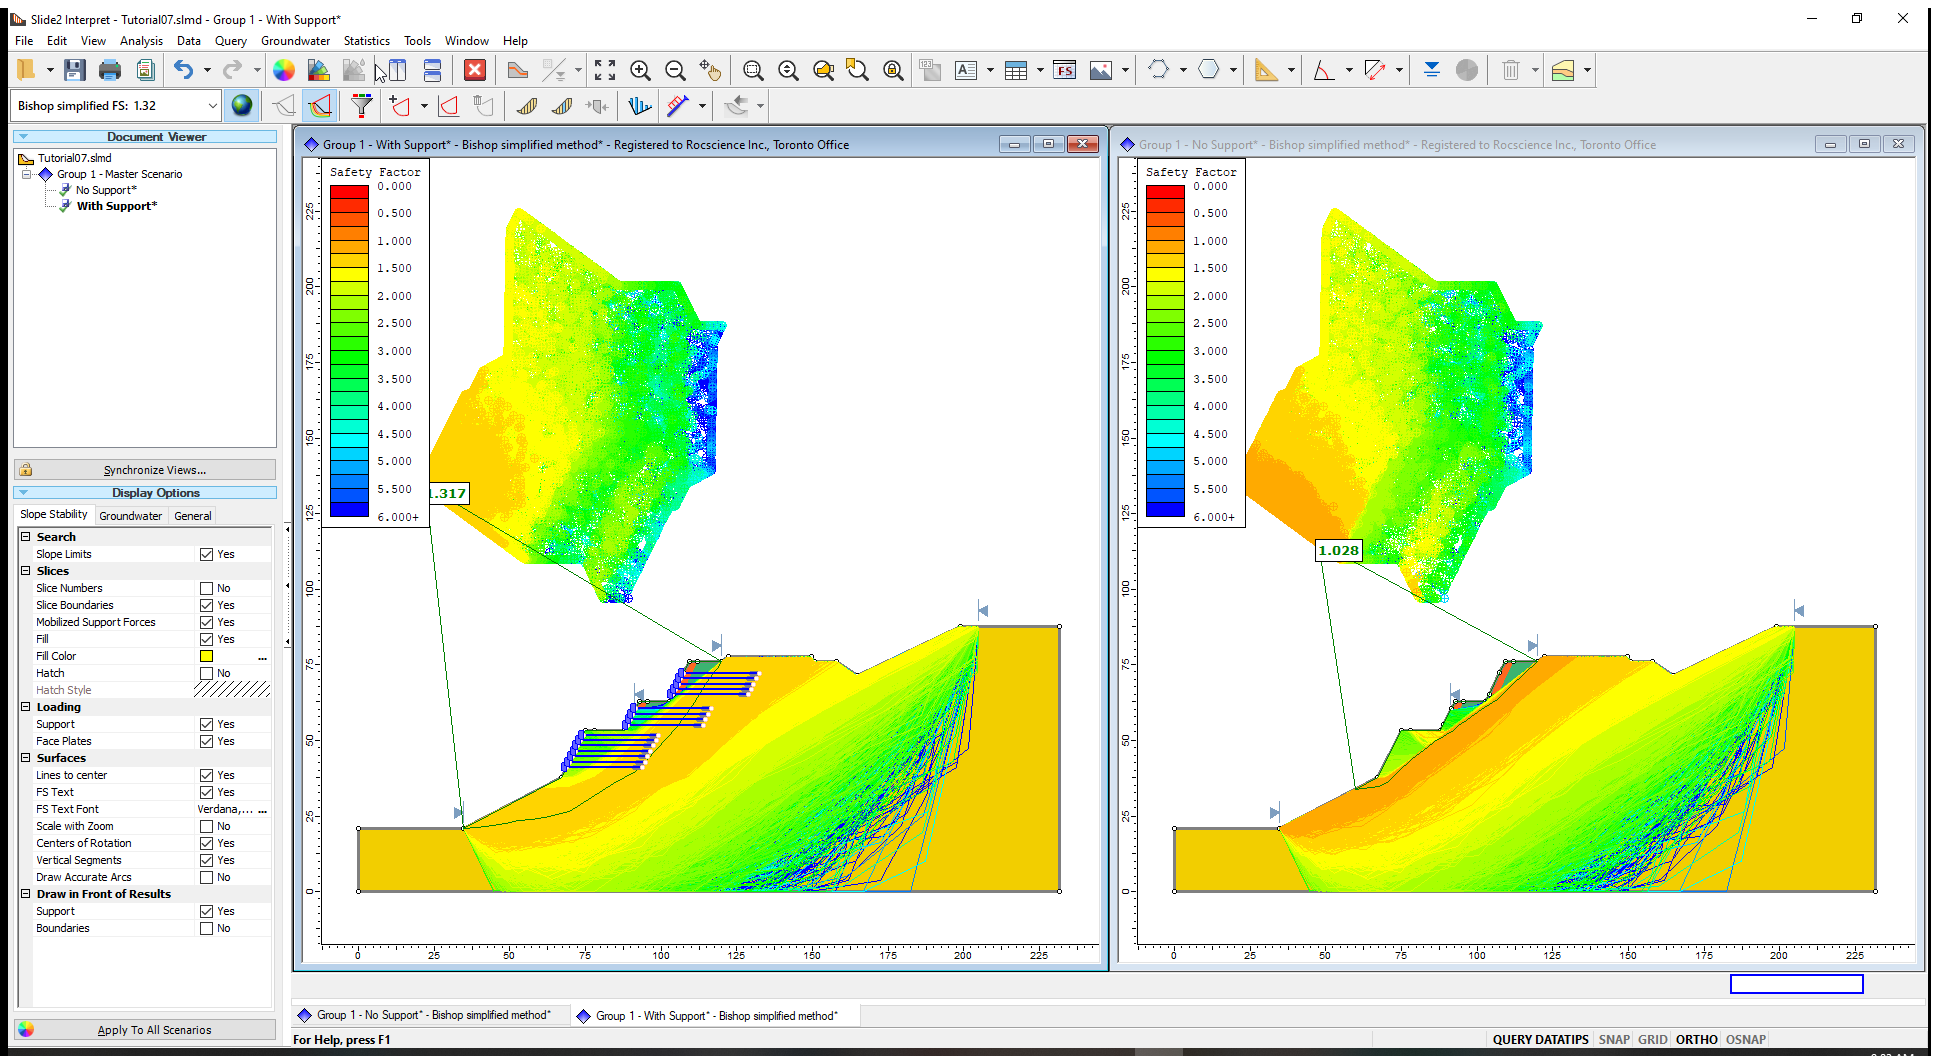
- Select Data > Filter Surfaces
 to open the Filter Surfaces dialog.
 - Select the third option ‘surfaces with lowest factors of safety’ and enter the number of surfaces as ‘50’ as shown on the dialog below.
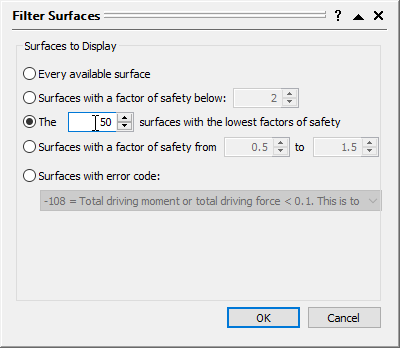
- Click OK to close the dialog.
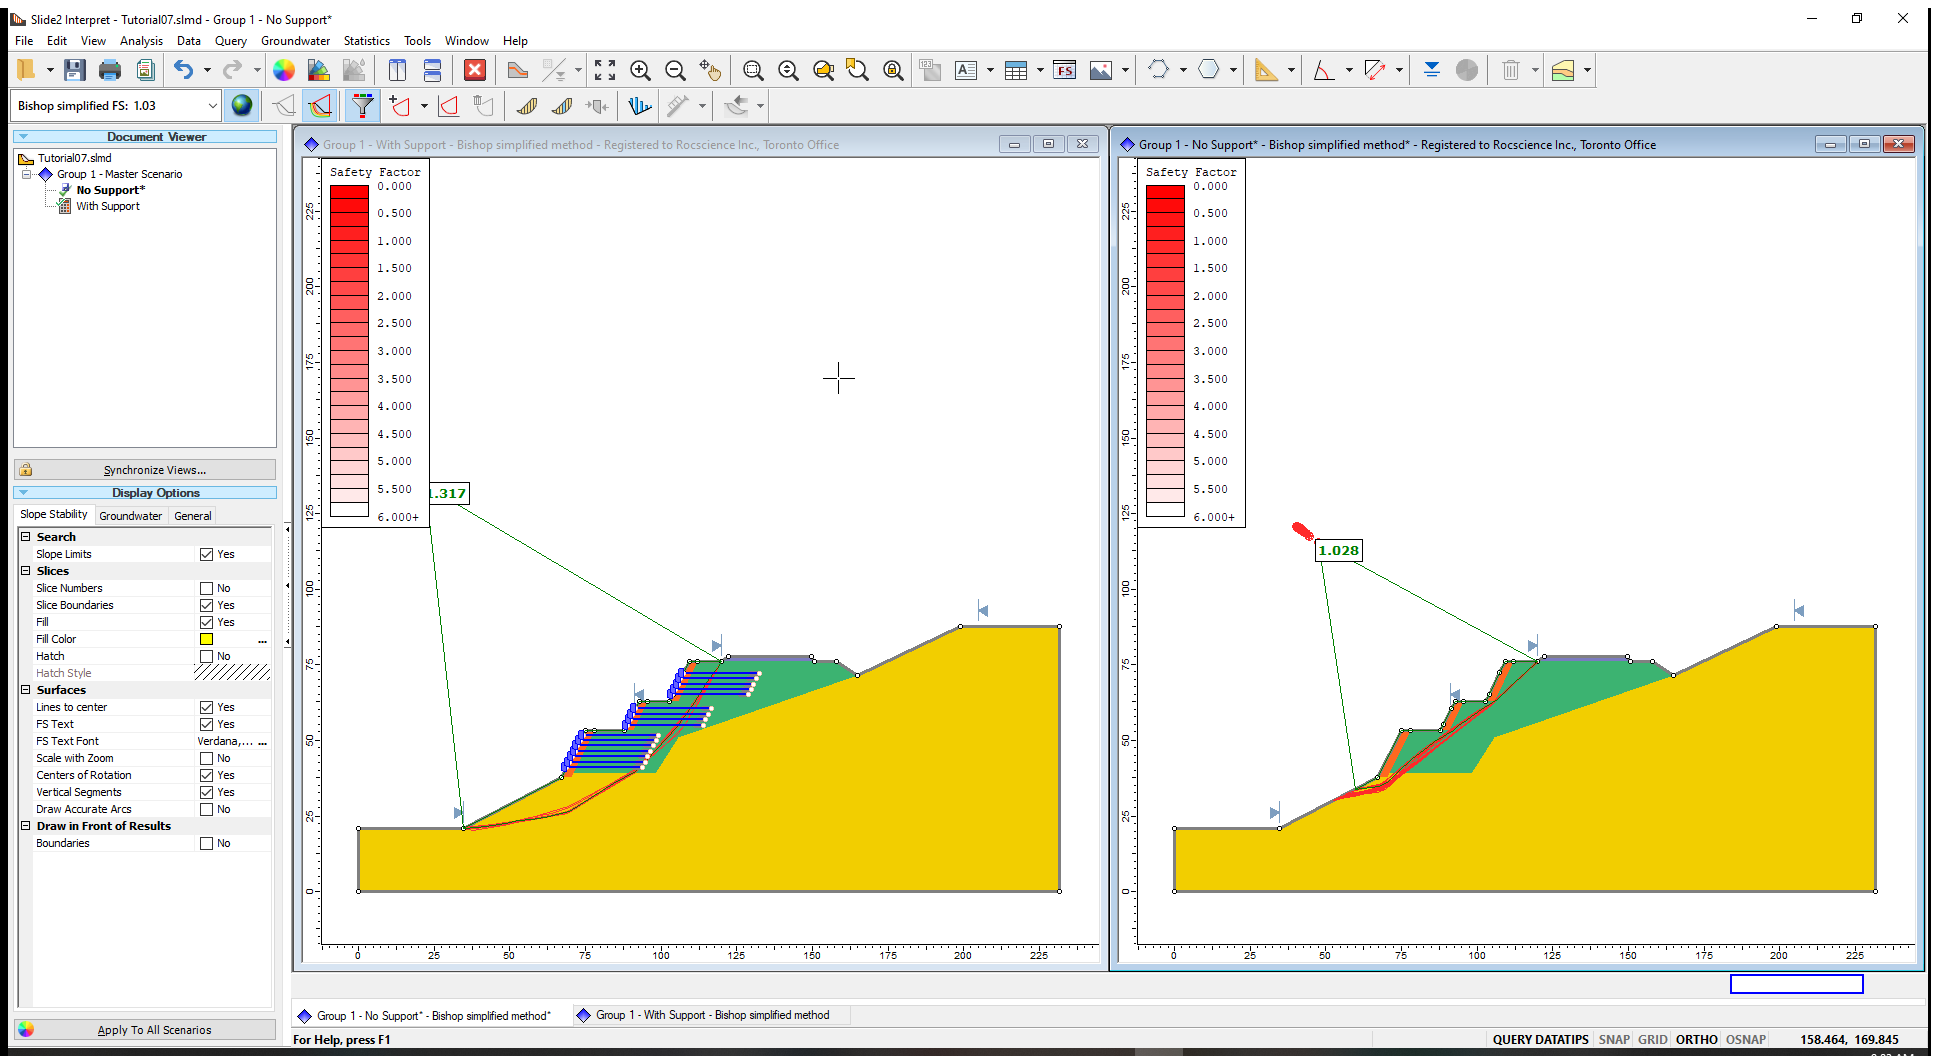
The filtered surfaces are difficult to see because they have nearly the same colour as the slope material.
To view the filtered surfaces more easily:
- Right-click anywhere on the model and select Contour Options

- In the Contour Options dialog, change the Hot to Cold format to Hot Spots.
- Click Done to close the dialog.
The slip surfaces with the lowest factors of safety for each scenario can now be clearly seen as shown below, and the impact of the support observed.
Next, we will view the slip surfaces for which no safety factor could be calculated. Slide2 has different error codes to identify Invalid Surfaces.
- Click on the Filter Surfaces icon to open the dialog.
- Select the Surfaces with error code option.
- Select the first error code (–108 = Total driving moment or total driving force<0.1)
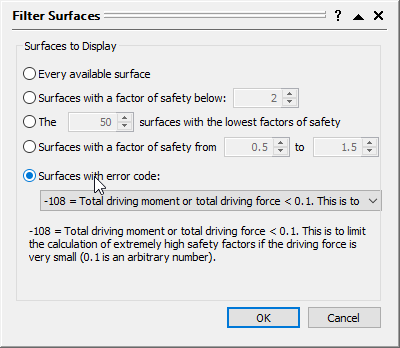
- Click OK to close the dialog.
All surfaces with Error Code –108 (driving force or moment < 0.1), are now displayed in purple on the model, as shown in the above figure.
For these slip surfaces, the applied support loads on the slip surfaces are sufficient to generate a very small or negative driving moment. In the current model, this tends to move the sliding mass from left to right, rather than the specified right to left, and hence a valid safety factor cannot be calculated.
We can view the number of Valid and Invalid Surfaces for any analysis method in the Report Generator.
- Select: Analysis > Report Generator

- Select Valid and Invalid surfaces in the Table of Content or scroll down the Report Generator listing to see the number of Valid and Invalid Surfaces, for each analysis method.
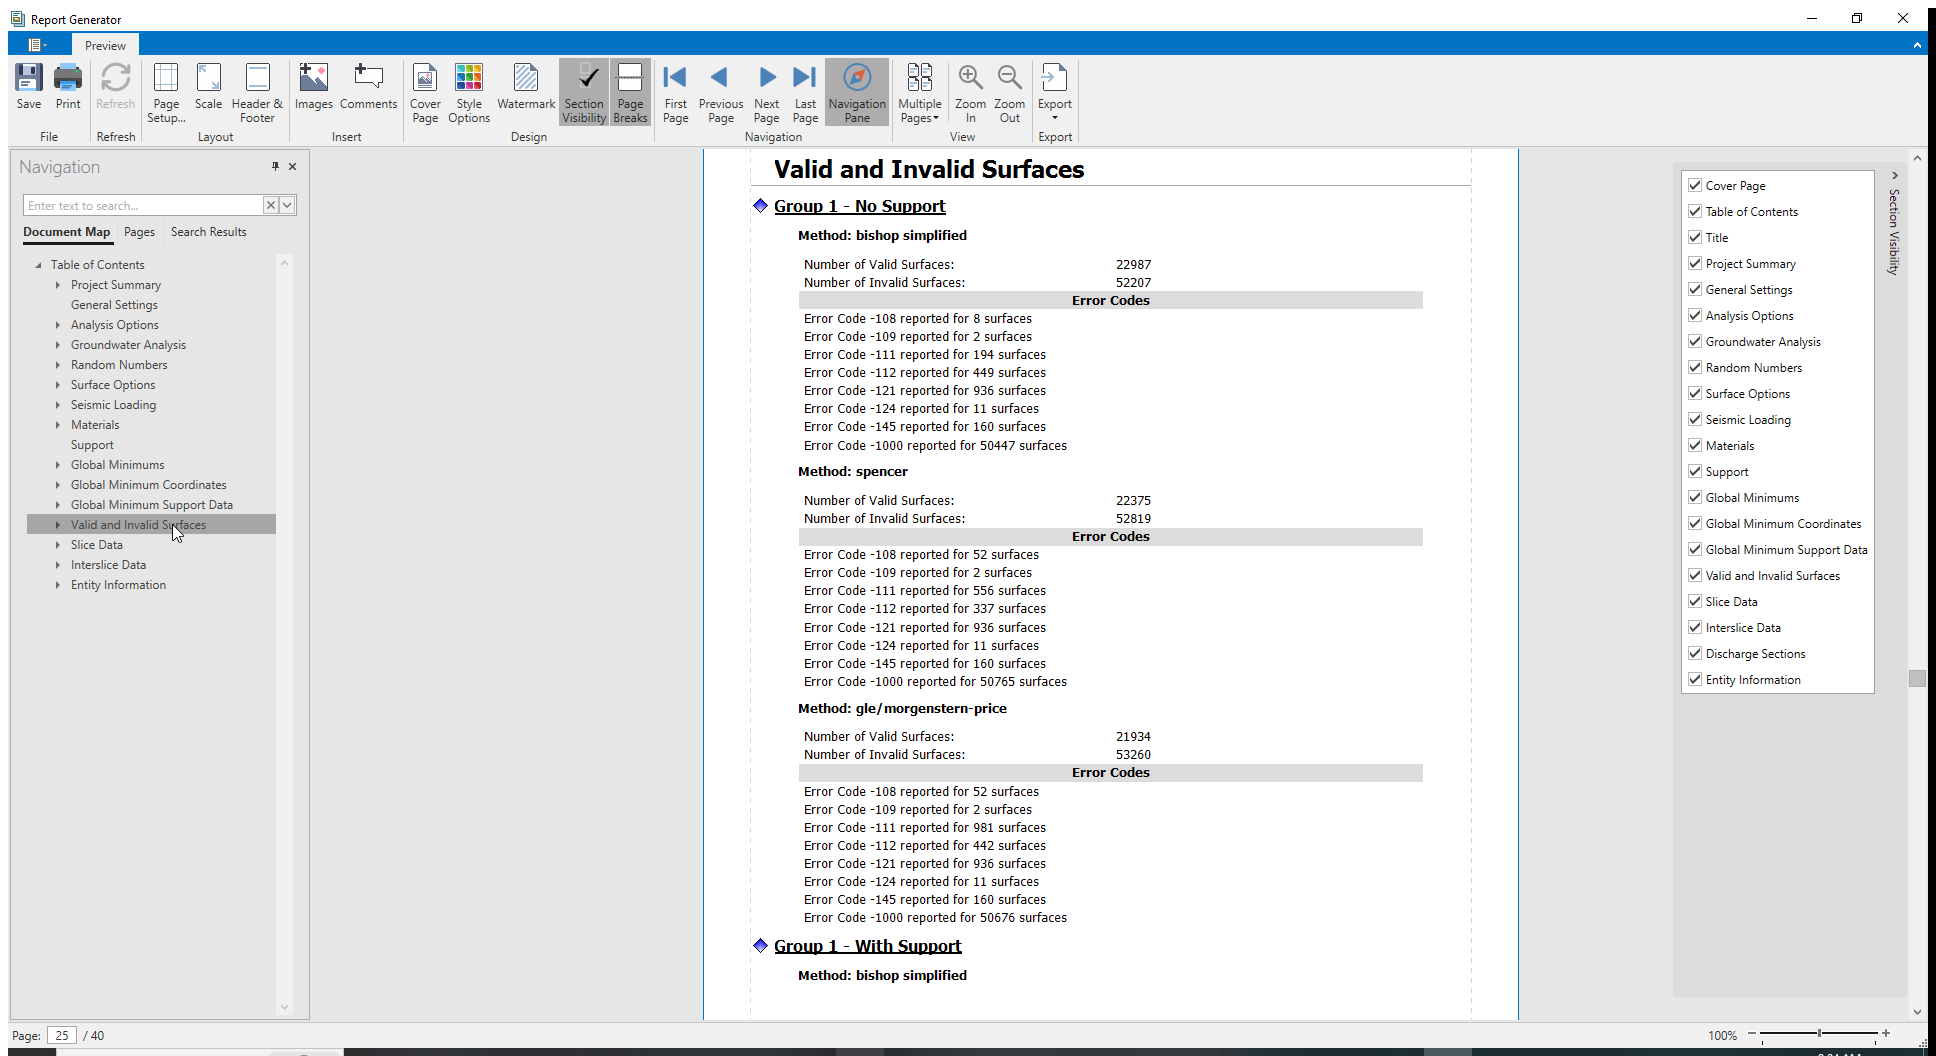
From the report, we can easily see that the total number of Invalid surfaces decreased with the addition of support.
For more information on Invalid Surfaces, refer to the Summary of Error Codes help page. - Close the Report Generator view.
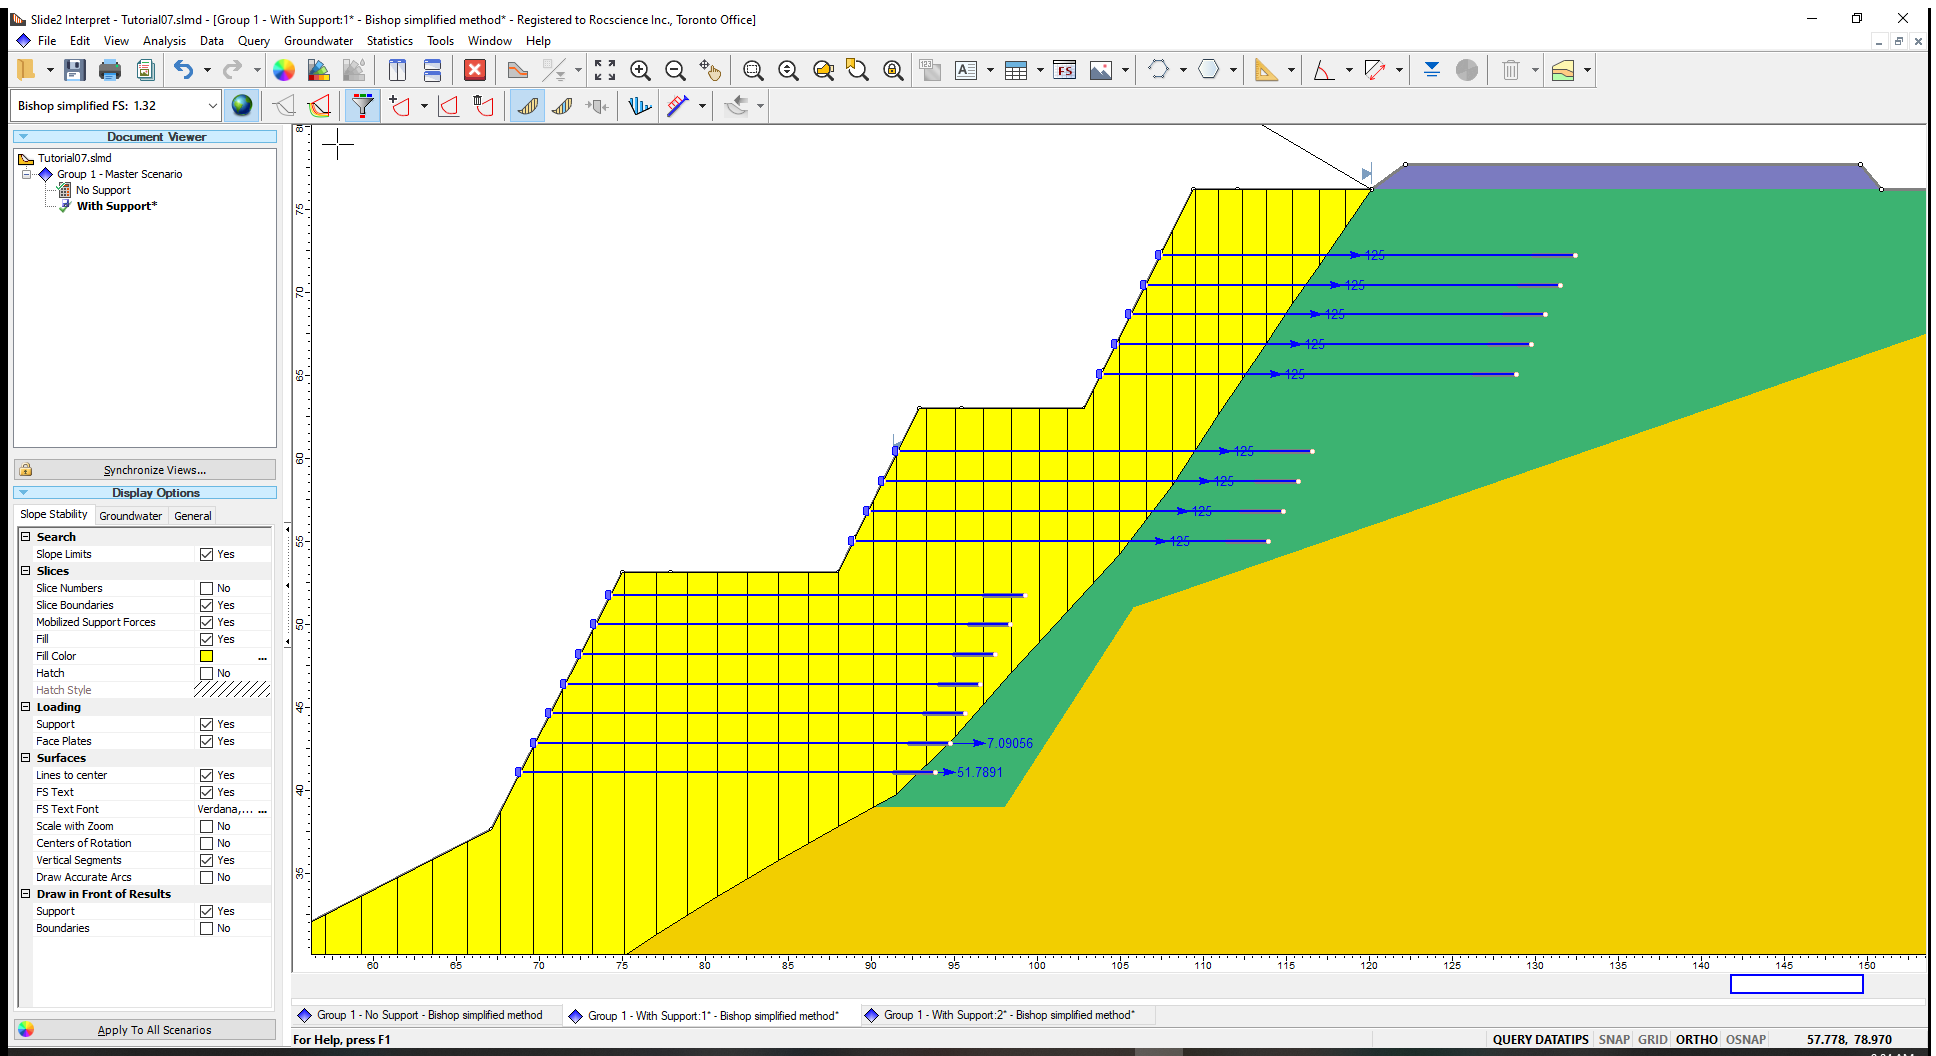
5.2 Support Forces
The Show Support Forces option can display force diagrams for support elements. A support force diagram describes the available force that a given support element mobilizes along its length.
- Click on the ‘With Support’ scenario in the Slide Interpret window.
- Select Data > Show Support Force Diagram
 The support forces are displayed on the model as shown below.
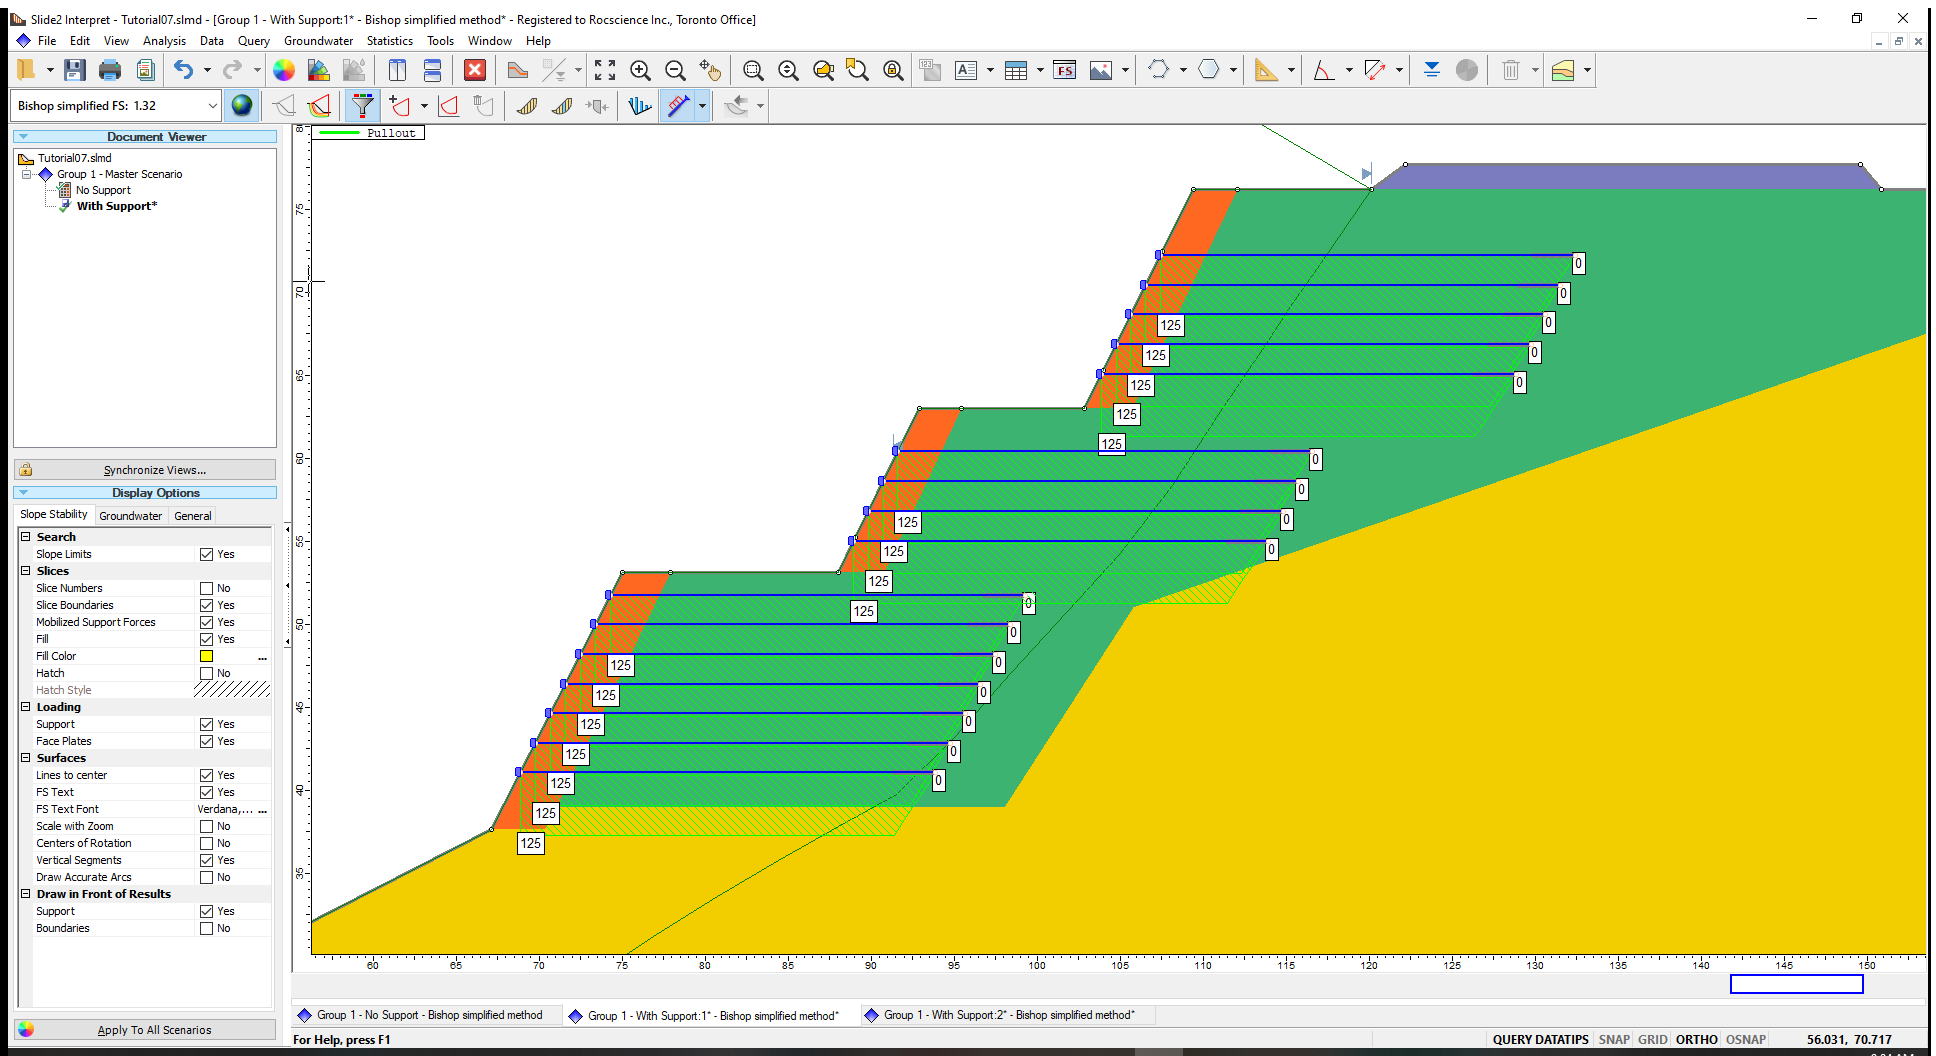
- Zoom in to view the forces acting on the Grouted Tiebacks.
When support forces are displayed, a legend appears at the top left corner of the viewing window.
The legend also indicates the failure mode(s) along the support length.
The default legend failure settings are shown in the top left of the model view.You can modify these settings by selecting Data > Support Force Diagram Options or by simply clicking on the drop-down arrow beside the icon on the toolbar.The Force Diagram and the point of intersection of a slip surface with a support element determines the force magnitude applied to the slip surface.
- Select Query > Show Slices
 to see the exact force applied to the slip surface.
You can apply other types of support as an additional exercise.
6.0 Back Analysis of Support Force
In Slide2, you can use the Back Analysis of the support force option at the preliminary stages of support design. This option allows the user to determine the MAXIMUM (total) support force required to achieve a specified safety factor.
The support force magnitude determined can then be used to estimate the necessary capacity and spacing of individual support elements. The slip surface determined from the back analysis can be used to estimate the required length of support.