19 - Back Analysis of Material Properties
1.0 Introduction
This tutorial will demonstrate how to perform back analysis of material properties using Sensitivity Analysis or Probabilistic Analysis features in Slide2. Back Analysis can be used to determine material strength at slope failure, or the required material strength to achieve a given safety factor.
In this tutorial, we will review a back analysis performed (with Slide2) for the material properties of a failed slope.
At the end of the tutorial, we will know how to use:
- Sensitivity analysis for back analysis of individual variables.
- Probabilistic analysis can be used for back analysis of multiple variables.
Finished Product
The finished product of this tutorial can be found in Tutorial 19 Back Analysis of Material Properties.slmd data file. All tutorial files installed with Slide2 can be accessed by selecting File > Recent Folders > Tutorials Folder from the Slide2 main menu.
2.0 Model Geometry
- Go to File > Recent Folders > Tutorials Folder in the Slide2 main menu and open Tutorial 19 Back Analysis of Material Properties – starting file.slmd file.
You should see the following model:
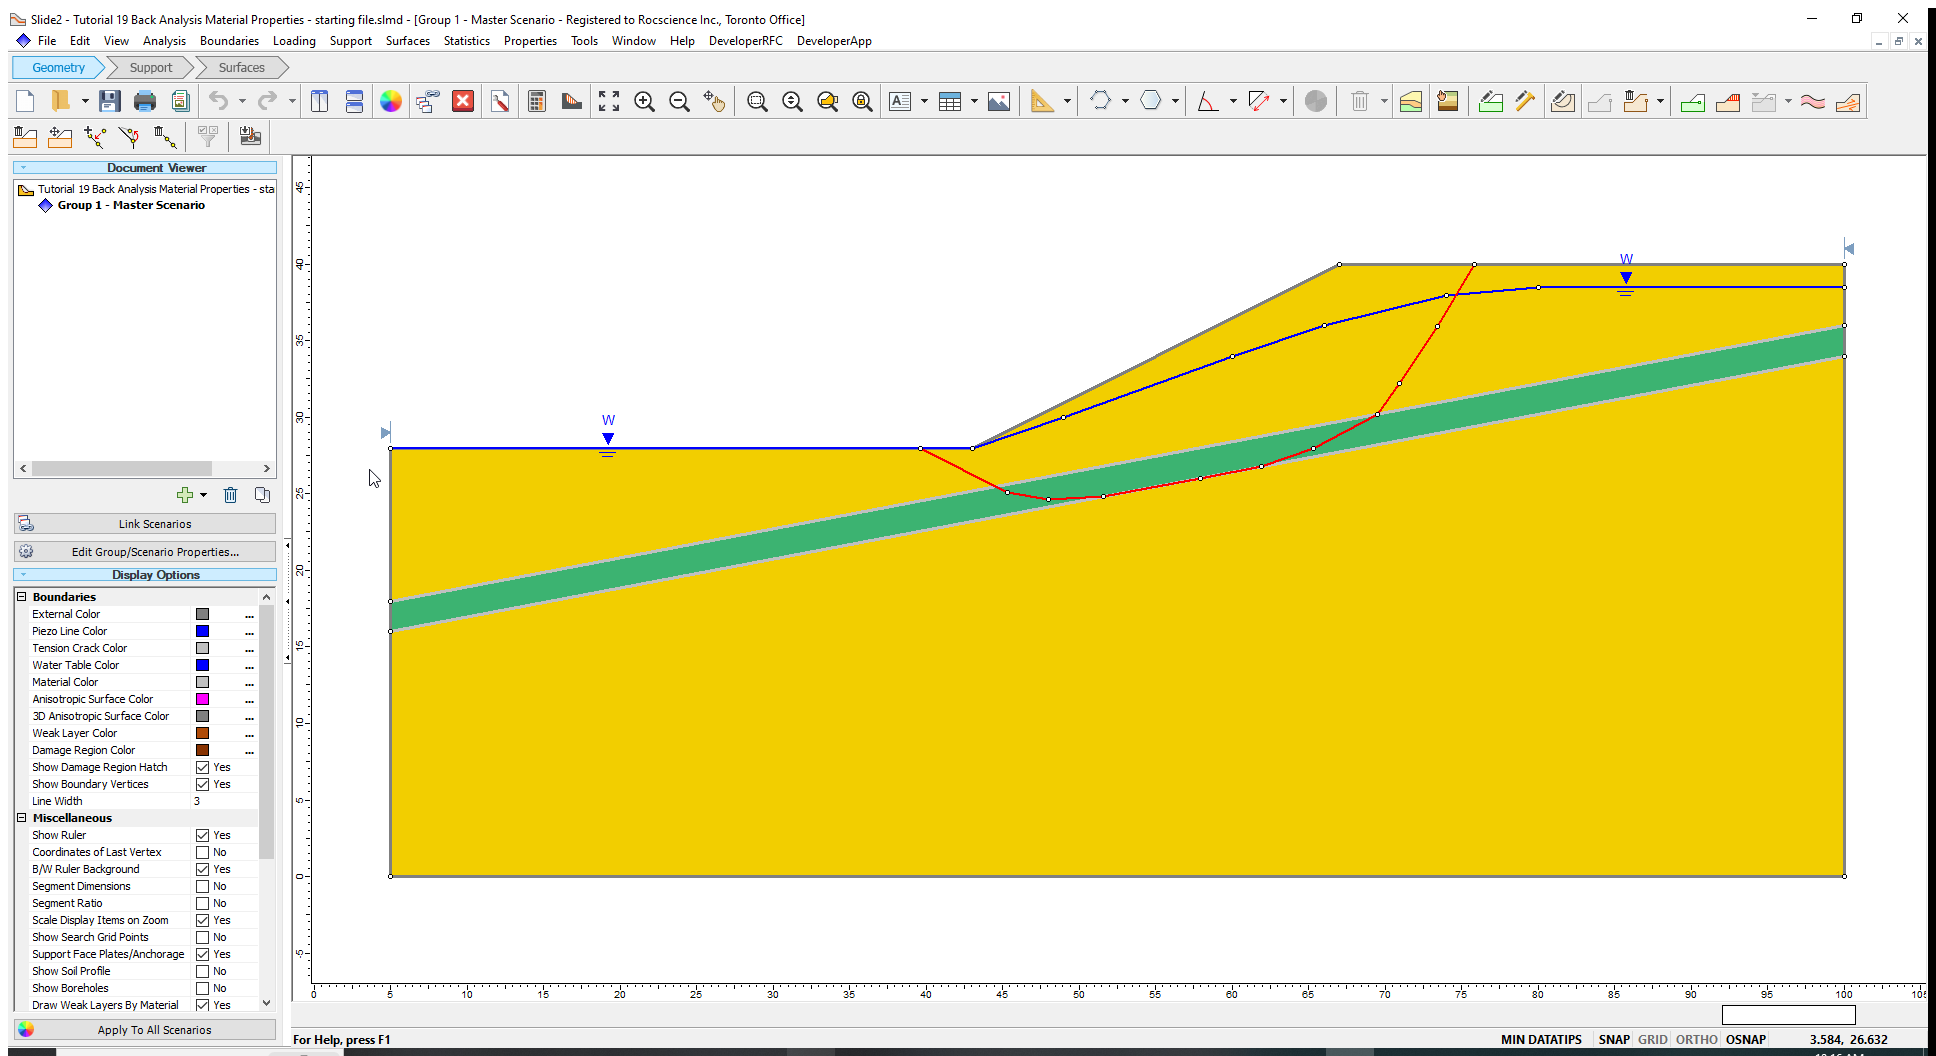
For this model, a slope failure is assumed to have occurred. The actual failure surface is given by the red line shown in the above figure. The failure surface is non-circular and passes through a weak material layer (green material).
The slope comprises two materials (see Properties > Define Materials) – a strong soil and a weak layer. Since a significant portion of the slip surface passes through the weak layer, the back analysis focuses only on the material properties of this layer.
We will carry out sensitivity and probabilistic analysis for the model, to determine the cohesion and friction angle of the weak layer values that would have led to the failure shown.
3.0 Sensitivity Analysis
Sensitivity analysis can be used to back analyze individual variables. The method works by varying a single strength parameter while holding all other parameters constant (i.e., keeping all other parameters at values equal to their means).
- Select Statistics > Materials
 to open the Material Statistics dialog as shown below. Statistical parameters are defined for the cohesion and friction angle of the weak layer only.
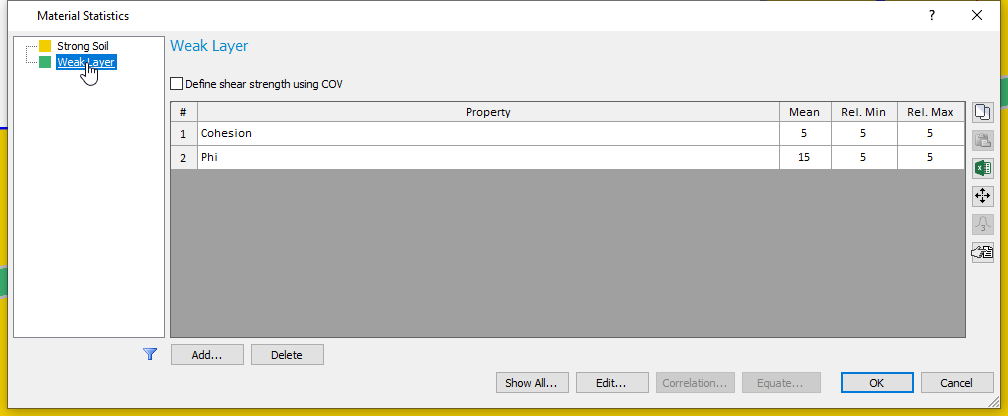
From the Material Statistics table, the cohesion varies between 0 and 10 kPa, while the friction angle changes between 10 and 20 degrees.
- Click Cancel.
3.1 Computation and Interpretation of Sensitivity Analysis.
- Go to Analysis > Compute
 to run the analysis.
 - Select Analysis > Interpret
 to view results when computations are done.
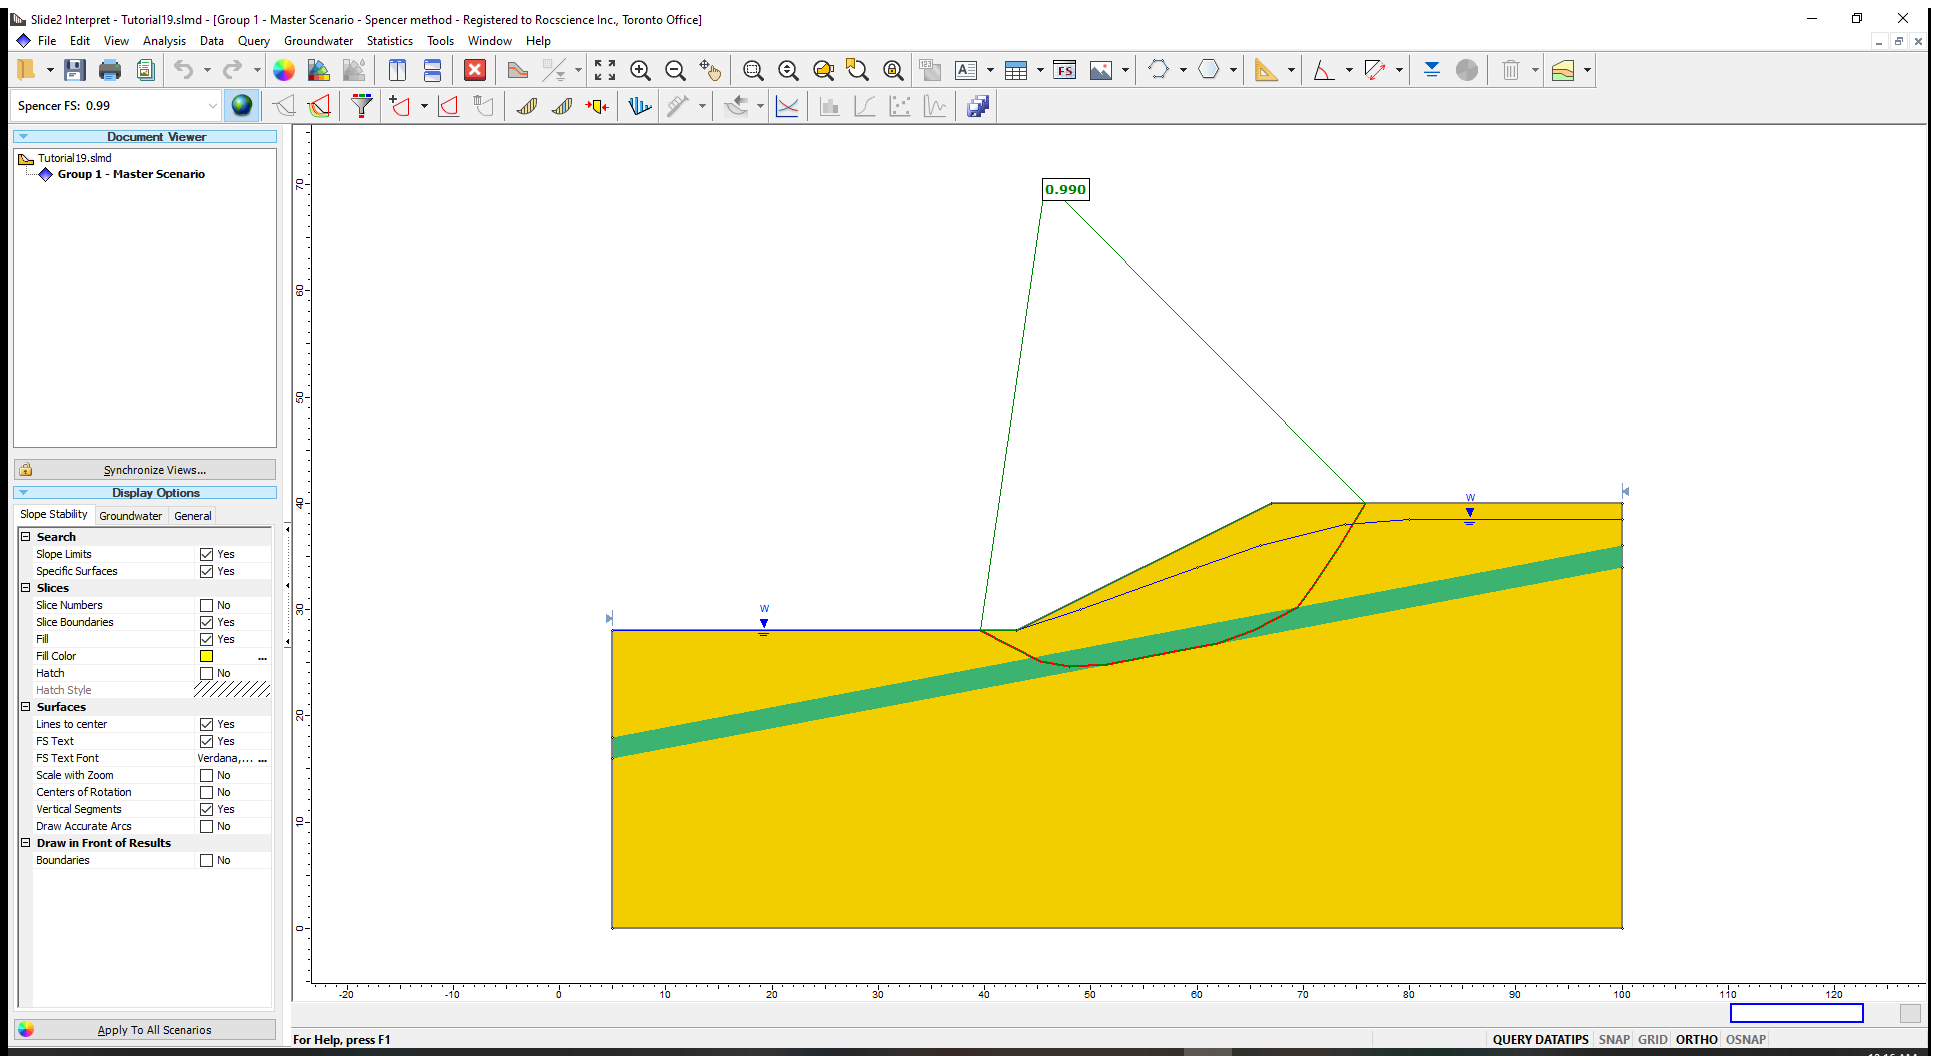
The Spencer analysis method gives a factor of safety close to 1 for the critical slip surface, consistent with an actual failure.
Now let us plot a sensitivity analysis results for the cohesion parameter of the weak layer and determine the value of the cohesion that produces a factor of safety of 1.
- Go to Statistics > Sensitivity Plot

- Select the checkbox for Sensitivity – weak layer: Cohesion (kN/m2)
- Click on the Plot button to generate the plot.
To determine the value of cohesion which corresponds to safety factor = 1, do the following:
- Right-click on the plot and select Sampler > Edit Sampler.
- Move the two dotted crossing lines (Sampler) along the plot line until you obtain a factor of safety close to 1.0 and click on the point
The cohesion that corresponds to the safety factor of is 1 is about 5.5kPa assuming that all other slope parameters are fixed at their mean values.
To determine the friction angle value that corresponds to a safety factor, simply
- Right-click on the Sensitivity Plot and select Change Plot Data

- Select the checkbox for Phi (deg) and uncheck the checkbox for Cohesion (kN/m2).
- Click Done.
The friction angle that corresponds to a safety factor of 1 is approximately 15.3 degrees (using the sampler). Again, this assumes that all other parameters have values equal to their means.
In general, back analysis procedures require some trial and error. For example, if the desired safety factor is not within the output range of the sensitivity plot, you will have to adjust the allowable range of values of the variable and re-run the analysis.
Now, we will look at back analysis that allows two or more variables to simultaneously change, using probabilistic analysis.
- Return to the Slide2 modeller.
4.0 Probabilistic Analysis
We will use probabilistic analysis to determine all possible values of cohesion and friction angle of the weak layer that can produce factors of safety that are approximately 1. To turn on probabilistic analysis:
- Select Analysis > Project Settings

- Click on the Statistics tab.
- Check on Probabilistic Analysis.
- Set the Sampling Method to Latin-Hypercube
- Set the Number of Samples to 1000.
- Set the Analysis Type to Global Minimum.
This means that only the failure surface which we have already defined will be considered.
- Click OK.
Now let’s look at the Material Statistics dialog.
- Select Statistics > Materials
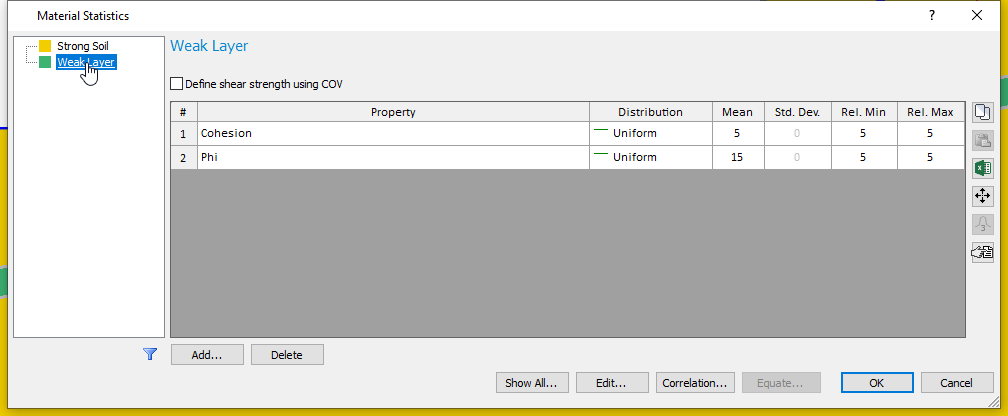
- Click on Weak Layer tab.
- Click Cancel.
4.1 Computation and Interpretation of Probabilistic Analysis
- Click Compute to run the analysis and view the results in Interpret when computations are done.
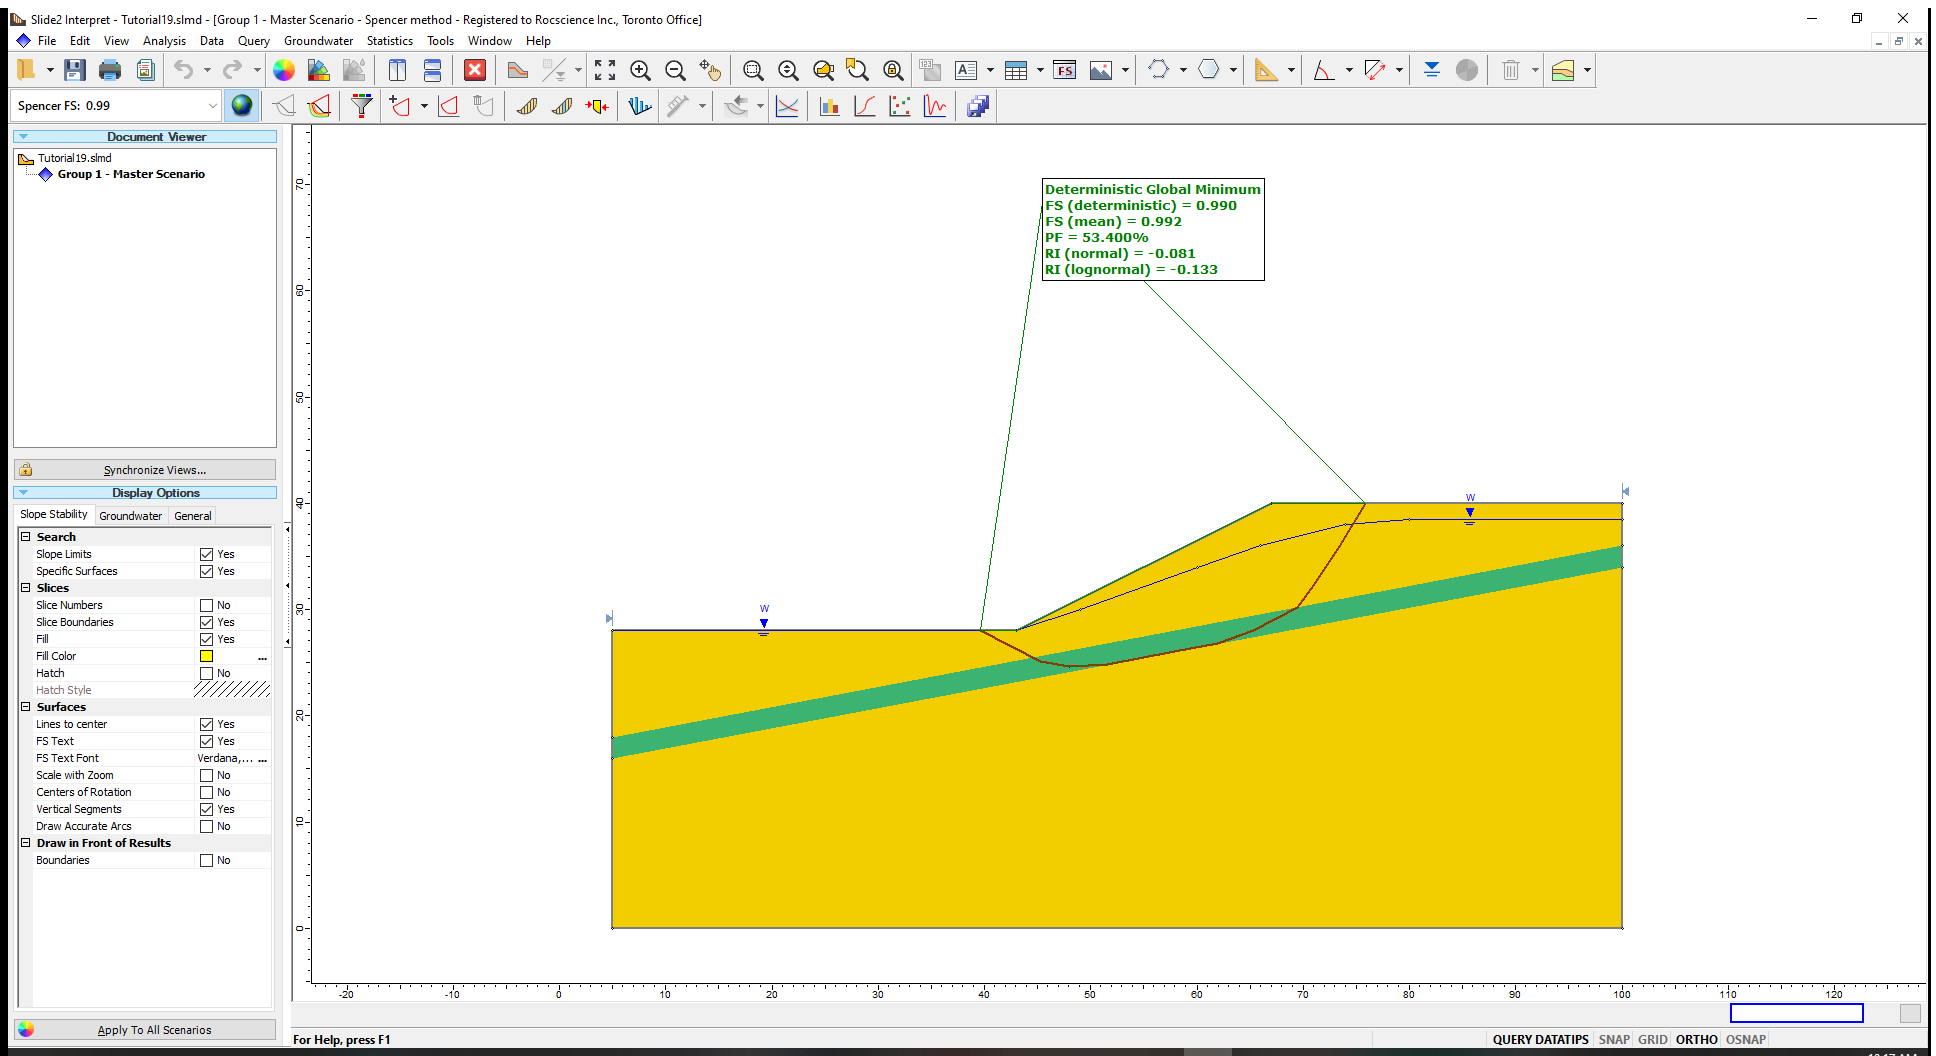
The Probability of Failure (PF) result being greater than 50% indicates that more than half of all factors of safety outcomes are less than 1 (i.e. result in slope failure). The distribution of safety factors is approximately centered about the mean value of 1.
Now let us generate a scatter plot for the weak layer’s two material properties and determine the parameter combinations that produced the factors of safety approximately equal to 1.
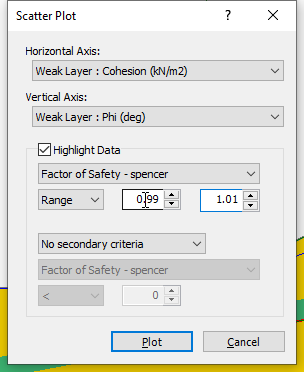
- Go to Statistics > Scatter Plot
 to open the Scatter plot dialog.
 - Select the following parameters in the respective fields:
- Horizontal Axis: Weak Layer: Cohesion(kN/m2)
- Vertical Axis: Weak Layer: Phi (deg)
You should see the image shown below.
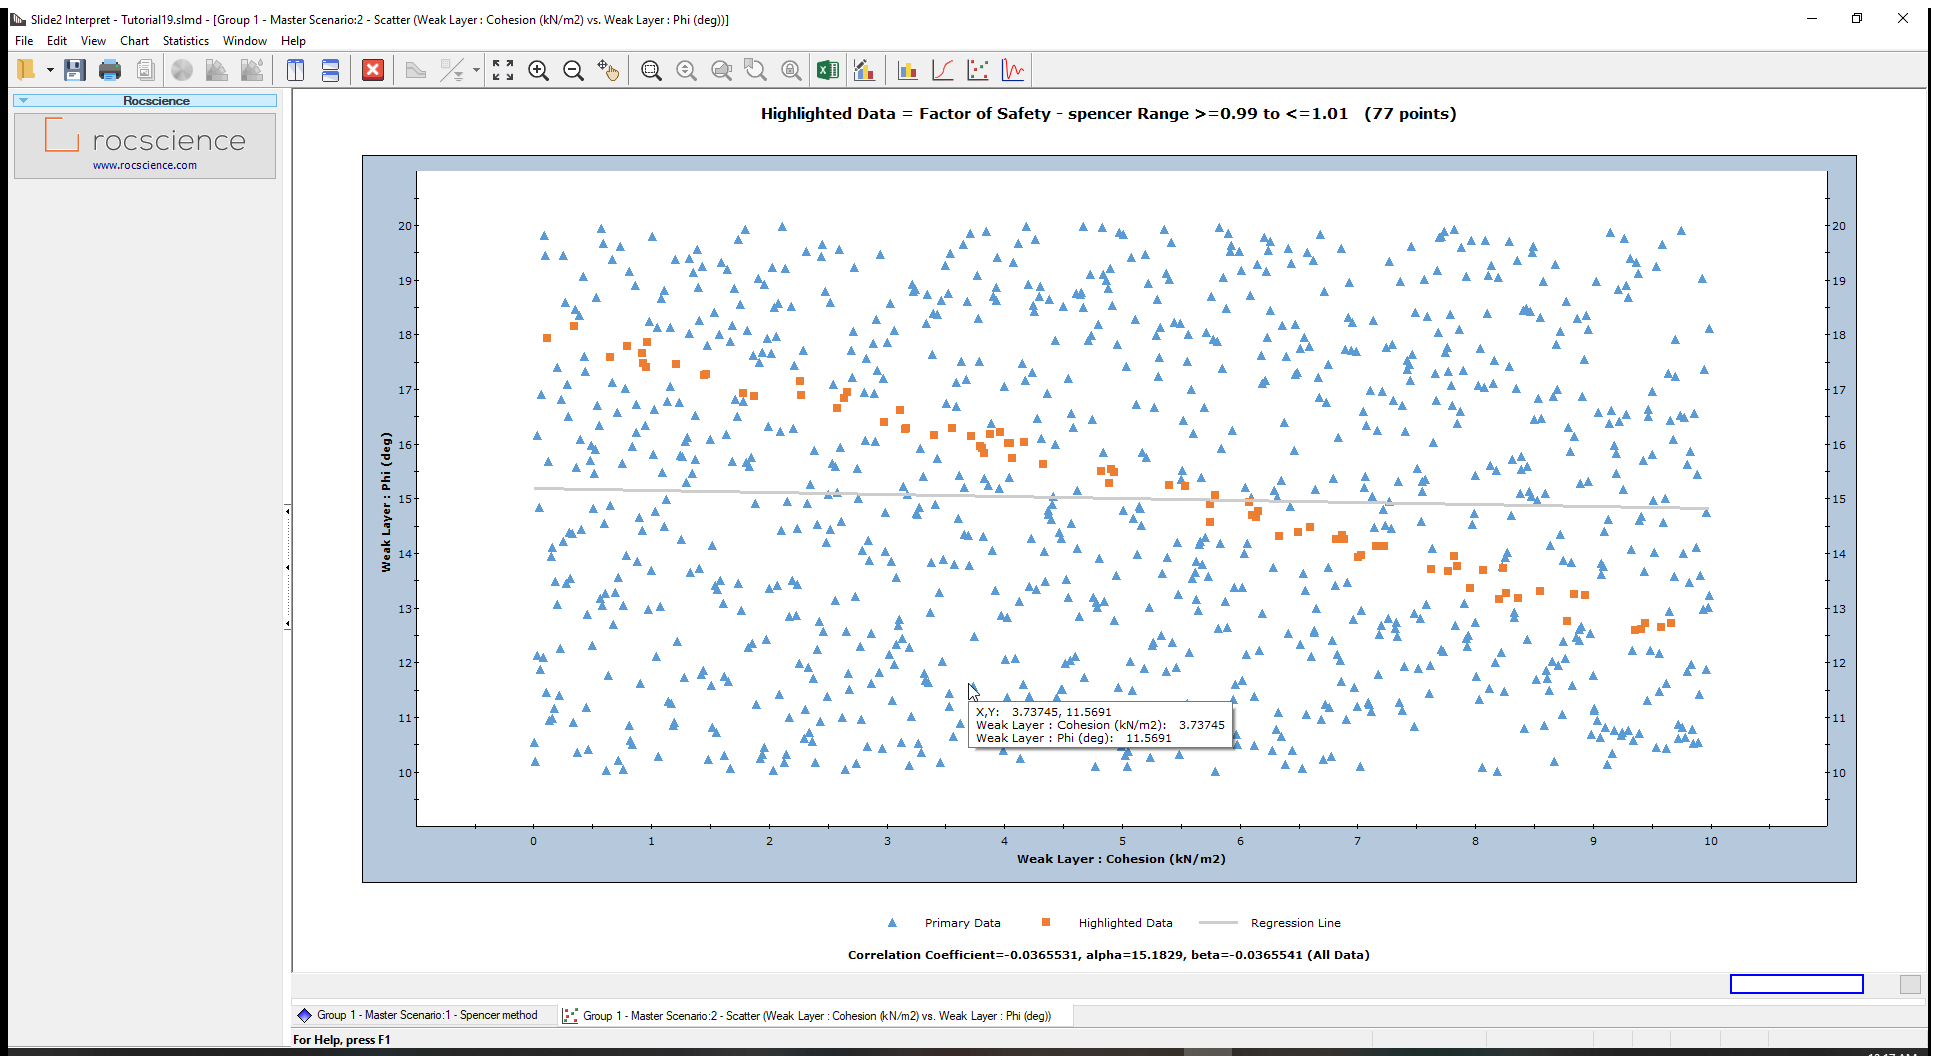
The samples were uniformly generated over the specified ranges for the weak layer variables (i.e., cohesion varying from 0 to 10 and friction angle from 10 to 20).
The Highlighted data (safety factors between 0.99 and 1.01) are shown in orange on the plot.
To view the highlighted data only:
- Right-click on the plot and select Highlighted Data Only from the popup menu. The plot should look as follows:
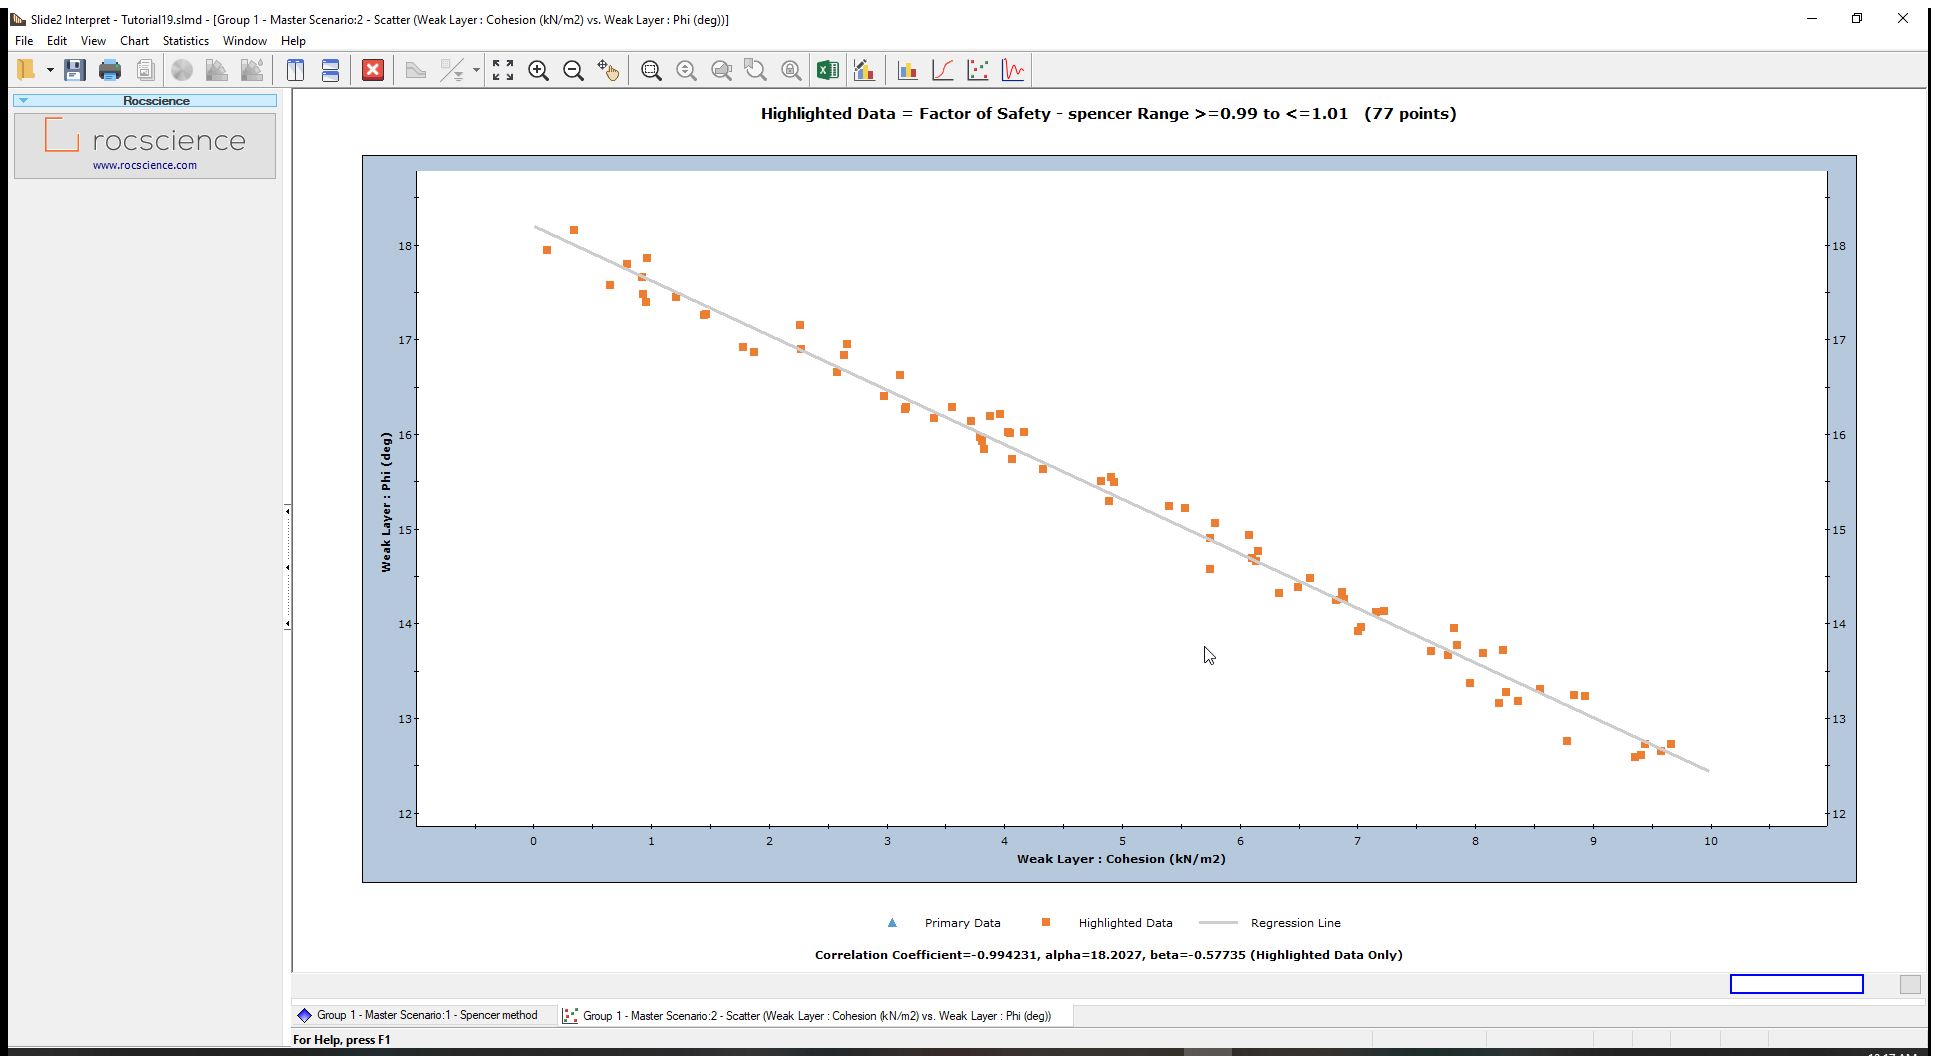
The plot shows a linear relationship between cohesion and friction angle for a safety factor of approximately 1 over the range of values plotted for this model.
Use the Sampler and move it over this line to view (cohesion, phi) coordinates at every point. Any pair of cohesion and friction angle values that falls on this line, will give a factor of safety of about 1.
If you input one of these data pairs as the strength of the weak layer and re-run the analysis, you will see that the safety factor does indeed equal 1.
Although the relationship is linear in this example, this will not always be the case. Depending on the range of values, variables plotted and other characteristics of your model, the scatter plot might indicate a non-linear relationship between variables.
You can further process the data used from Slide2 scatter plots and any other graphs by exporting them to Excel.
5.0 Back Analysis of Other Variables
In this tutorial, we only looked at the back analysis of the strength parameters, cohesion, and friction angle, of a Mohr-Coulomb material. However, almost all input parameters in Slide2 can be included in sensitivity or probabilistic analysis.
The procedures described in this tutorial could be applied to other strength parameters and strength models (e.g., Hoek-Brown, or anisotropic materials) or to any other random input parameter in Slide2 (e.g., support properties). We encourage you to experiment with the options available.
This concludes the tutorial on Back Analysis of Material Properties.