13 - Rapid Drawdown Tutorial
1.0 Introduction
When the water level at a dam drops, the stabilizing force due to the weight of the water is removed. If the dam material has low permeability and the water level drops quickly, then excess pore pressures will be slow to dissipate. This causes reduced stability in the slope. This situation is termed rapid drawdown.
In Slide2, there are different methods that can be used to evaluate rapid drawdown. These methods are available under the advanced groundwater options in Project Settings.
This tutorial will demonstrate rapid drawdown analysis using all the methods applicable to rapid drawdown available in Slide2:
- Effective Stress using B-bar
- Duncan, Wright, Wong 3 Stage (1990)
- Army Corp. Eng. 2 Stage (1970), and
- Lowe and Karafiath (1960)
Finished File:
The finished file, Tutorial 13 Rapid Drawdown.slmd, can be found in File > Recent Folders > Tutorials Folder. (All tutorial files installed with Slide2 can be accessed in the same folder.)
2.0 Model Geometry
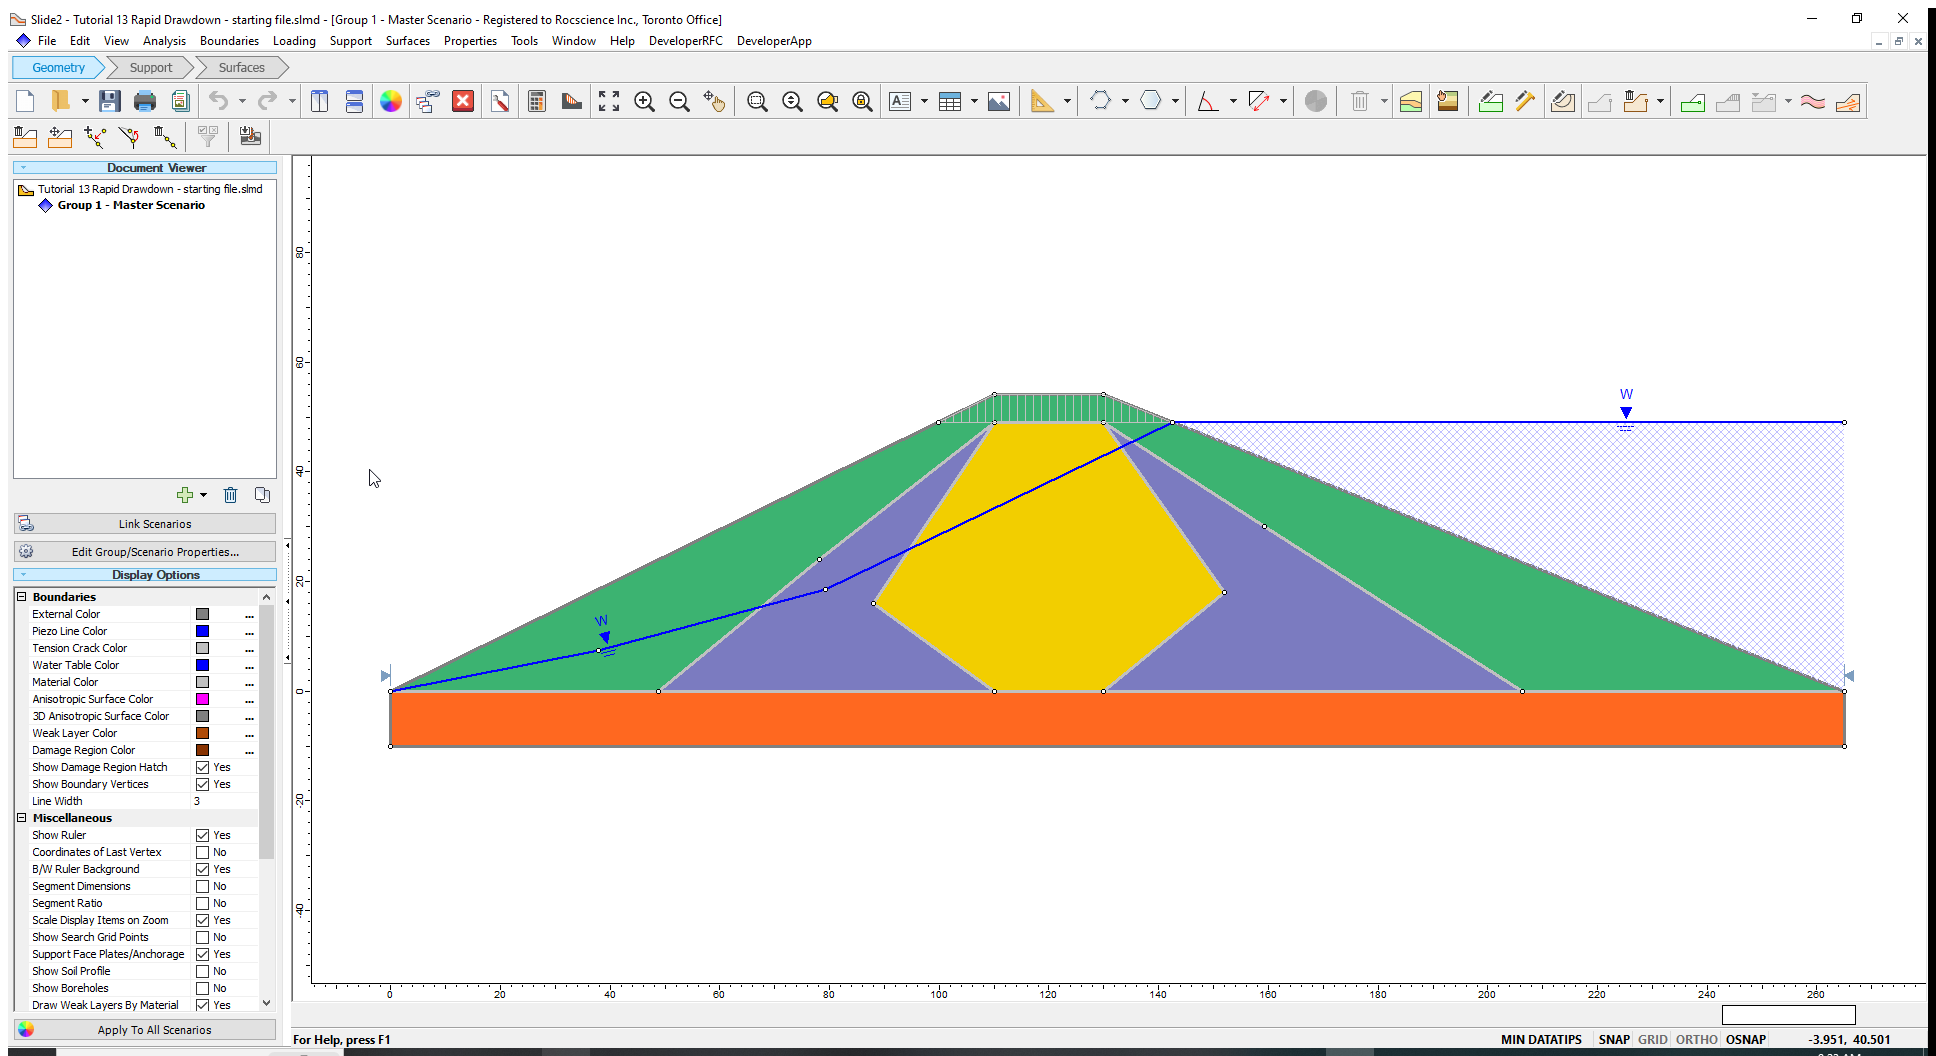
- Select File > Recent Folders > Tutorials Folder from the menu and open Tutorial 13 Rapid Drawdown – starting file.slmd file.
The model is shown below. It consists of a dam with a clay core, transition zone, and granular fill outer layer. It is retaining ponded water at an elevation of 49m.
First, we will compute the factor of safety of the dam at steady state (i.e., the dam under long-term full reservoir conditions). Then we will entirely empty/remove the reservoir and determine the safety factor using the four rapid drawdown methods mentioned above. The rapid drawdown conditions will be defined using parameters specific to the methods.
3.0 Steady State
The material properties (Properties > Define Materials) and failure surface (Surfaces > Surface Options) have already been set.
3.1 Computation and Interpretation
- Select Analysis > Compute
 to run a non-circular Cuckoo search analysis.
 - When computations are done, select Analysis > Interpret
 to view the results shown below.
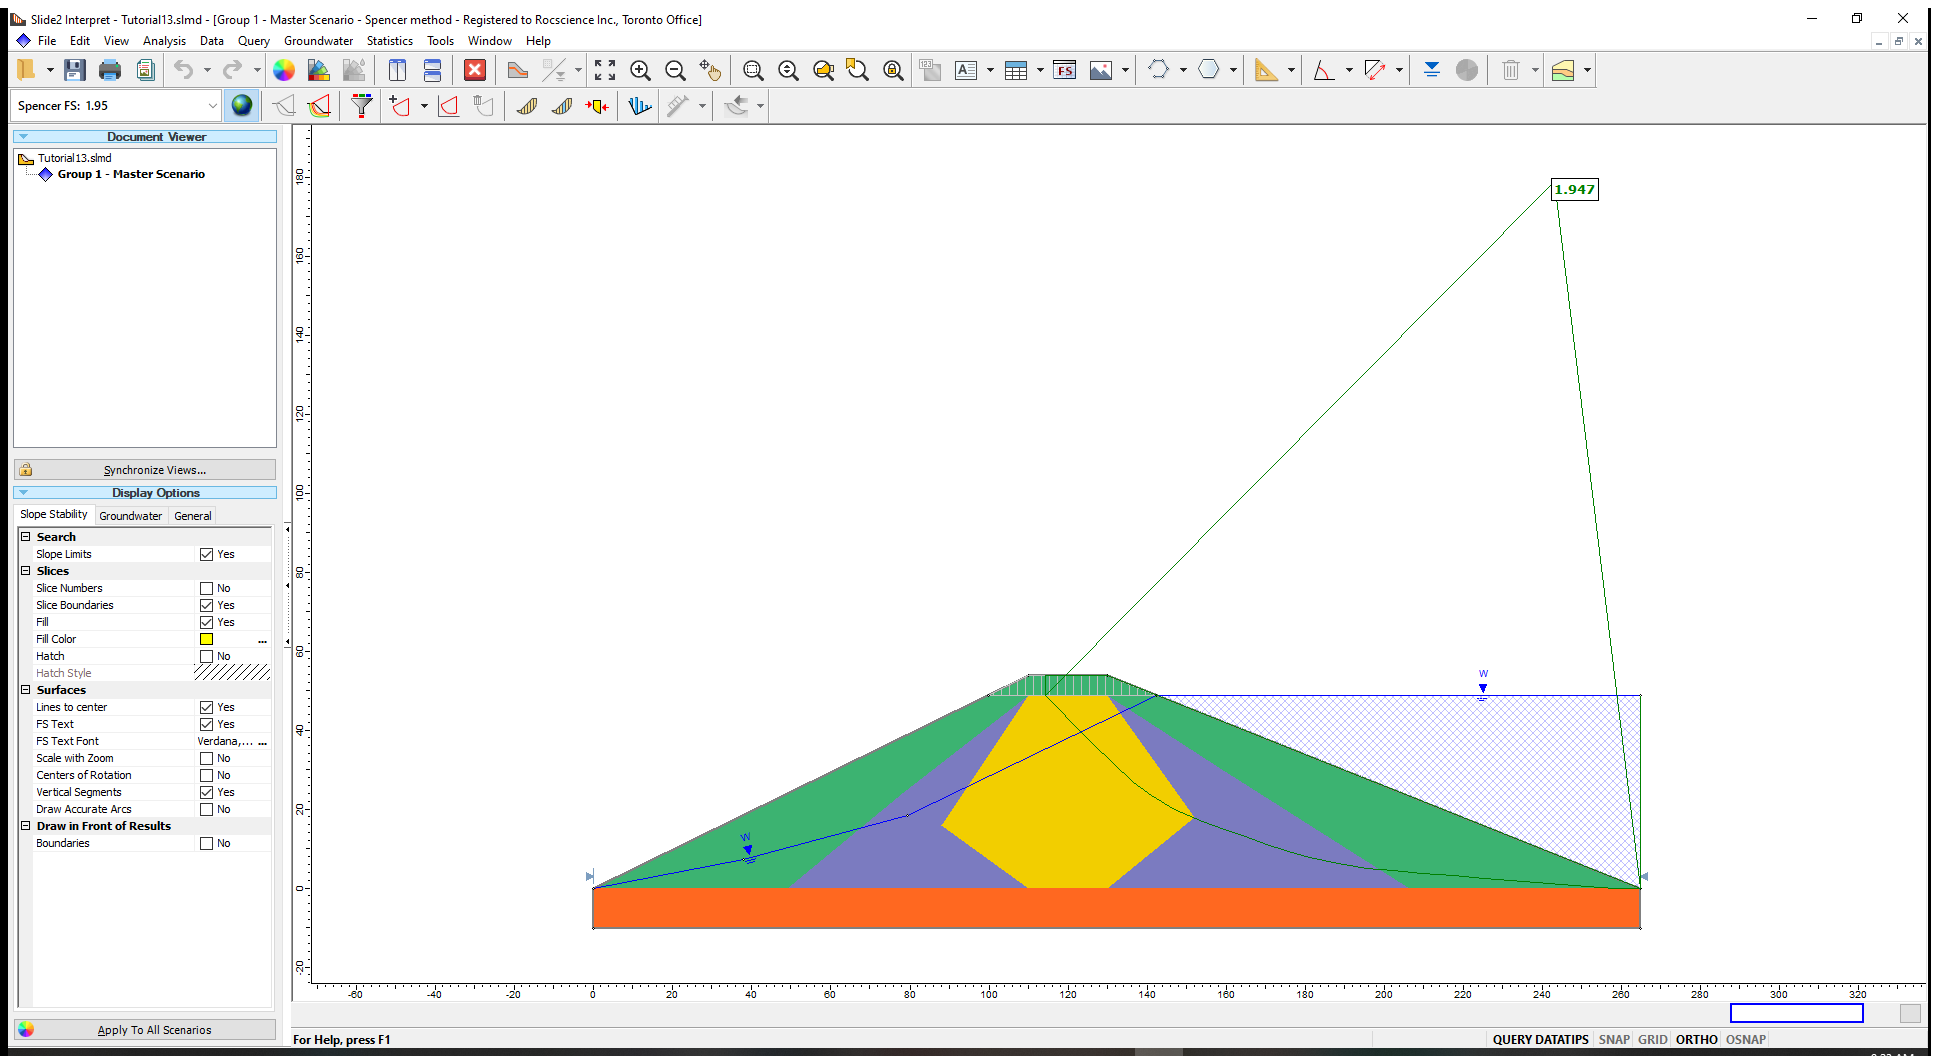
The Spencer safety factor of the critical slip surface is about 1.9 at steady state reservoir conditions.
- Click on the Modeller
 icon in the toolbar to go back to the Modeller.
Now, we will simulate rapid drawdown of the reservoir to zero level and compute the resulting factor of safety of the upstream dam face using the above-listed methods implemented in Slide2. We will create Scenarios for each of the analysis methods.
4.0 Effective Stress (B-bar Method)
The B-bar method assumes that changes in pore pressure in a material are directly proportional to changes in vertical stress, per Equation 1 below:

Materials (typically of low permeability) within which excess pore pressures are expected to be generated are assigned a B-bar material coefficient (B). (See Excess Pore Pressure for more information about the B-bar method.)
- In the Document Viewer, right-click on the Master Scenario and select Add Scenario

- Right-click the new scenario to rename Scenario 2 to ‘Rapid Drawdown (B-bar Method)’.
We will now set the rapid drawdown method under the Groundwater tab of Project Settings.
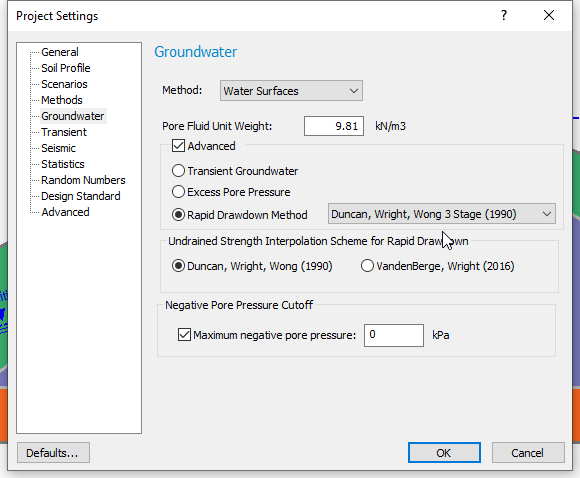
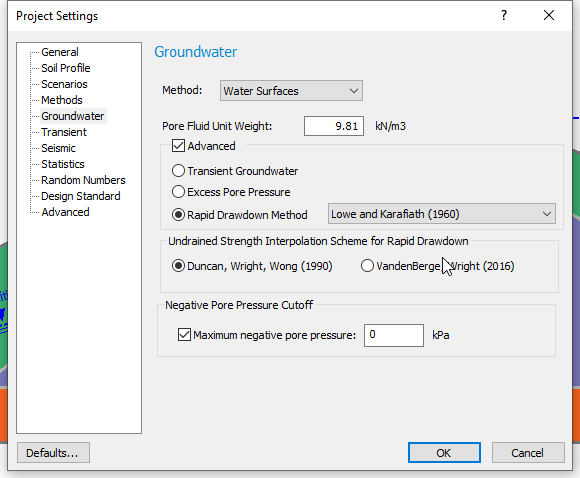
- Select Analysis > Project Settings

- Select the Groundwater tab, tick the checkbox beside Advanced and select the Rapid Drawdown Method radio button.
- Click on the drop-down arrow beside Rapid Drawdown Method and select Effective Stress using B-bar from the list as shown below.
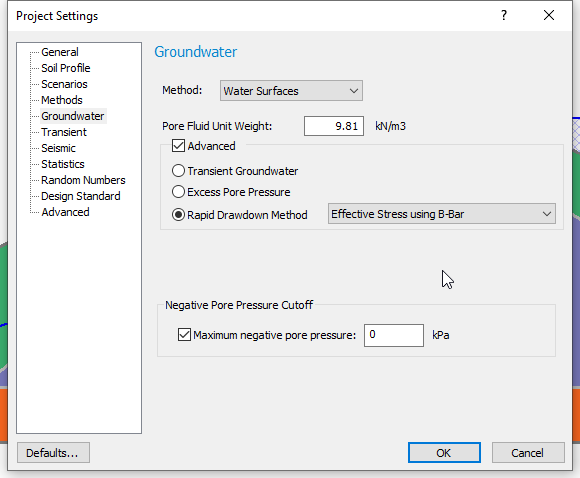
This selection will ensure that changes in pore pressure due to removal of the ponded water (emptying of the reservoir) will be calculated using the B-bar method
- Click OK to save the settings and close the dialog.
The next step is to define the B-bar coefficient of the materials in the Material Properties dialog.
4.1 Material Properties
- Select Properties > Define Materials
 to open the Material Properties dialog.
A B-bar coefficient of 1 will be entered for the clay core, the transition material, and the hard bottom. This will result in a negative pore pressure change for any of these materials located beneath the ponded water, calculated according to Equation 1.
In the dialog:
- Select the clay core material and, under the Rapid Drawdown Parameter, tick the Undrained Behaviour checkbox.
- Enter a B-bar value of 1 as shown below.
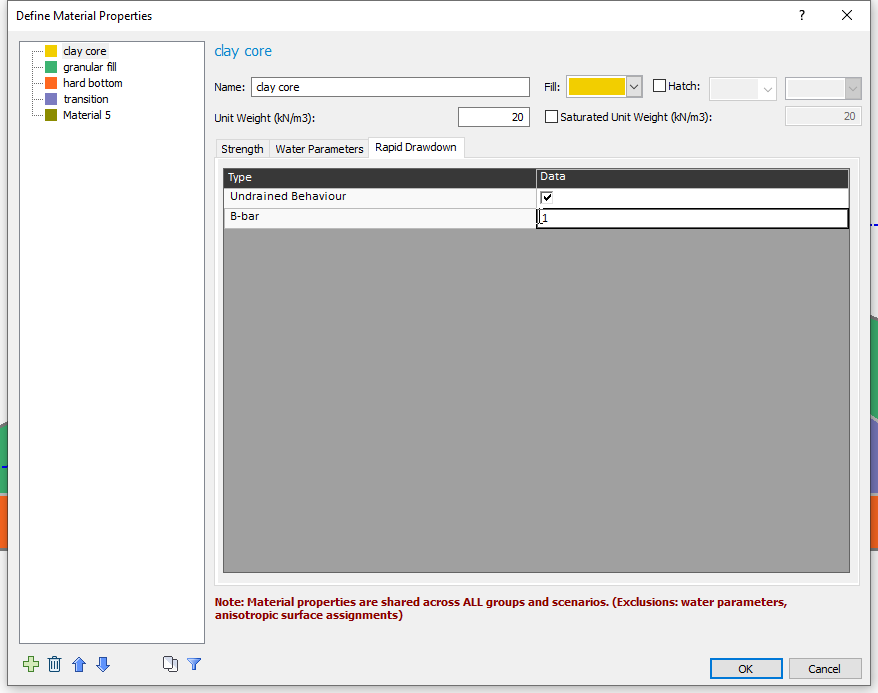
- Repeat Steps (2) and (3) for the transition material and the hard bottom material.
The “granular fill” material is assumed to be free draining, so the “undrained” checkbox is NOT activated. The final pore pressures for this material should be zero due to complete drainage. - Click OK to close the dialog and save the settings.
Now let us run the analysis.
4.2 Computation and Interpretation
- Select Analysis > Compute
and run the Rapid drawdown (B-bar method) scenario.
- Select Analysis > Interpret to view results when computations are done.
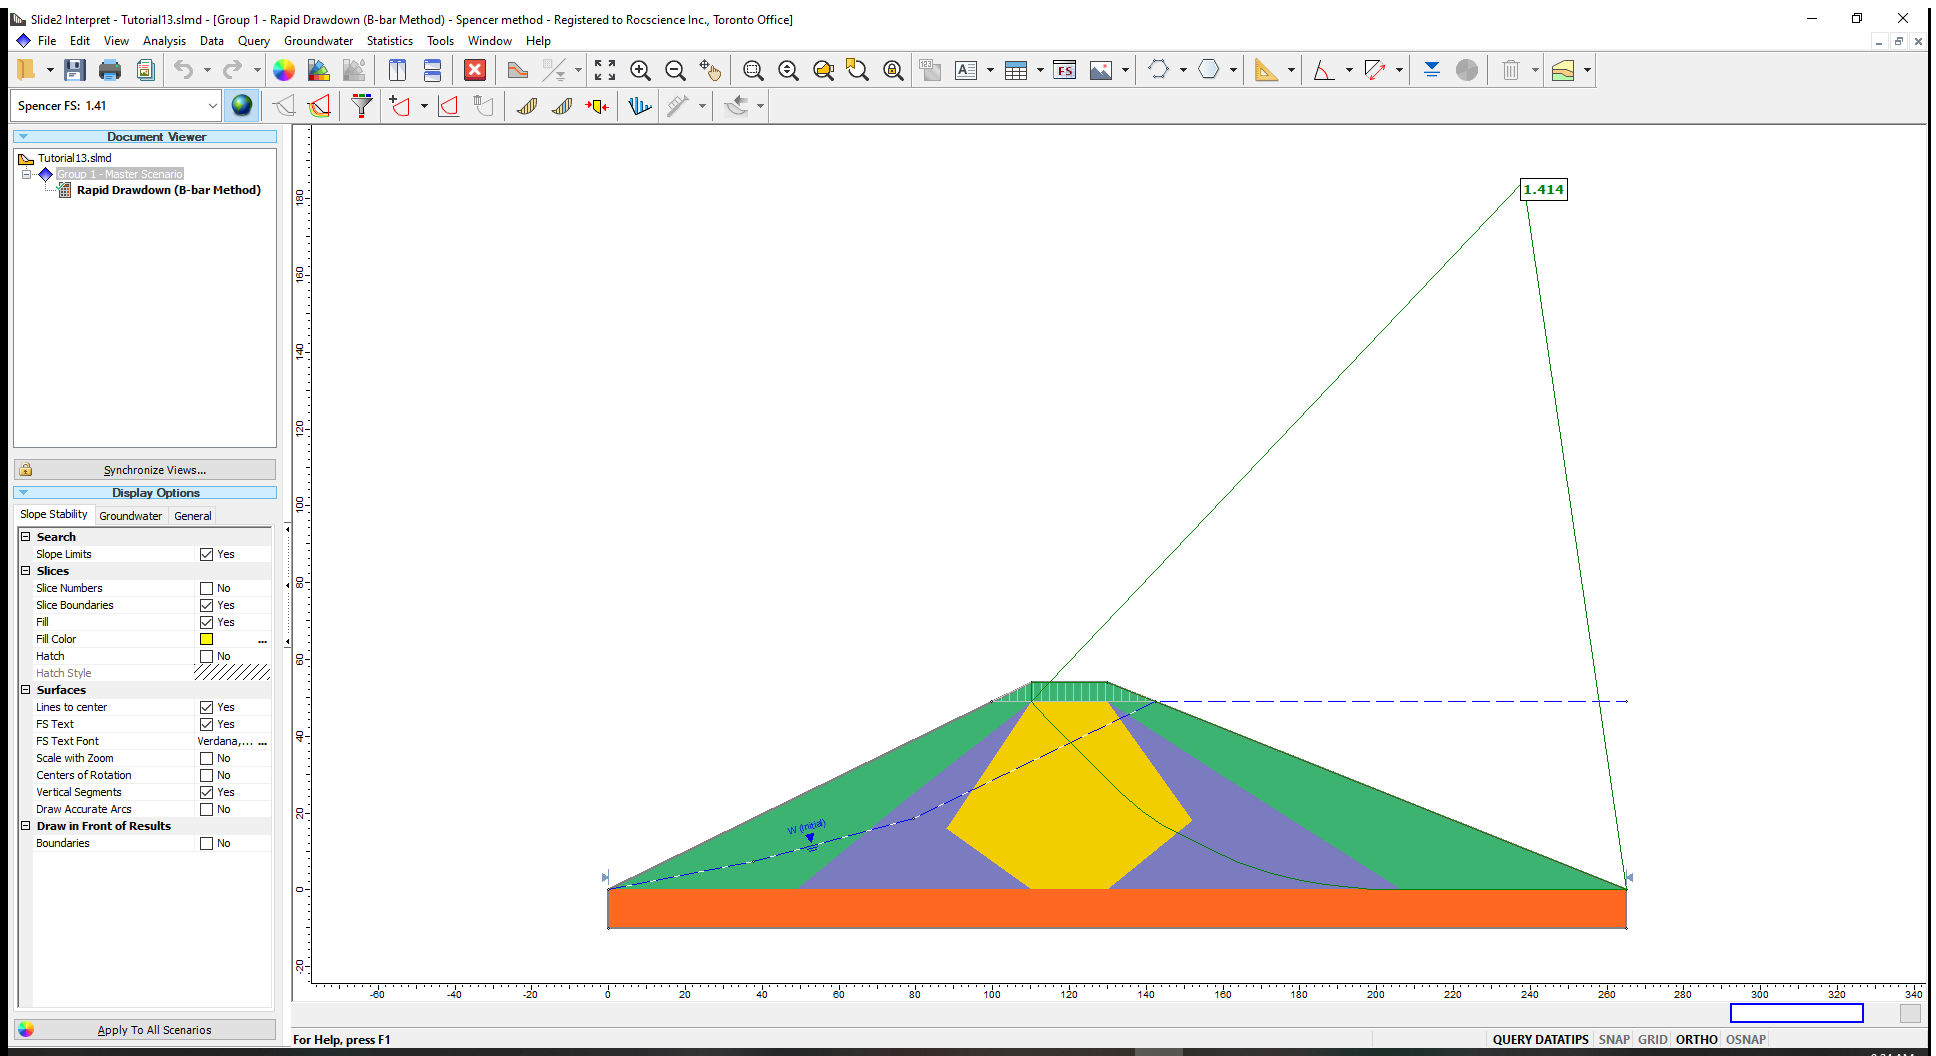
From the results (as shown above), the Spencer Factor of safety for the critical slip surface after rapid drawdown is 1.4. This is significantly lower than the safety factor of under the full reservoir loading calculated in the Master Scenario. The drop in factor of safety resulted from the removal of the support against the upstream slope face provided by the ponded water.
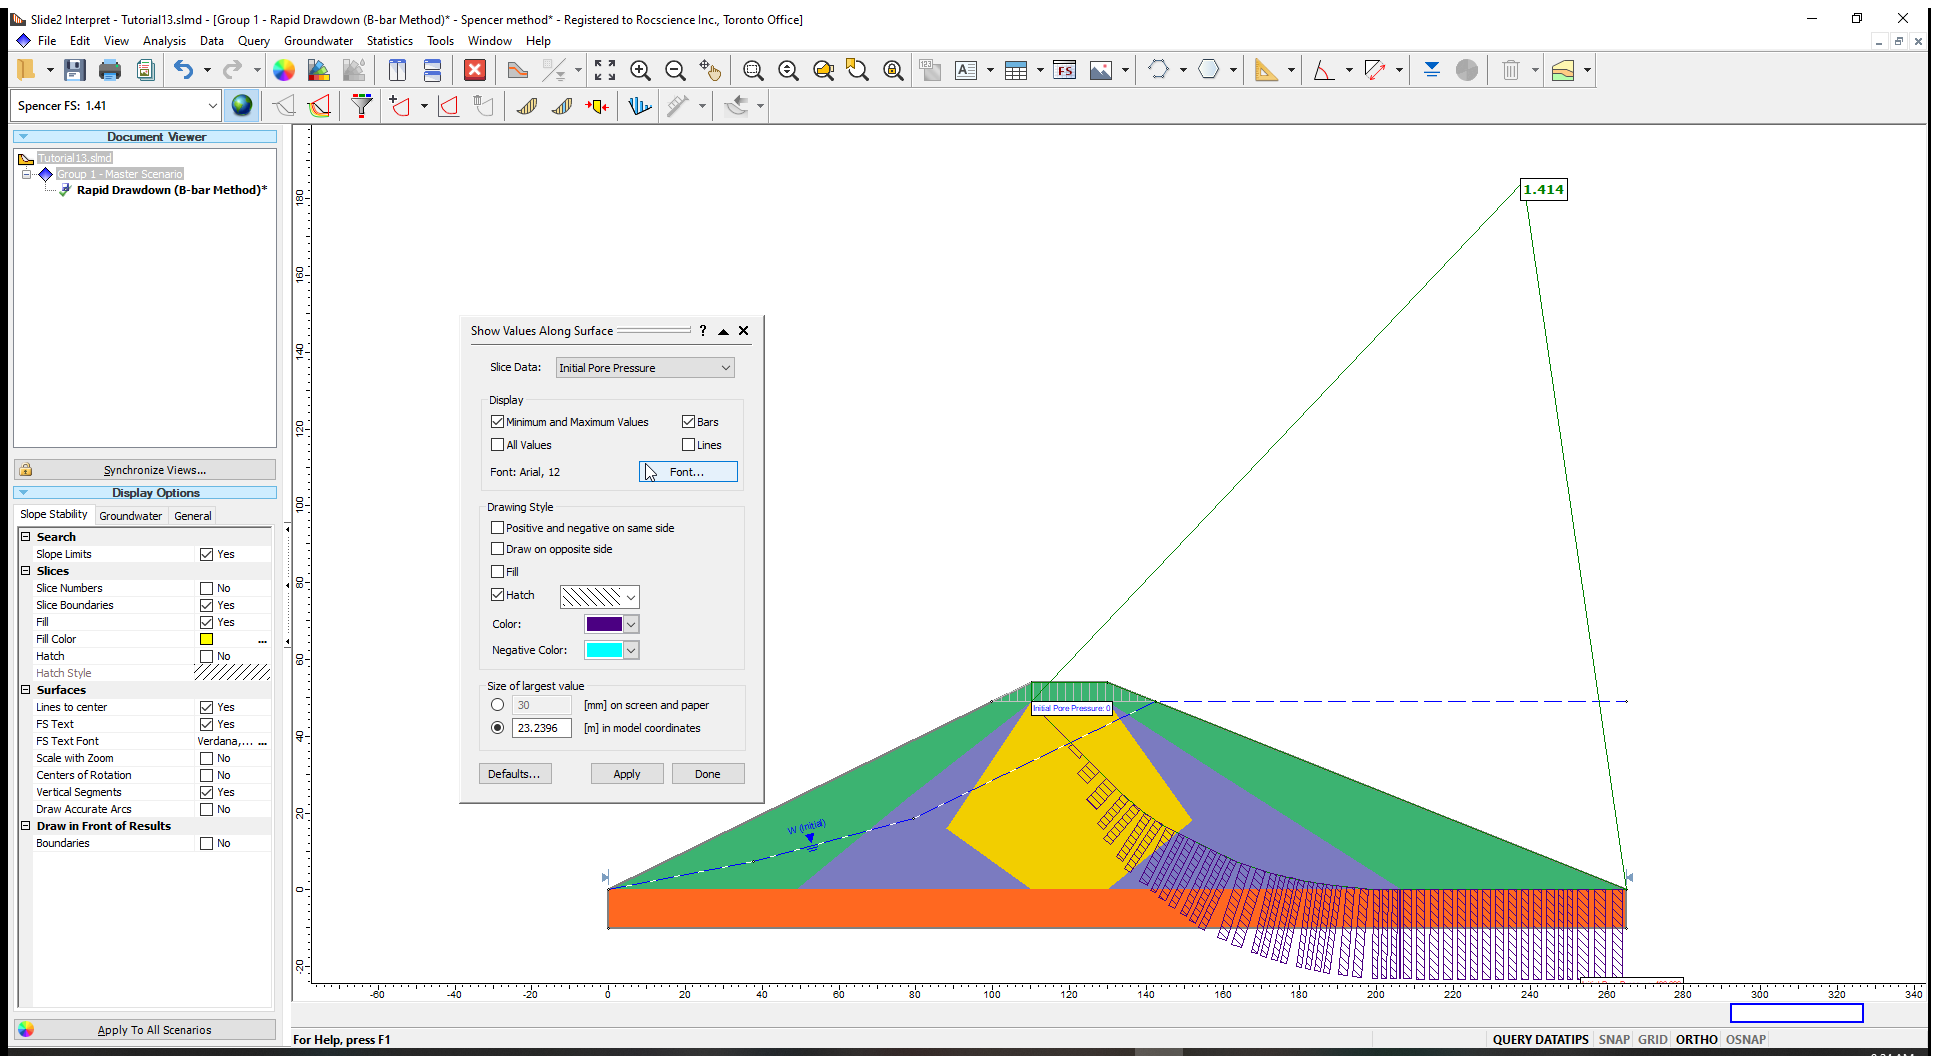
- Select Query > Show Values Along Surface

- Using the drop down menu, set Slice Data = Initial Pore Pressure.
The initial pore pressure corresponds to the W(Initial) line and is as expected.
- Now change the Slice Data to Pore Pressure. This will display the final pore pressure. As expected, the pore pressure is zero for the free draining, granular fill material.
The pore pressure through the transition material is lower than the initial pressure, due to the negative change in pore pressure from the removal of the ponded water load.
- You can also view the Excess Pore Pressure by setting the Slice Data to Excess Pore Pressure.
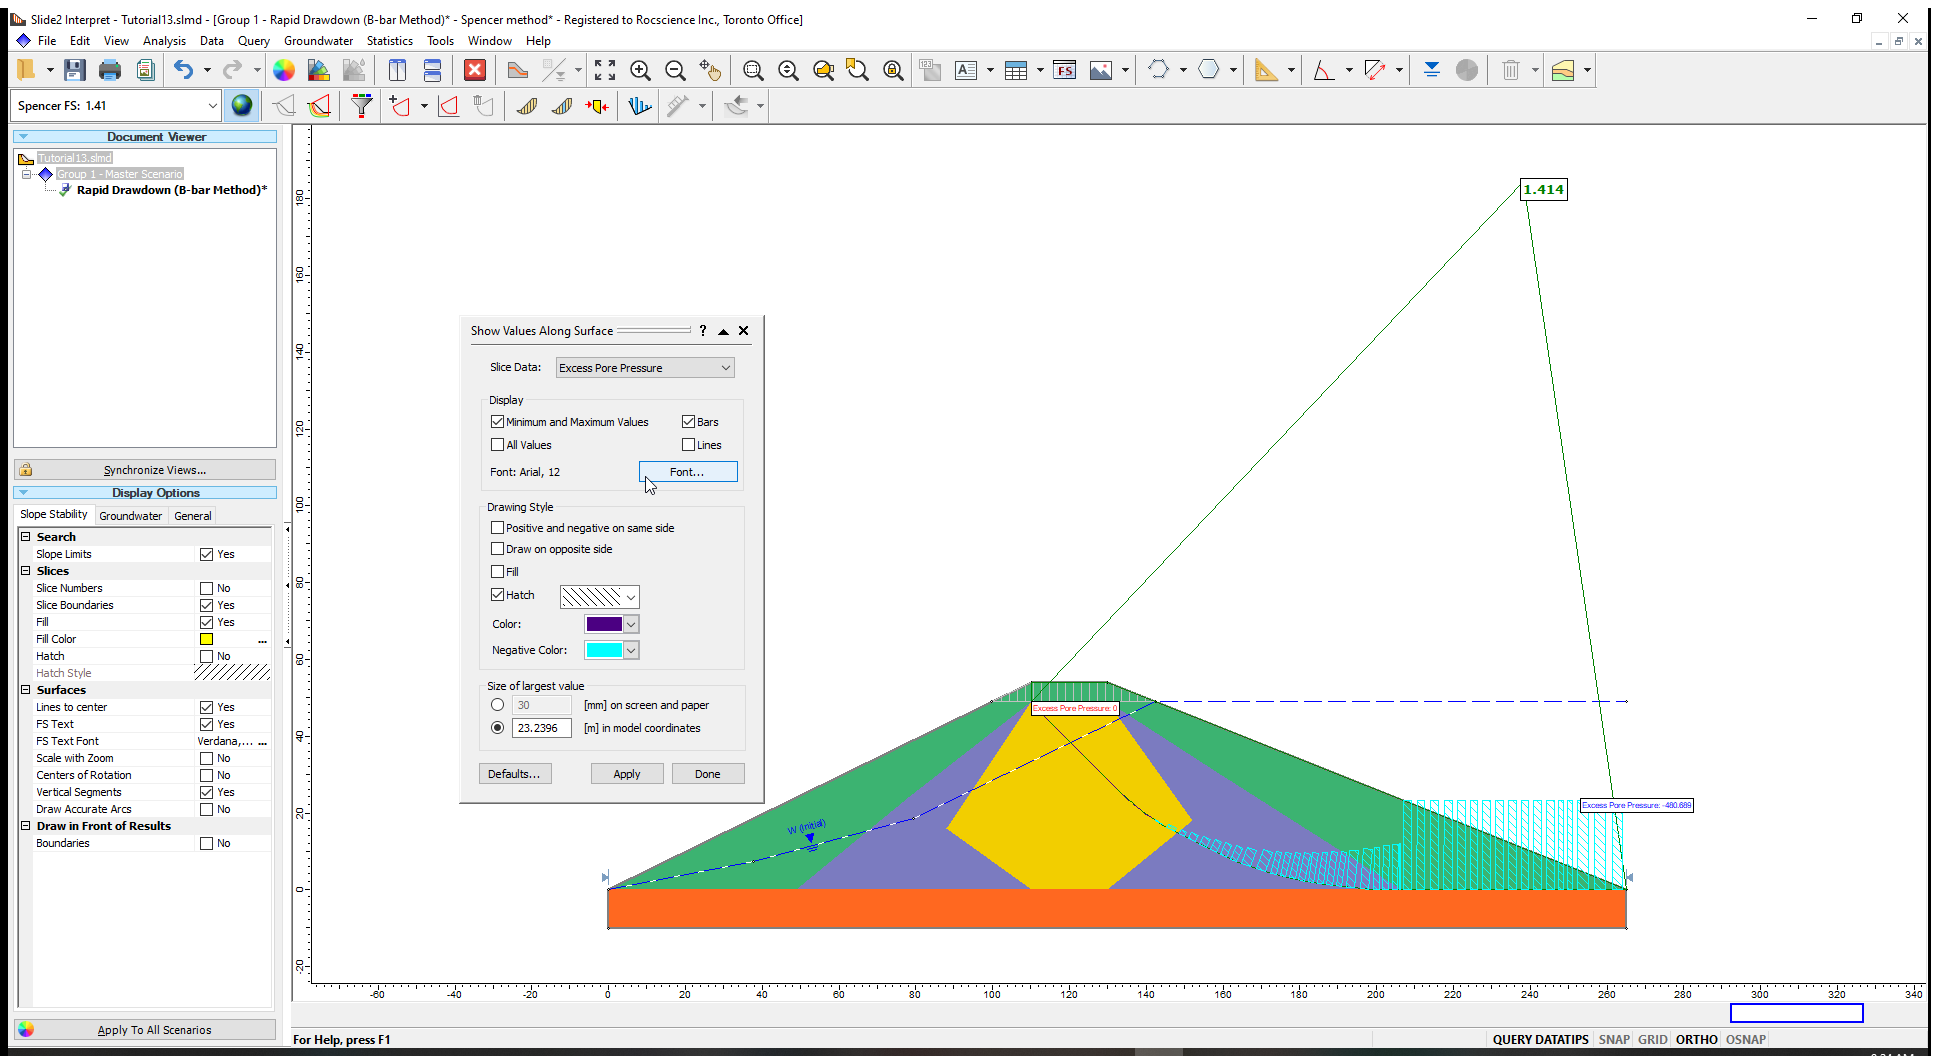
Note that since the granular fill is free draining, the negative excess pore pressure is NOT due to the B-bar unloading effect but is simply the difference between the initial and final pore pressure.
5.0 Duncan, Wright, Wong 3 Stage (1990)
The Duncan, Wright and Wong (1990) method uses a three-stage approach for modelling rapid drawdown. The first stage is the full reservoir (steady state) analysis of the dam before drawdown. The effective normal and shear stresses at the base of each slice are calculated. Once those calculations are completed, the effective normal and shear stresses along the slip surface are used to determine undrained shear strengths for the low permeability materials.
In the second stage the stability analysis of the dam is done when the water level is at the final level (the pore pressures are calculated using this final water level). The new effective strength parameters are used for the free draining materials, and the undrained shear strengths determined from the previous stage are used for the low permeability materials.
In the third stage, a check is performed to see if the effective stress after drawdown produces a drained strength that is less than the undrained strength. If any slices are found for which this is the case, then the drained strength is substituted and the analysis is rerun. The factor of safety computed from the third stage analysis is used to represent the stability after rapid drawdown.
- Right-click on the Rapid Drawdown (B-bar Method) scenario and select Duplicate scenario.
- Right-click the new scenario to rename Scenario 3 as Rapid Drawdown (Duncan, Wright, Wong Method).
Now we must set the method of analysis in Project Settings.
- Go to Analysis > Project Settings
- In the Groundwater tab, change the method of the Rapid Drawdown to Duncan, Wright, Wong at 3 Stage 1990.
We will keep the default Undrained Strength Interpolation Scheme for Rapid Drawdown as Duncan, Wright, Wong (1990).
- Click ‘OK’ to save the settings and exit the Project Settings dialog.
Next, we must define the undrained strength of the slope materials in the Material Properties dialog.
- Select Properties > Define Materials
- Select the clay core material and under Rapid drawdown parameters, click on Define Strength to open the Multistage Rapid drawdown parameters shown below.
There are different shear strength envelope types used to represent the undrained strength of materials in Slide2.
We will define the clay core, transition, and hard bottom materials using the Total Stress R Envelope-Linear approach.
This approach requires two parameters – CR and PhiR. For details about the meaning of these different envelopes, and their relationship to each other, see the Rapid Drawdown page in the Online Help.
- In the Multi-Stage dialog, select the Total Stress R envelope radio button and enter a CR of 40 and a PhiR of 15.
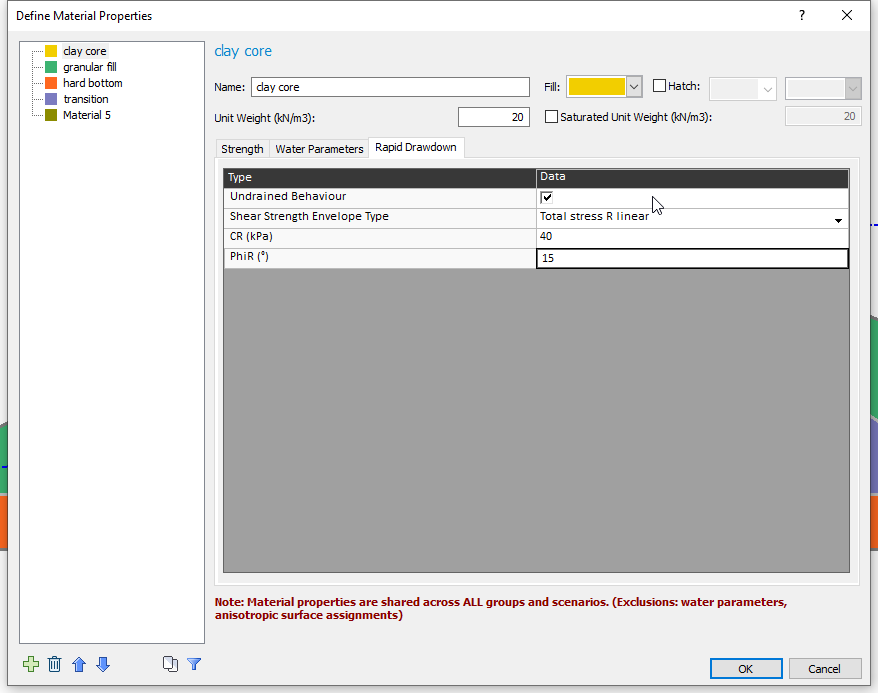
- Click OK to close the dialog.
- Select the transition material and enter CR= 60 and PhiR=15 in the Multi-Stage Rapid dialog.
- Select the hard bottom material and enter CR= 200 and PhiR=45 in the Multi-Stage Rapid dialog.
- Click OK to close the Define Material Properties dialog.
5.1 Computation and Interpretation
- Select Analysis > Compute and run the Rapid drawdown (Duncan, Wright, Wong method) scenario.
- Select Analysis > Interpret to view results when computations are done.

The safety factor is about 1.5. This value is again significantly lower than the safety factor of under the full reservoir loading calculated in the Master Scenario, but similar to the B-Bar Method.
6.0 Army Corp Eng. Method (1970)
The Army Corps method uses the R envelope. The R envelope is then combined with the effective stress envelope to avoid relying on elevated shear strengths that result from negative pore pressures. We will need to specify the method in Project Settings.
- Duplicate the Rapid Drawdown (Duncan, Wright, Wong Method) Scenario.
- Rename Scenario 4 to Rapid Drawdown (Army Corp Eng. Method).
- Go to Analysis > Project Settings , and in the Groundwater tab change the Rapid Drawdown method to Army Corp Eng. (1970).
- Select Analysis > Compute to perform the calculations and Analysis > Interpret to view results when computations are done.

The factor of safety for the Army Corps method is approximately 1.4 – significantly lower than the other methods. This agrees with the general observation that the Army Corps method gives results that are conservative.
7.0 Lowe and Karafiath (1960)
The Lowe and Karafiath (1960) method is essentially the same as the Duncan, Wright and Wong method. The only difference between the two is that the Lowe and Karafiath method does not perform the third stage of calculation in which it checks whether effective stresses after drawdown produce drained strengths lower than undrained strengths.
- Duplicate the Rapid Drawdown (Army Corp Method) Scenario.
- Rename Scenario 5 to Rapid Drawdown (Lowe and Karafiath Method).
- Go to Analysis > Project Settings , and in the Groundwater tab change the Rapid Drawdown method to Lowe and Karafiath (1960).
Keep the default Undrained Strength Interpolation Scheme for Rapid Drawdown option as Duncan, Wright, Wong (1990) just as we did for the Duncan, Wright, Wong Method.
- Click OK.
7.1 Computation and Interpretation
- Select Analysis > Compute and run the Rapid Drawdown (Lowe and Karafiath Method) scenario.
- Select Analysis > Interpret to view results when computations are done.

The safety factor of the Lowe method is 1.5, which is again significantly lower than that for the Master Scenario with the full reservoir.
8.0 Additional Exercise
In Slide2, we can also model rapid drawdown to a specified water level, rather than complete drawdown.
As an additional exercise:
- Duplicate the Rapid Drawdown (Lowe Karafiath Method) scenario
- Name the new scenario Rapid Drawdown (Partial).
We will now draw the final water level. To draw the water table:
- Select Boundaries > Add Drawdown Line

- Enter ‘t’ in the prompt line and press Enter to open the coordinates table. Alternatively, you can right click on the model and select Coordinate Table
 from the menu.
 Enter the X and Y coordinates in the table. (TIP: You can copy the coordinates and paste them in the coordinate dialog.)
X-Coordinate
Y-Coordinate
0
0
37.8
7.4
79.3
18.5
135.4
45.5
175.1
20
265
20
- Click OK to close the coordinate table and press Enter to finish drawing the water table.
The new water table will be labelled as ‘W (Final)’ as shown on the image below.
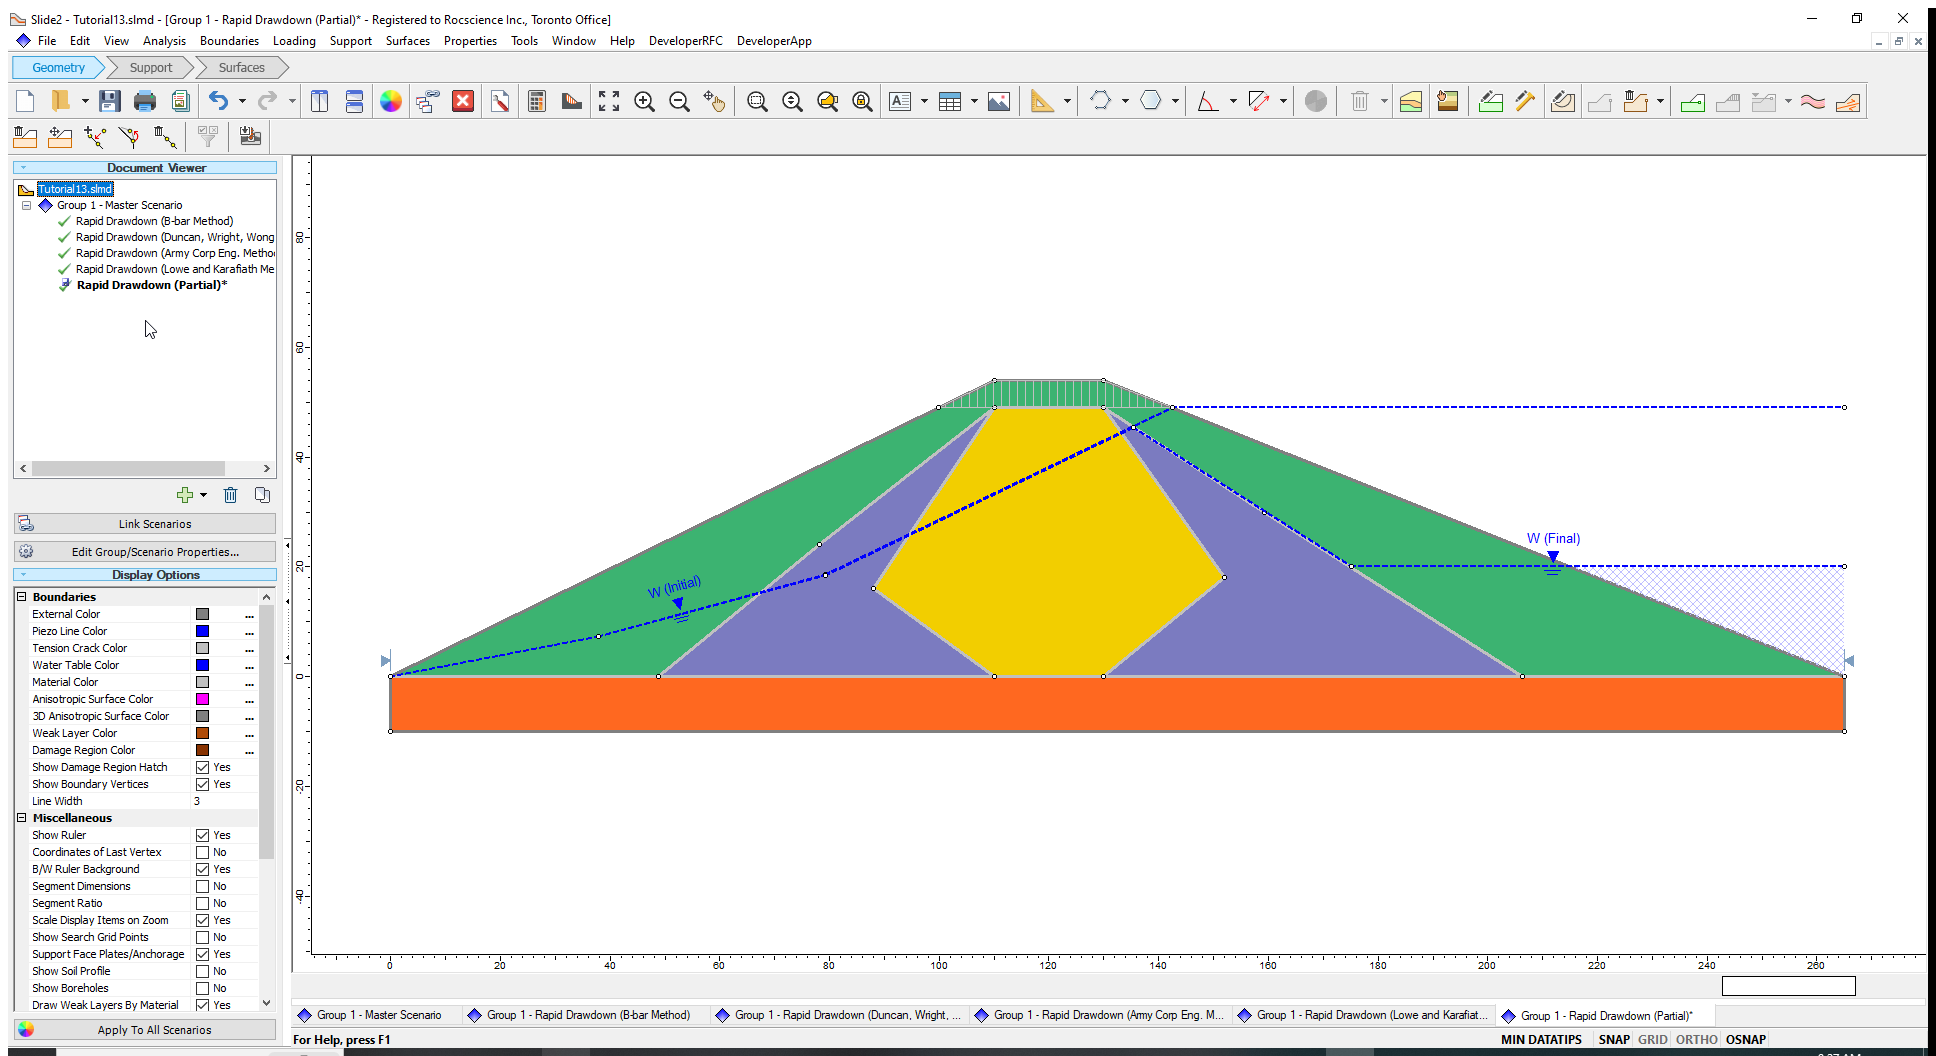
Ponded water is defined where the drawdown water level is above the slope. In this case, the change in loading will be due to the difference in the weight of ponded water between the initial and final water tables. This unloading will create a negative change in pore pressure for undrained materials.
Run this analysis using the various rapid drawdown methods.
For this example, the factor of safety at partial drawdown is lower than the factor of safety at full reservoir or complete drawdown. This is due to the material properties and geometry of the slope – e.g., complete drainage (zero pore pressure), assumed for the granular material for the complete drawdown state. At partial drawdown, the drawdown water table creates significant pore pressure in the granular material, towards the toe of the slope, and this leads to the lower safety factor. For this model, a minimum safety factor, therefore, exists at some intermediate drawdown level.
9.0 References
Corps of Engineers, 1970. Engineering and Design – Stability of Earth and Rock Fill Dams, Engineering Manual, EM 1110-2-1902. Department of the U.S. Army, Corps of Engineers, Office of the Chief of Engineers.
Duncan, J.M., Wright, S.G. and Wong, K.A., 1990. Slope Stability during Rapid Drawdown, Proceedings of H. Bolton Seed Memorial Symposium. Vol. 2.
Lowe, J and Karafiath, L., 1960. Stability of Earth Dams Upon Drawdown, Proceedings of 1st PanAm Conference on Soil Mechanic and Foundation Engineering. Mexico City, Vol 2.