Probabilistic Analysis
1.0 Introduction
Probabilistic Analysis can be performed using Slide3 for various applications of slope stability. This tutorial covers a simple slope geometry with varying material property assigned to the slope stability analysis. The objective of this tutorial is to introduce the use of probabilistic feature in Slide3 and the associated interpretation of the results.
All tutorial files installed with Slide3 can be accessed by selecting File > Recent > Tutorials folder from the Slid3 main menu. The finished product of this tutorial can be found in the Probabilistic Analysis_simple slope_intial.Slide3m2 file Probabilistic Analysis_global min_final.Slide3m2, and Probabilistic Analysis_overall slope_final.Slide3m2.
2.0 Project Settings
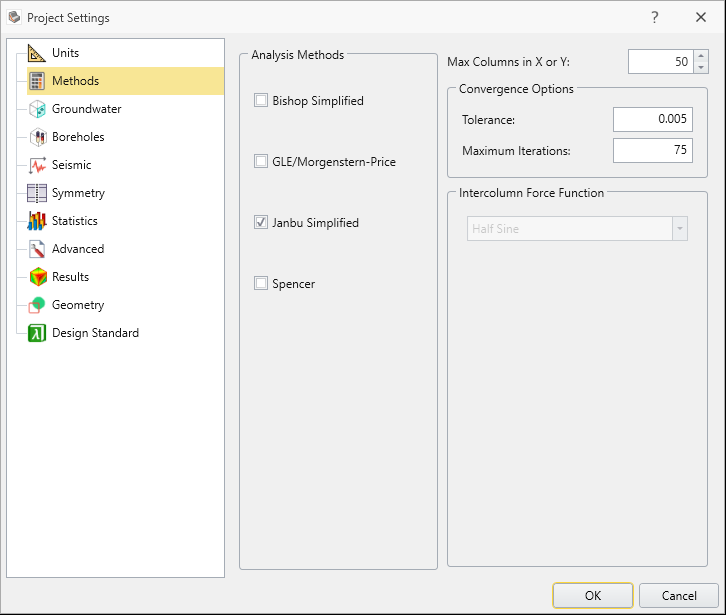
- Select Analysis > Project Settings

- We will first check for methods. Check the Janbu simplified analysis setting.
- Go to the Statistics tab next and check if Probabilistic Analysis has been selected as shown below:
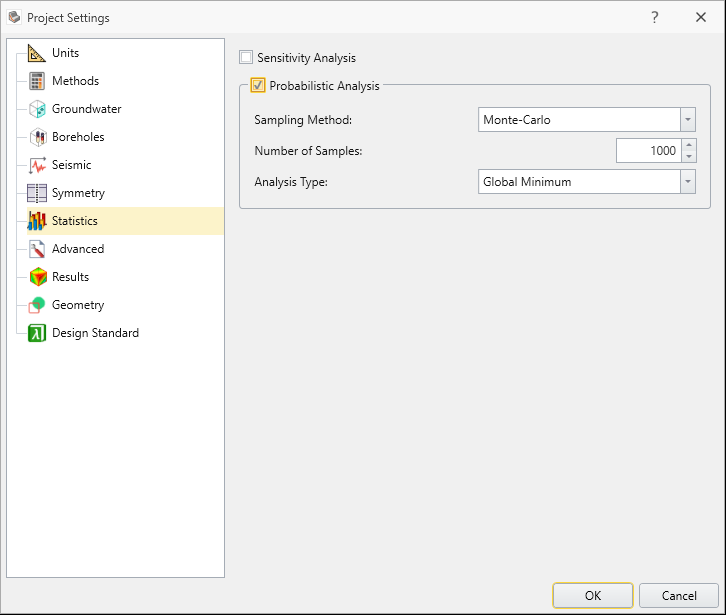
- Under Sampling methods there are three different types of methods available. For this tutorial, we will use:
- Analysis Method: Monte-Carlo simulation
- Number of samples: 1000
- Analysis Type: Global Minimum.
- Select OK.
3.0 Material Properties
We will now look at how we can apply probabilistic setting to our material properties.
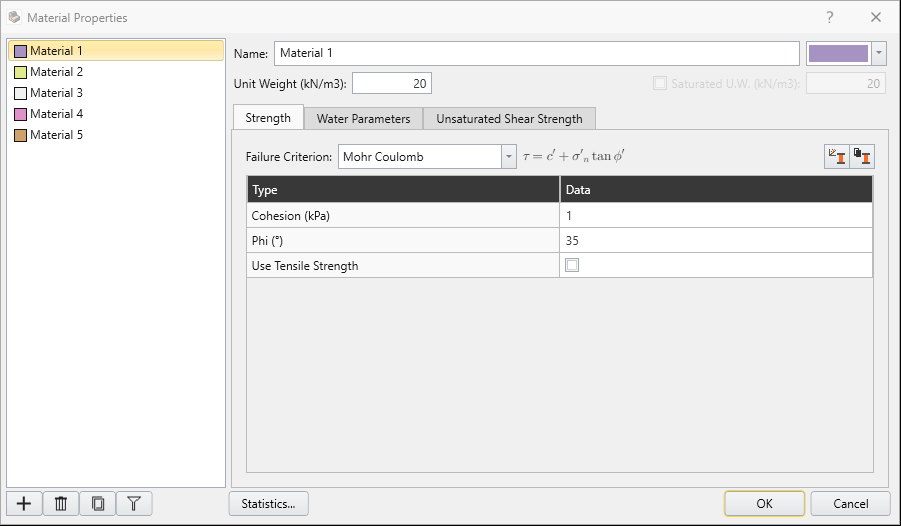
- Select Material > Define Materials

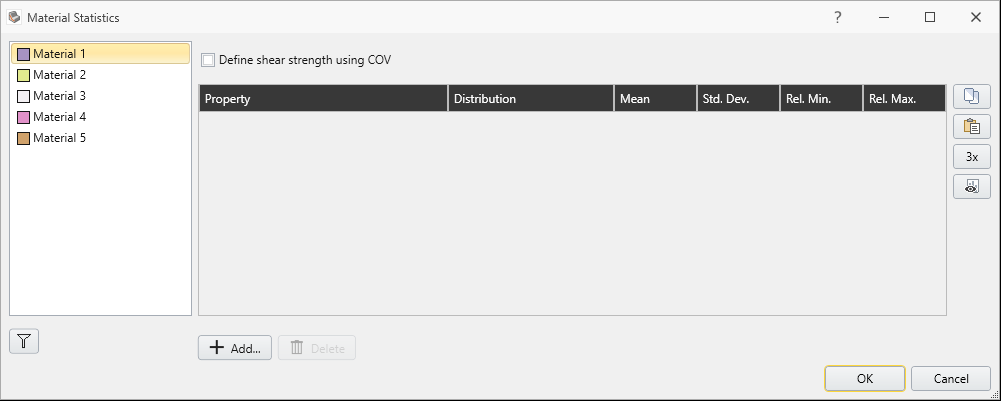
- You will see the following dialog as shown below. In Materials 1, select the Statistics button right beside the down arrow of the layer tree at the bottom of the dialog.
- When you click on the statistics button, you will see the following dialog pop up. Select the Add button then.
We will be changing the value of friction angle, Phi, value as random variable with the following input values. Check the Phi variable as shown below and select OK. 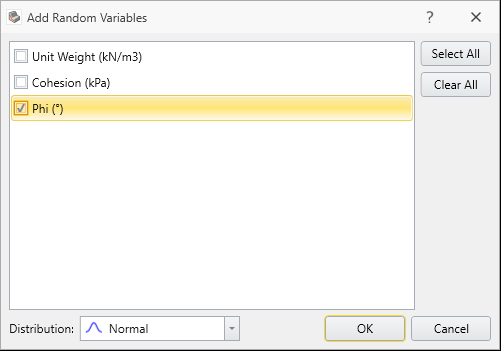
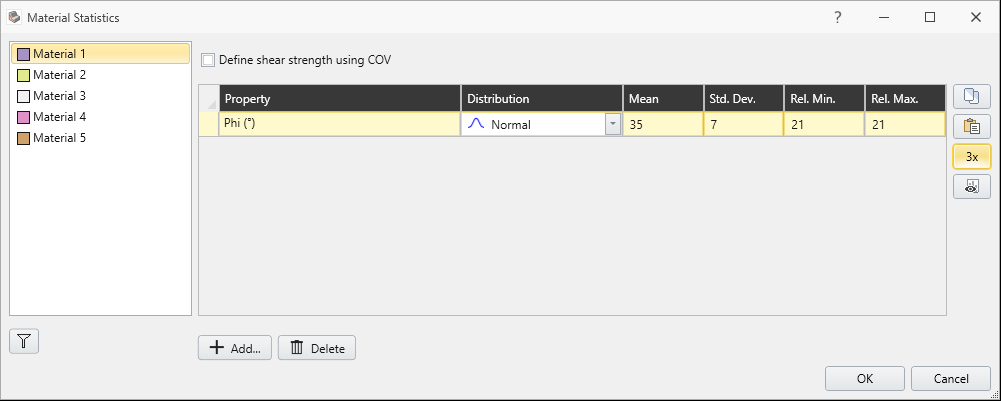
- You will see the following input. Once you check the values, Select OK.
- Distribution: Normal
- mean value of 35 degrees
- Standard deviation of 7
- Relative Min/Max = 21
- Select OK. Then you will see the geometry with Material 1 assigned to the simple slope model.
(For this value, you can just select the 3x button beside the dialog which automatically sets relative min/max value to 3x the standard deviation value).
4.0 Compute the model
We will first analyze the simple geometry. Save the model as final version and compute.
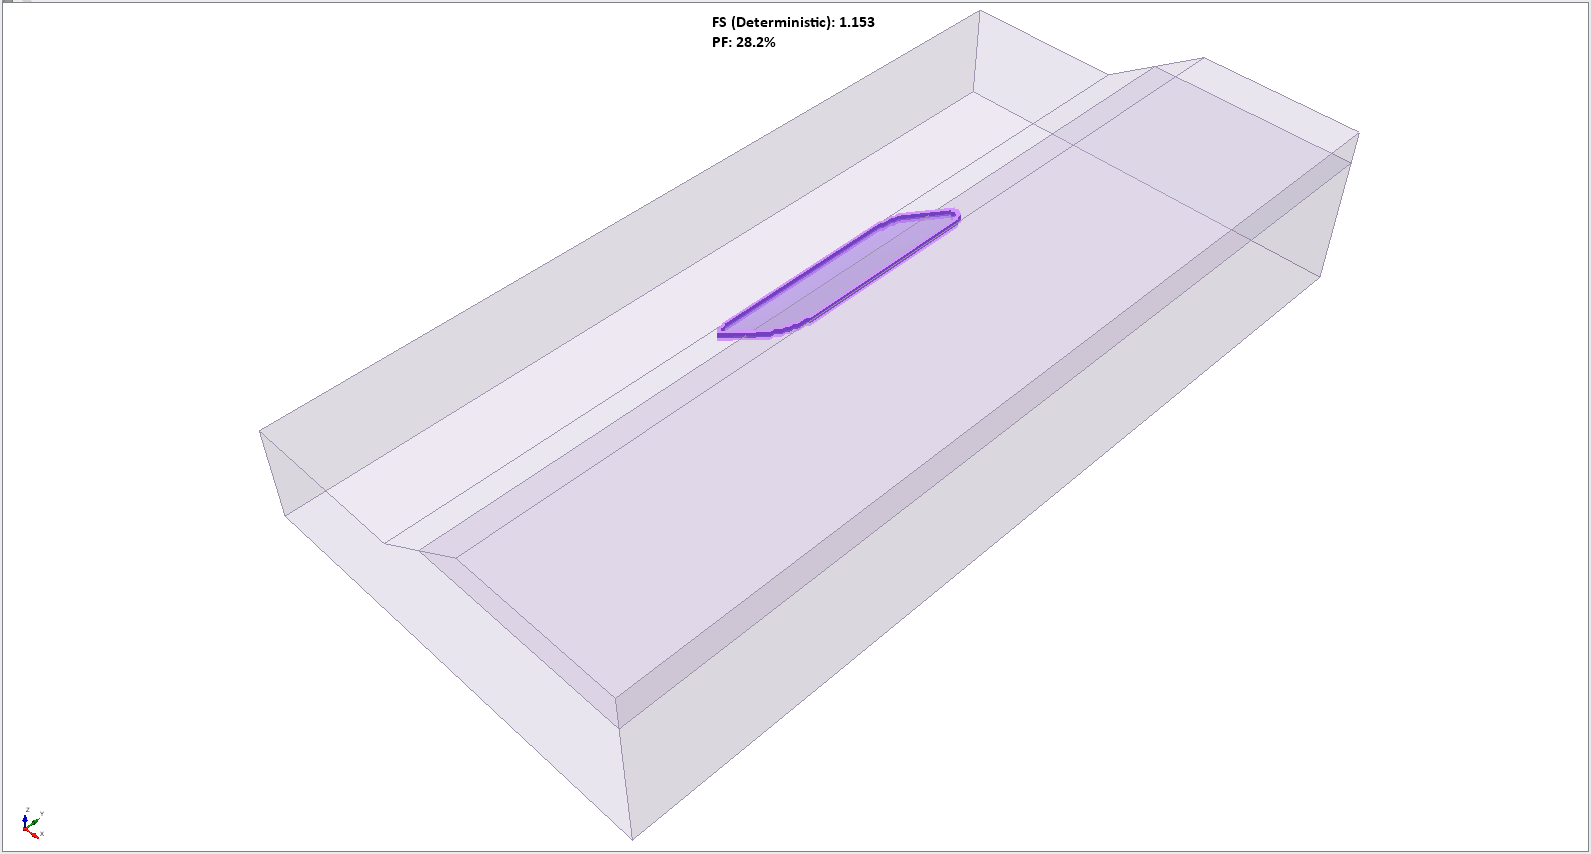
- Select Compute

You will see the result as shown below with Janbu FOS of 1.15 with Probability of Failure (PF) of about 29% as shown below.
We will now apply section cut across the middle of the geometry and compare the result with Slide2.
- Select View > Slide2 Section Creator

- Select the Add a single section button. You will see the following dialog as shown below.
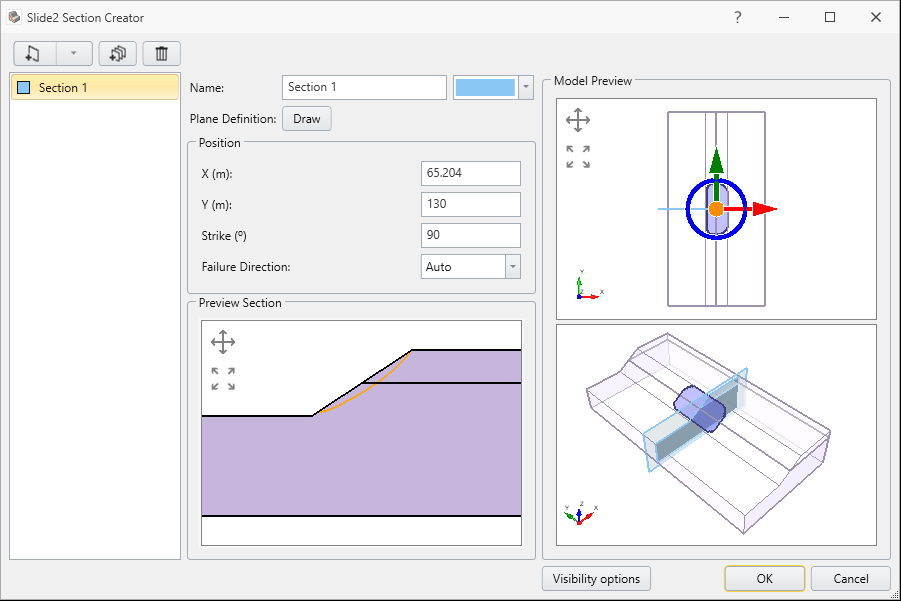
- Keep the following default values and click OK.
- Select Analysis > Slide2 Integration > Slide2 Compute.
Then, we will compute the cut section to Slide3.
Once the computation is done, we will see both the computed result from Slide3 and Slide2 as shown below:
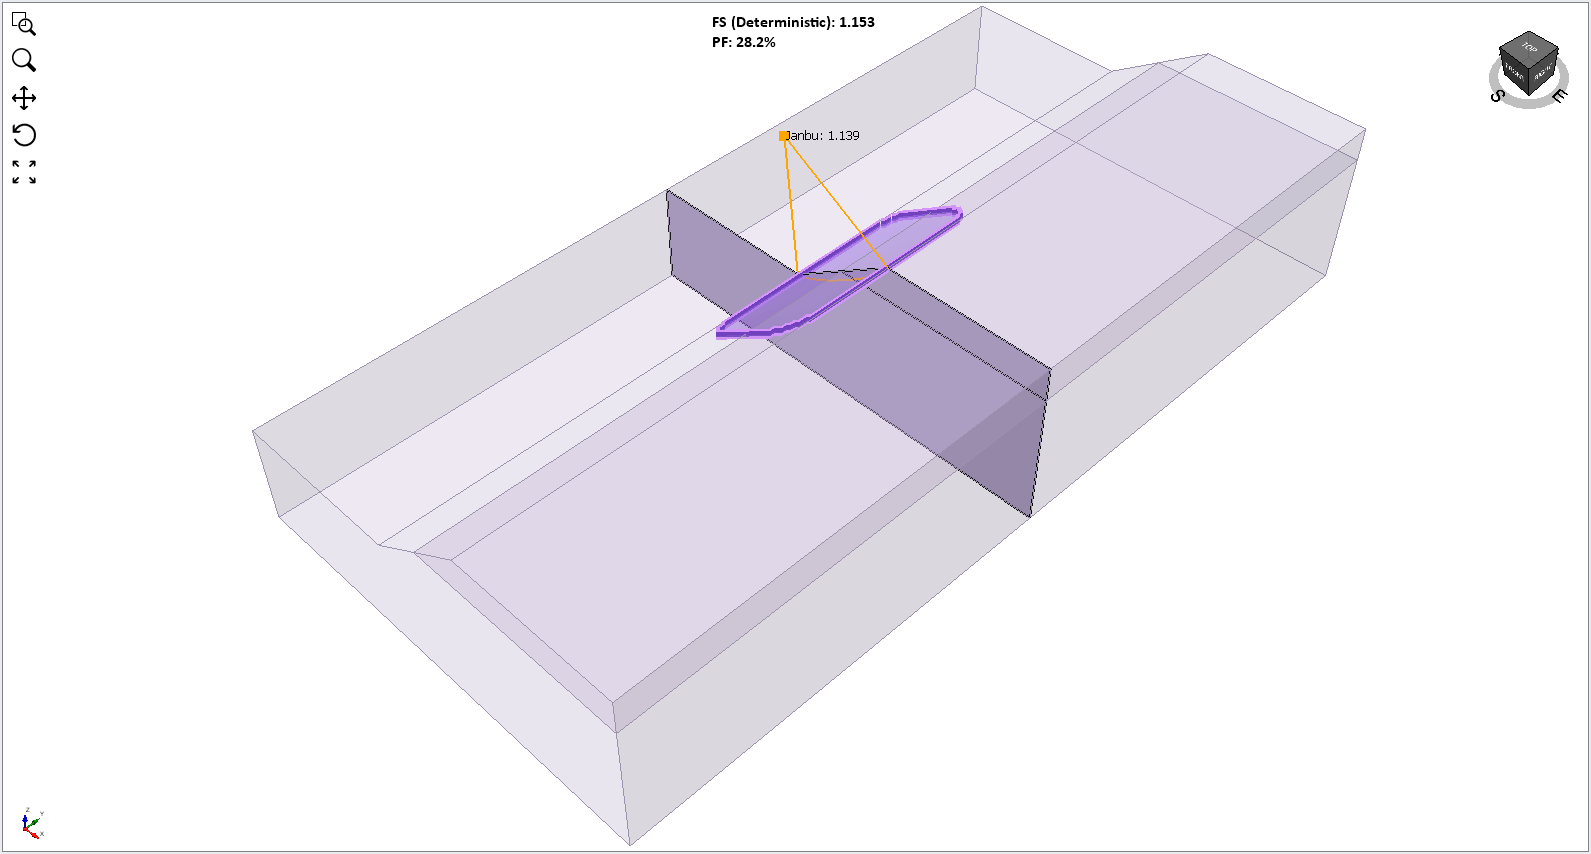
As you can see, the FOS using Janbu simplified method for Slide3 = 1.15 and Slide2 = 1.15, which is relatively similar. We will import this cut section over to Slide2 in order to compare the results.
5.0 Comparing the result with Slide2 for cut section
Since we have already computed the section cut using Slide2, we will view the section result with Slide2 Interpret.
- Select Analysis > Slide2 Integration > Slide2 Interpret

You will see the following result as shown below:
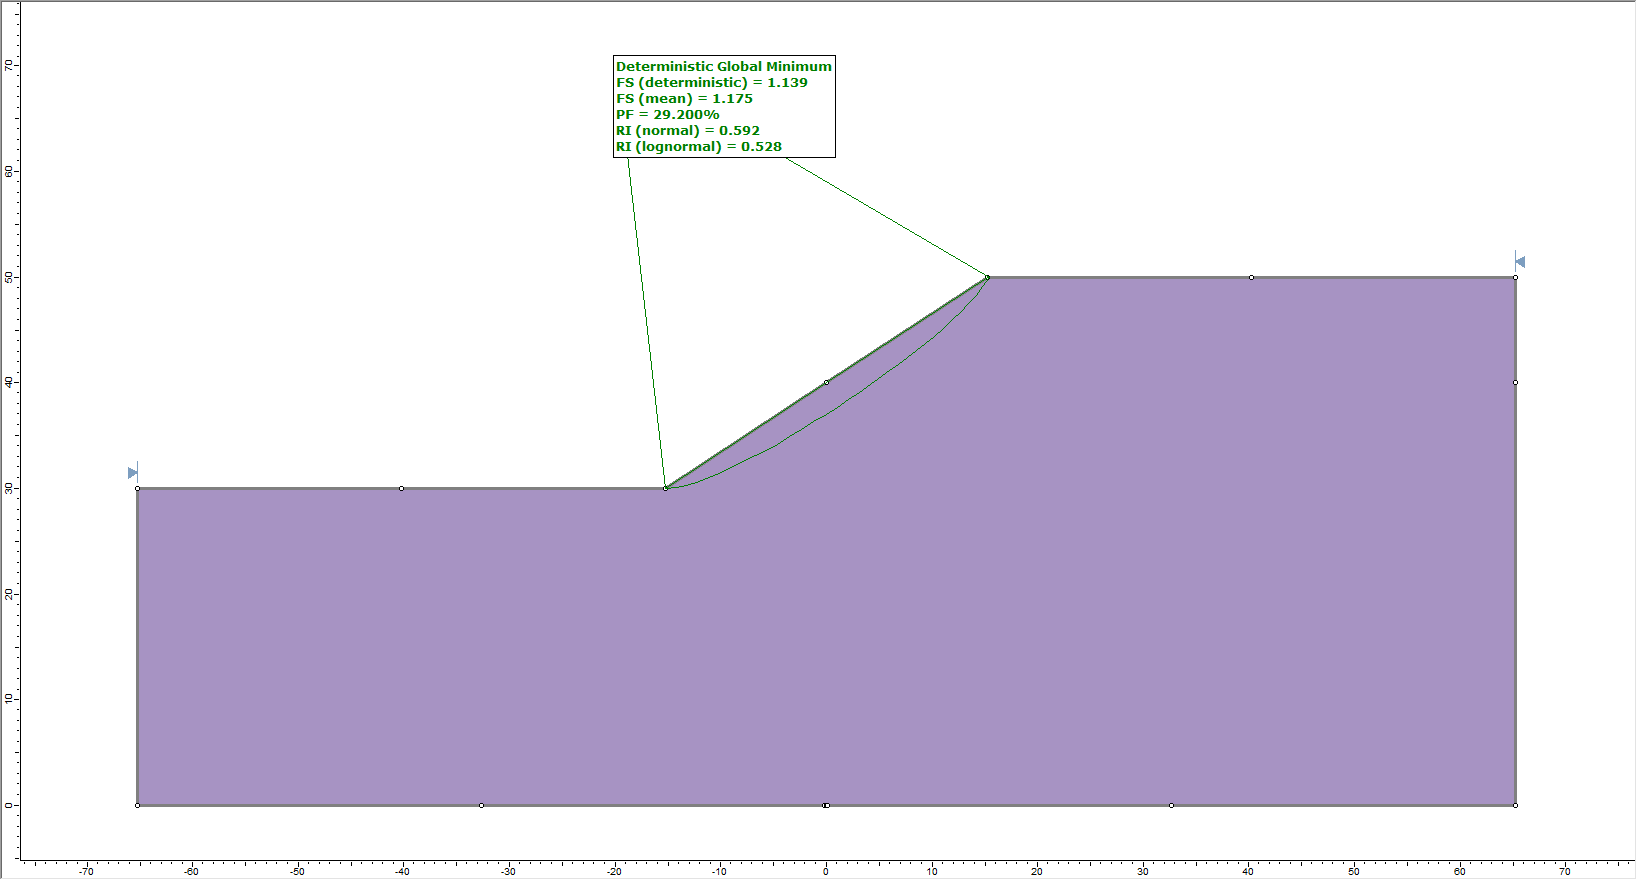
The geometry with dots represent failure slope of cut section obtained from Slide3. A table below shows the result comparison between two programs:
Slide2 | Slide3 | |
Factor of Safety | 1.14 | 1.15 |
Probability of Failure (%) | 29 | 28 |
6.0 Interpreting the result
Now we will interpret the results back in Slide3. If you look at the top toolbar in Slide3, you will see three result icons with statistics. Those can also be found by selecting:
- Statistics > Histogram plot / Scatter plot / Cumulative plot.
We will first look at the histogram of this model.
- Select Statistics > Histogram Plot

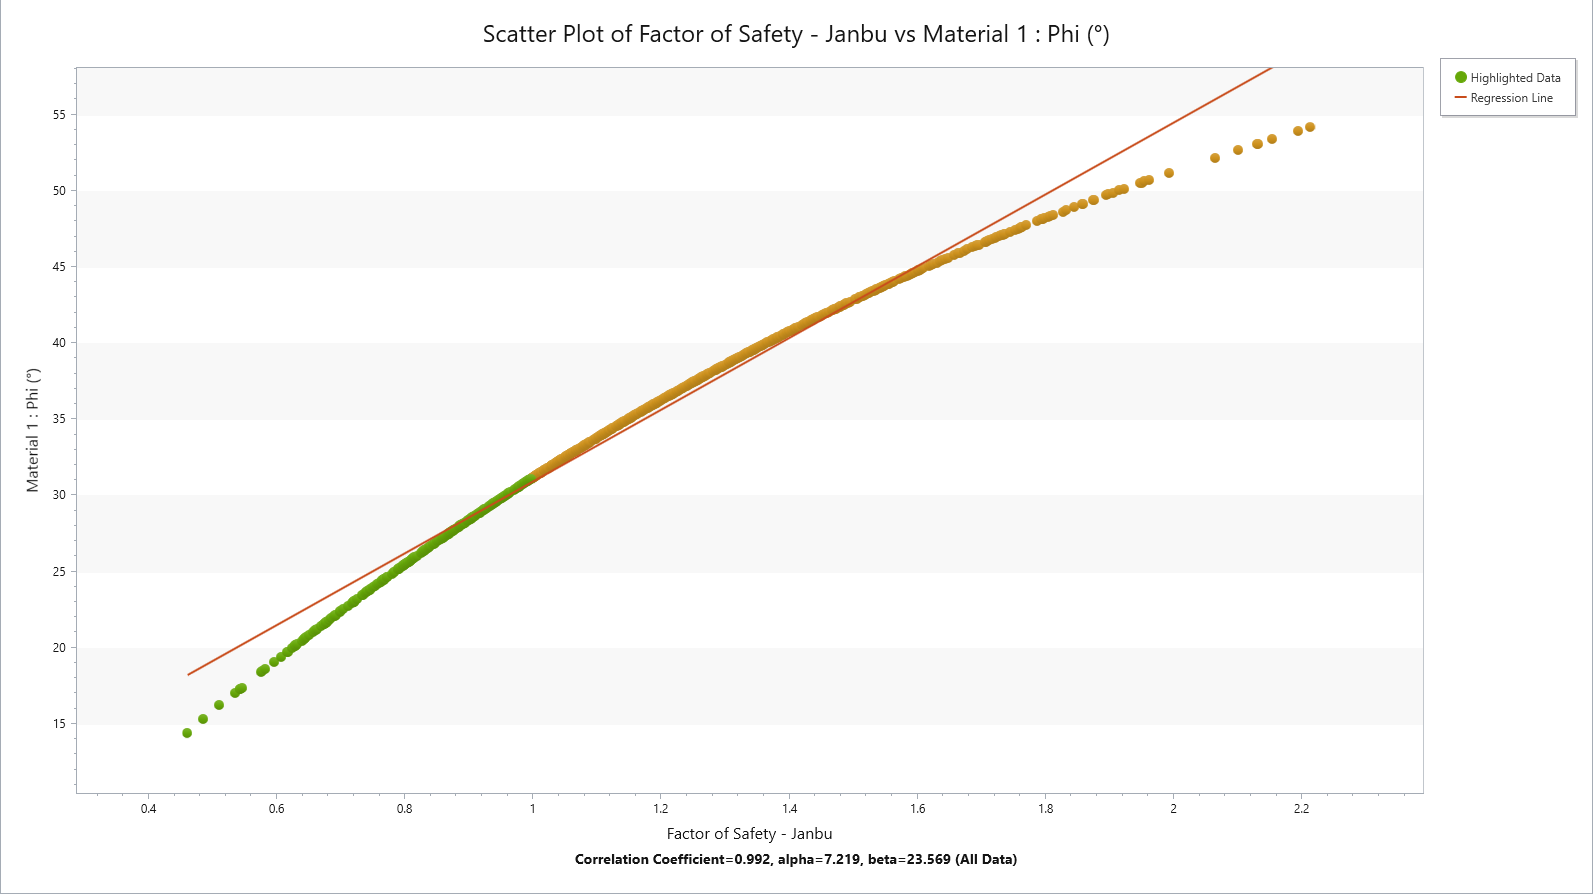
- Select Highlight Data and set the data to Factor of Safety - Janbu with comparison < 1.
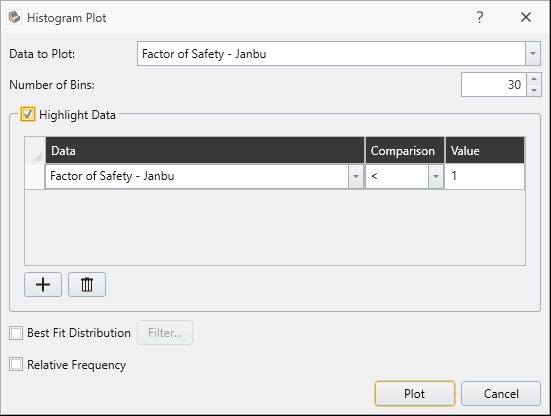
- Click Plot. You will see the following result with histogram shown below.
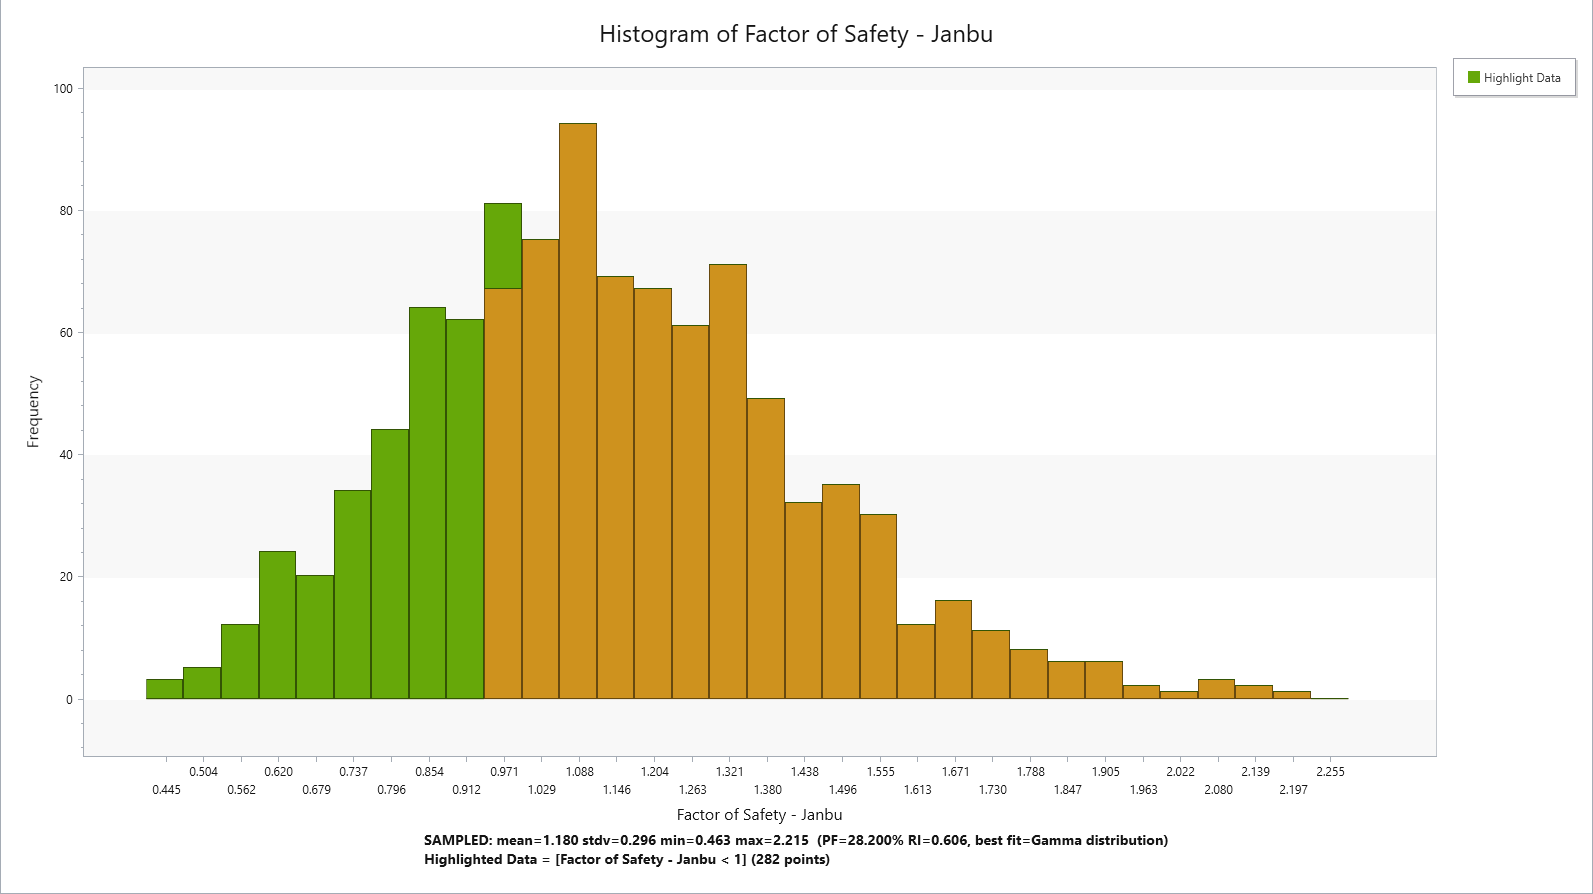
As indicated in the graph, the highligted sections are probability of failure where Factor of Safety was < 1 (with Probability of Failure = 28%).
This can also be shown through scatter plot.
- Select Statistics > Scatter Plot

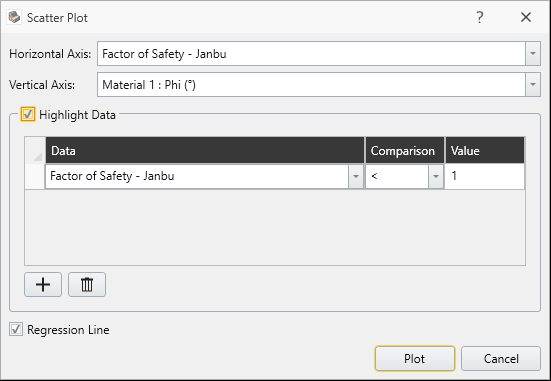
- Select Highlight Data and keep the values as default. (Factor of Safety - Janbu < 1).
Here you see the scattered plot of RV material1: Phi values with calculated Factor of Safety. As you hover over the points, you can see the calculated factor of safety for the phi value across the plot. Now we will look at the cumulative plot of the result.
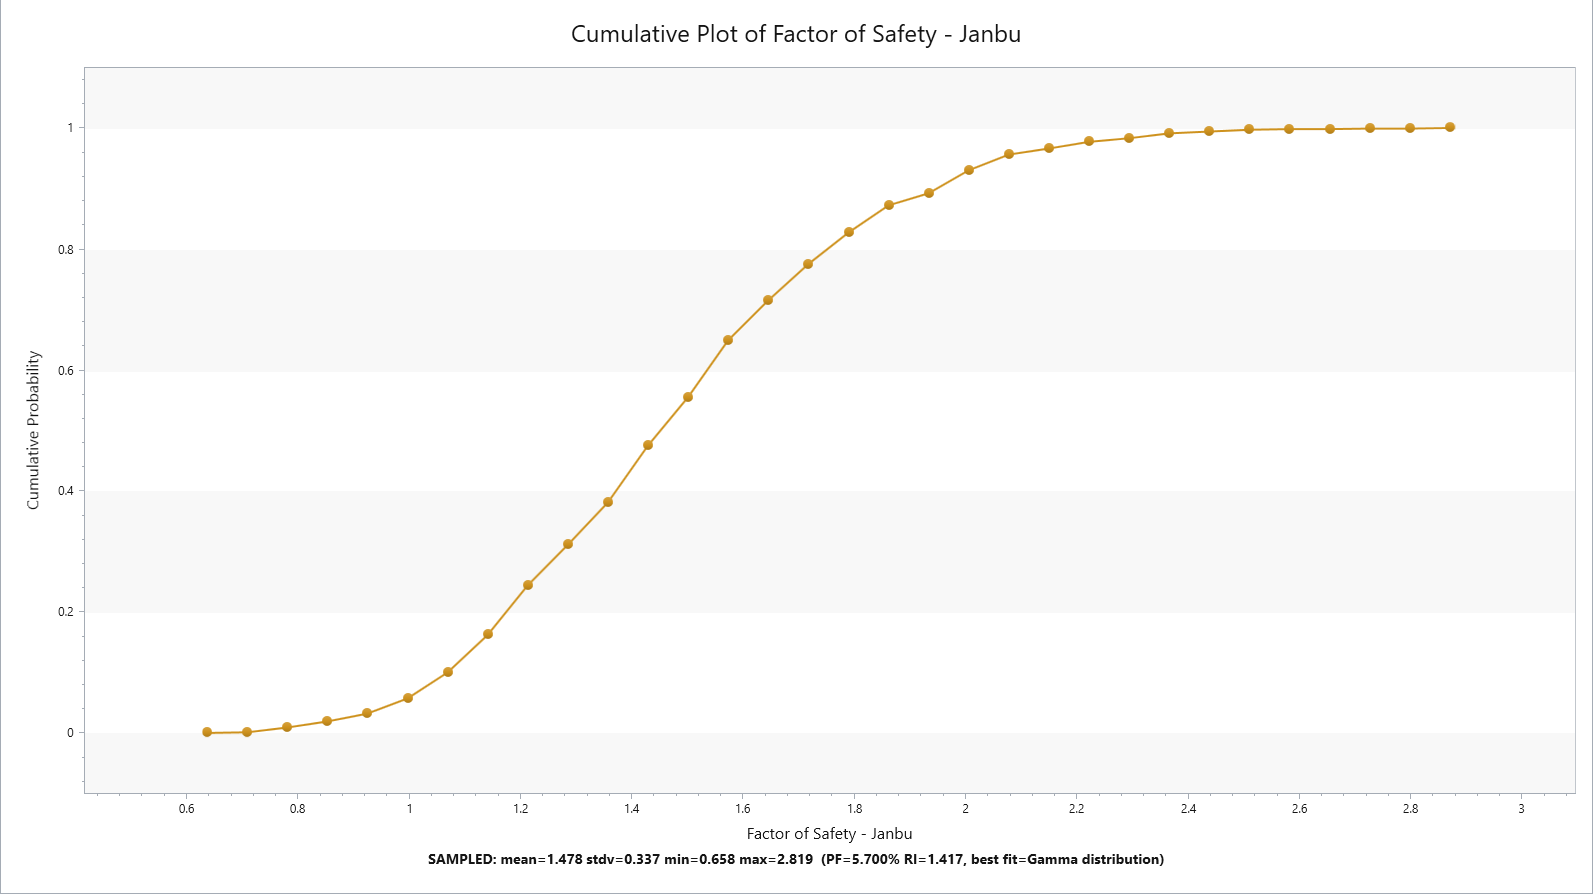
- Select Statistics > Cumulative Plot

- Press Plot and you will see the cumulative Factor of safety for cumulative probability of failure as shown.
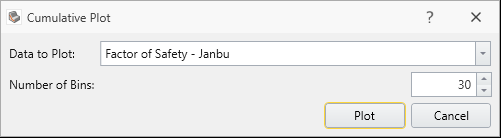
You will be prompted with this dialog.
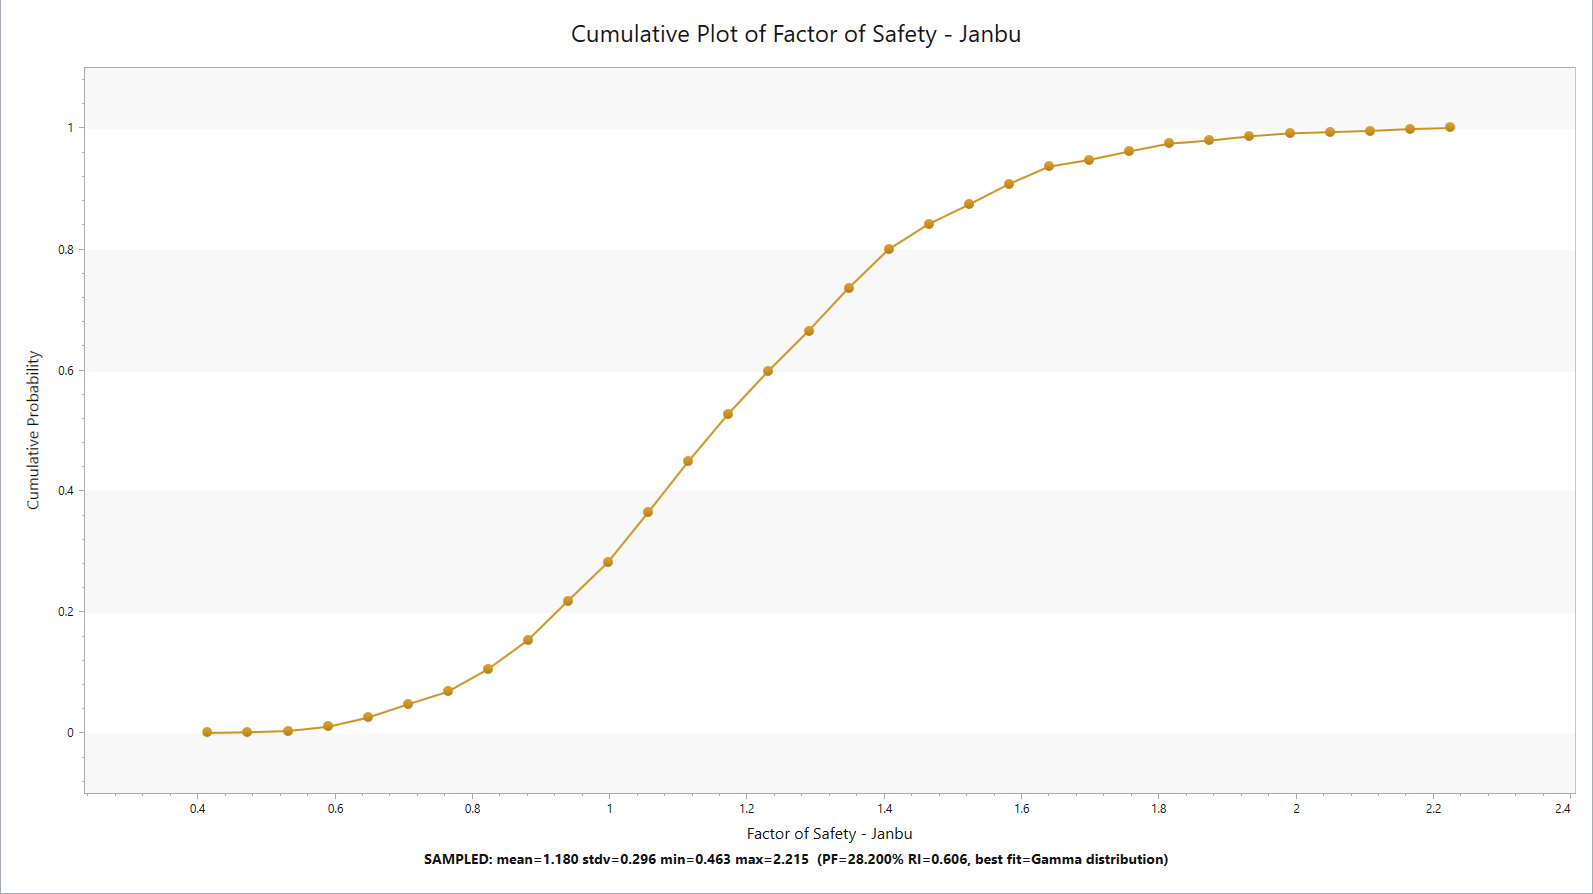
If you hover over to the Janbu FOS around 1, you can double check that probability of failure below FOS = 1 is around 0.29%.
7.0 Additional Exercise
From the previous model, we have only applied one random variable for global minimum of the model.
We can assign:
- Overall slope as analysis type.
- Assign different random variable to various section of the geometry for this exercise.
We will apply the following changes to the material properties.
- For Slope_2, assign Material 2.
- Keep the default values for inputs, but we will make changes to the statistics case.
- Select the Statistics button on material properties for Material 2.
- Select the Add button. You will see the following dialog with add Random variables.
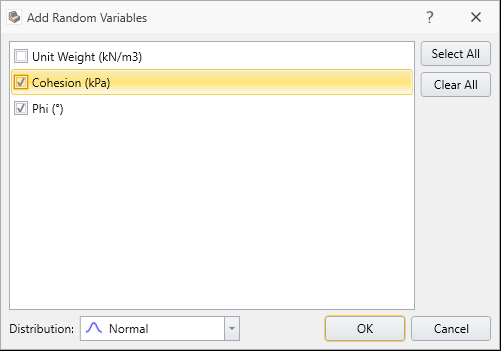
- We will assign Cohesion and Phi values to be RV (random variable). Keep the distribution to normal and select OK.
For cohesion:
- Mean = 10
- Std. Dev = 5
- Rel. Min./Max = 10
For Phi:
- Mean = 35
- Std. Dev = 7
- Rel Min./Max =21 (press the 3x button)
You will see the following dialog with the inputs as shown below.

- Rerun the analysis. Select Compute
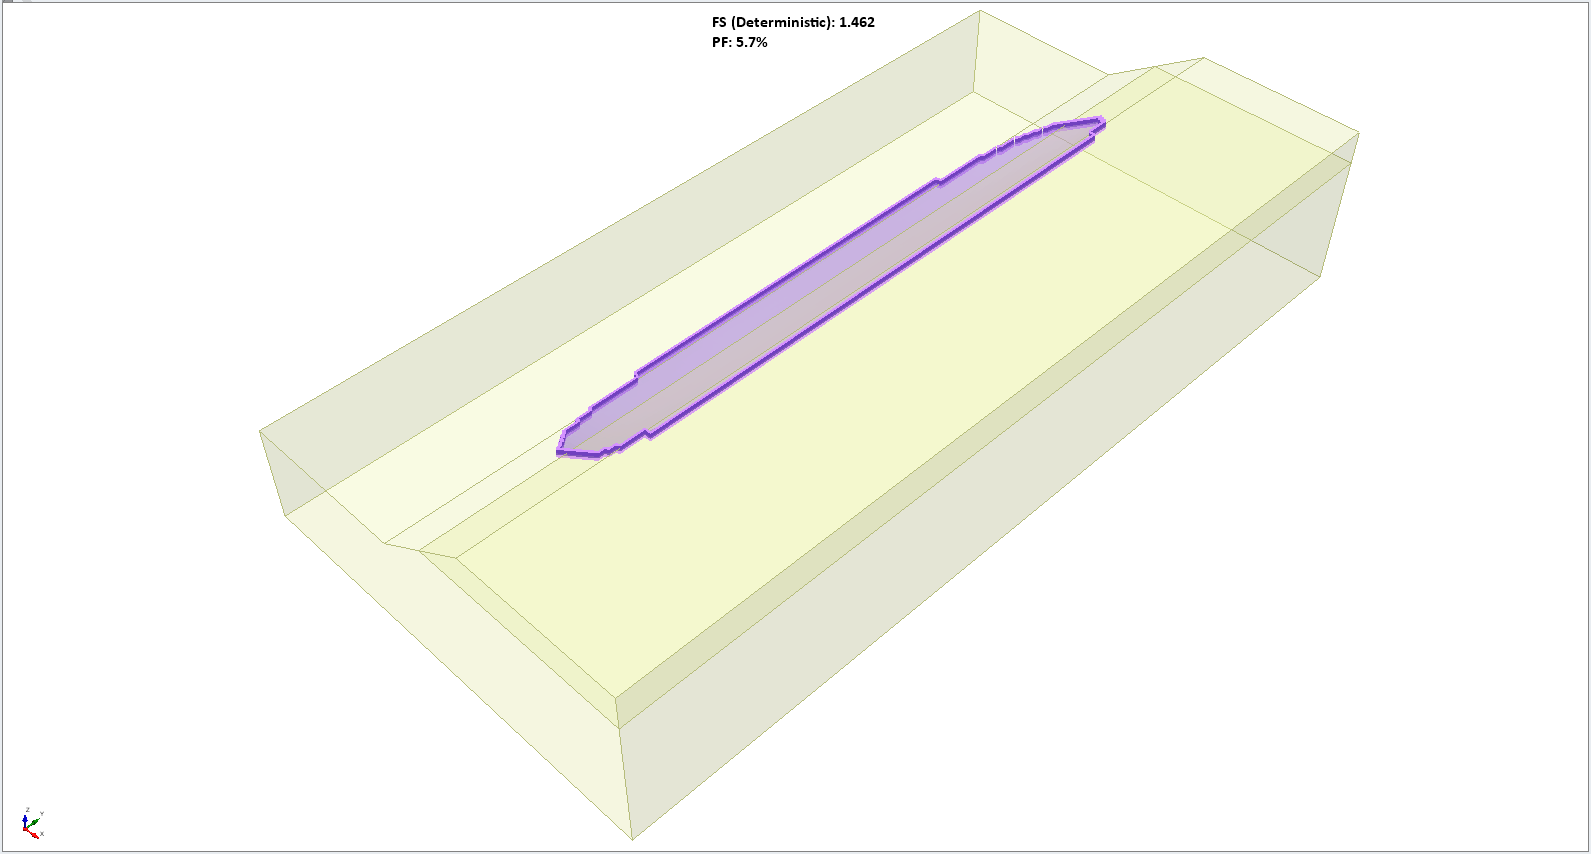
Note the change in the result when we added variability to the top slope. We will now see the results with histogram, and cumulative plots.
- Select Statistics > Histogram Plot
- Keep the default values and select Highlight Data with Janbu < 1.
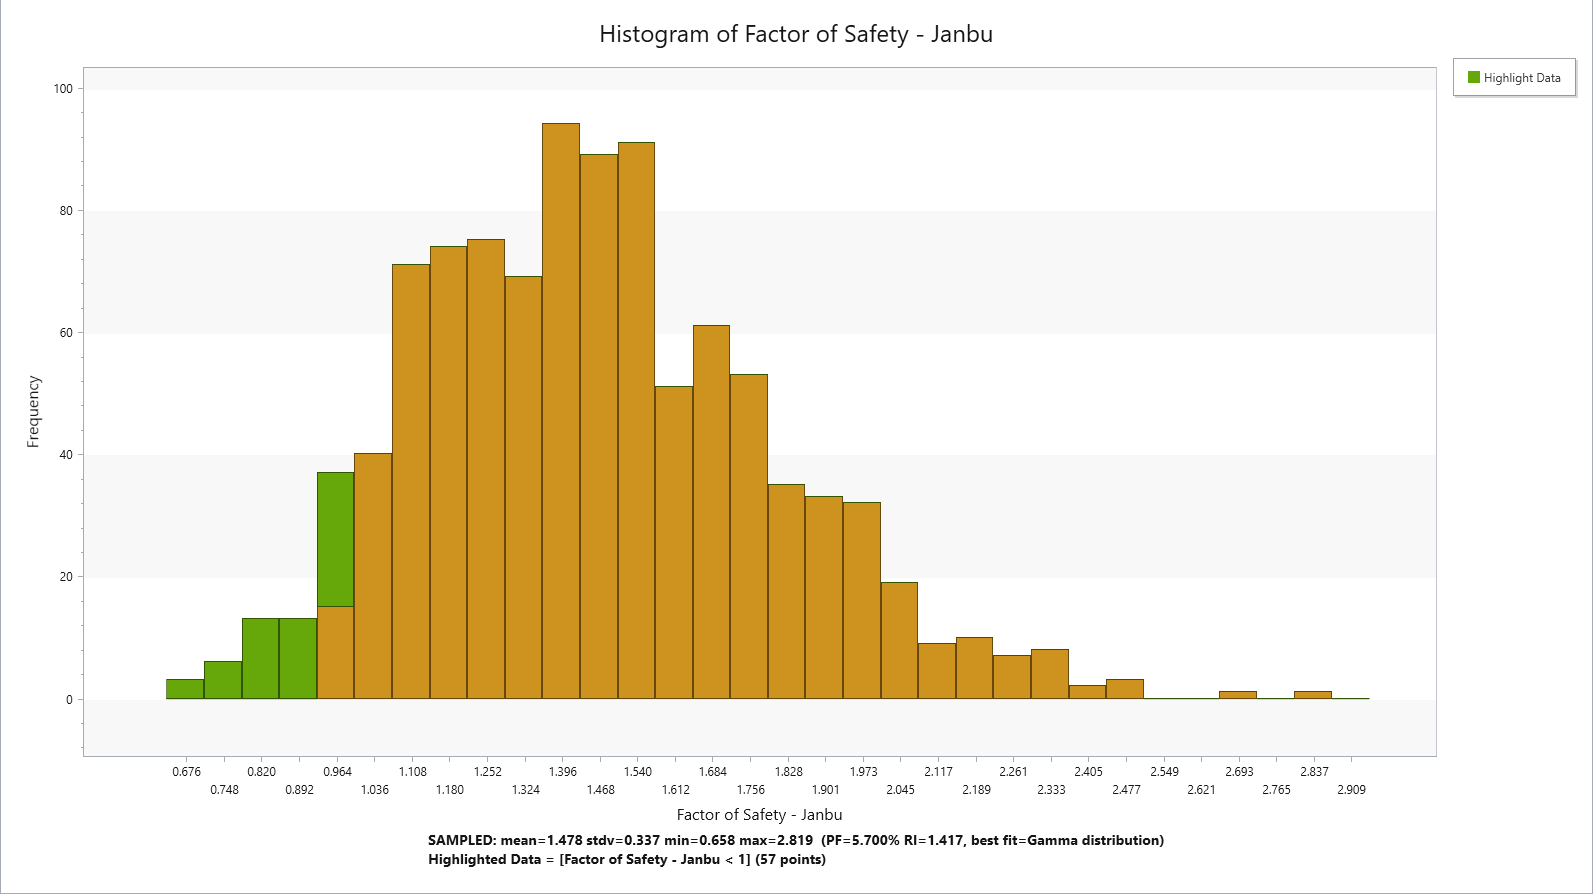
- Select Statistics > Cumulative Plot
- Keep the values as default (number of bins = 30) and select Plot.