Borehole Manager
1.0 Introduction
In Slide3, you can create 3D geometry with borehole data using Borehole Manager. This simple tool allows you to create a 3D geometry with input parameters from the borehole data such as location, soil profile with multiple layers, water table, and orientation of the borehole.
In this tutorial, we will create a 3D multi-layered soil model using a Borehole Manager with water table and investigate the FOS using the model. In addition to the slope stability analysis, seepage analysis can also be performed using water pressure grid import from RS3 which is included as an additional exercise for this tutorial.
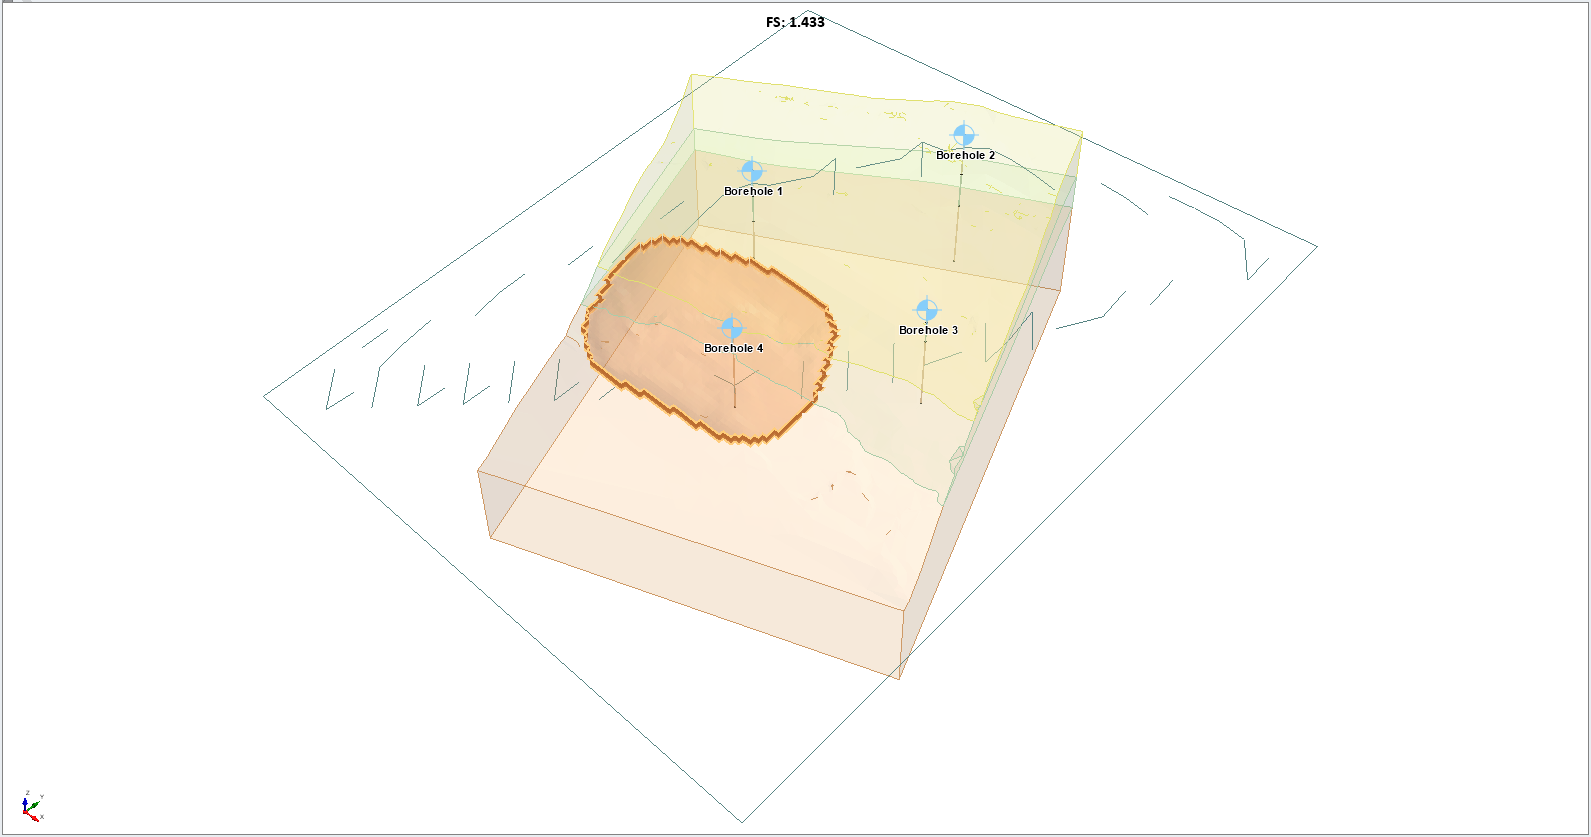
Finished Product:
All tutorial files installed with Slide3 can be accessed by selecting File > Recent > Tutorials folder from the Slide3 main menu.
The finished product of this tutorial can be found in the Borehole Manager_final.Slide3m2 file.
Want to watch a video version of this tutorial? Check it out here:
2.0 Model
2.1 Open Initial File
- Select File > Recent > Tutorials in the menu and open the starting file Borehole Manager_initial.Slide3m2 .
2.2 Project Settings
When you open the initial file, it will have the geometry of the model. We'll check a few things in the project settings and slip surface option before proceeding to next step.
- Select Analysis > Project Settings

- Go to Units and make sure they're in metric, stress as kPa.
- Under Methods, only Spencer should be selected.
- For the Groundwater method, leave the setting as Water Surfaces with a unit weight of 9.81 kN/m3.
- Select OK.
2.3 Surface slip option
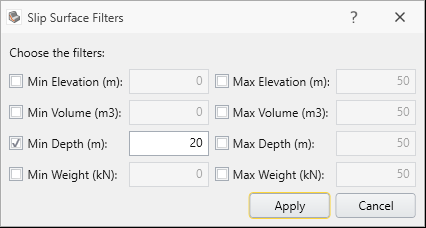
Now we will check the slip surface option settings.
- Select Surfaces > Slip Surface Options

- Under the Filter setting, make sure the minimum depth with 20 m is selected.
Now we will enter our borehole data for this model.
3.0 Enter Borehole data
- Select Material > Borehole Manager
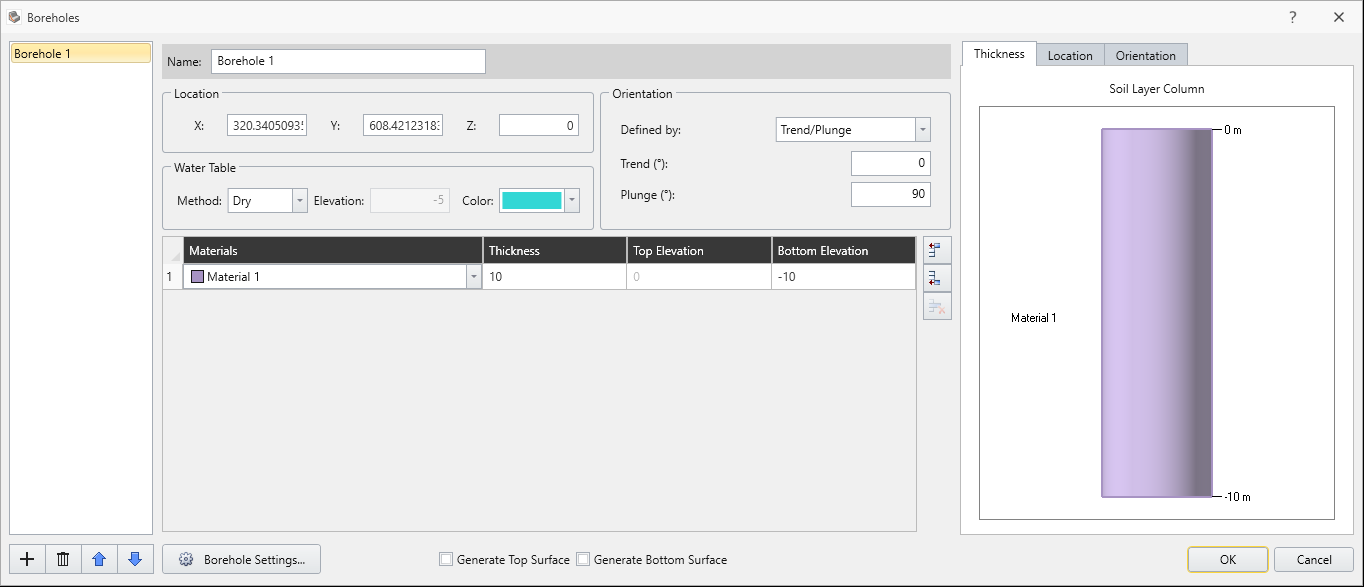
- When you see the boreholes dialog, select the
 add button on left side of the borehole side tree. Add 4 boreholes.
 - Then, within the materials dialog, select the
 insert row below option and you will see the two extra layers on the materials.
 - Assign the first layer to Stratum I (Tn), Second layer to Stratum II (Tm), and the bottom layer as Stratum IIIa (Ta) by clicking the drop-down menu from the materials tab.
- Click Borehole Settings.
- Leave the settings to default: Interpolation to Linear/Triangulation, with a resolution to standard.
Modifying these settings allow users to create smoother/improved interpolation of data points between the boreholes. If you want to see more information on the interpolation/resolution option, refer to Interpolation Method.
Click OK to return to the borehole manager. We will be entering the borehole data into Slide3. Enter the following coordinates of (x,y,z) on location, enter the water elevation, and enter the thickness of each layer according to the table shown.
Borehole Data
X
Y
Z
St1
St2
St3
Water Elevation
BH1
221
663
202
20
30
30
192
BH2
331
757
227
30
25
45
217
BH3
379
650
194
10
15
50
150
BH4
297
573
177
0
5
60
130
For Borehole 1, you should see the following inputs shown here:
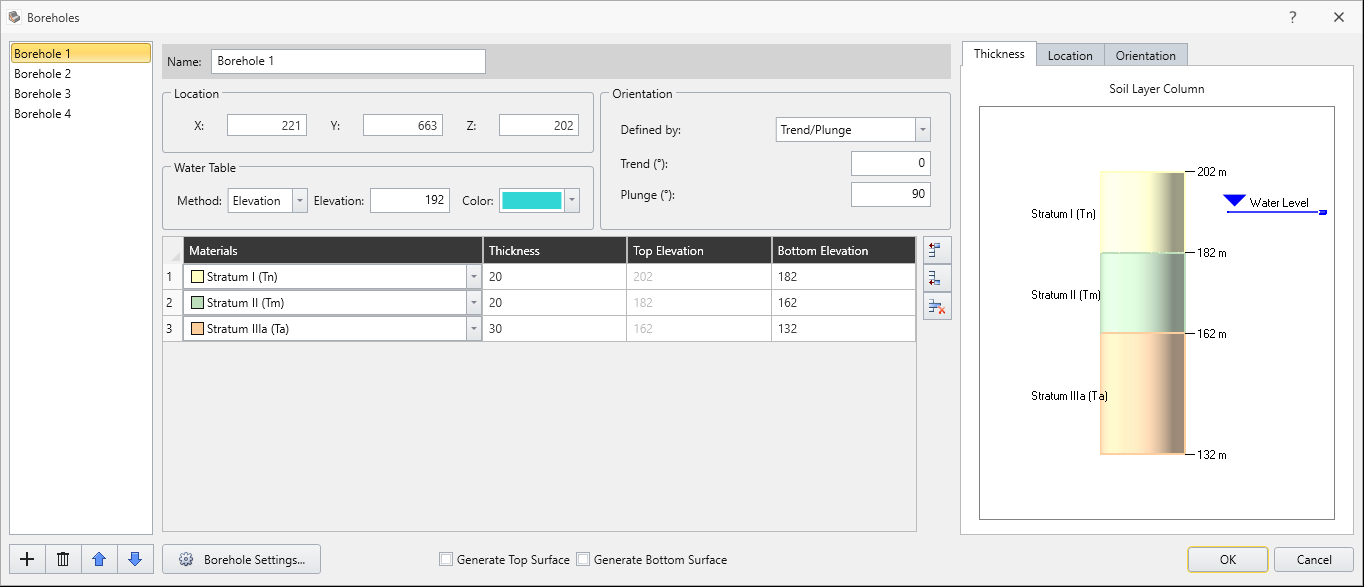
- Make sure the generate top/bottom surface option is not selected. Once the borehole data is entered, select OK.
4.0 Apply Water table
Now we assign water table to the materials.
- Select Groundwater > Assign Water to materials

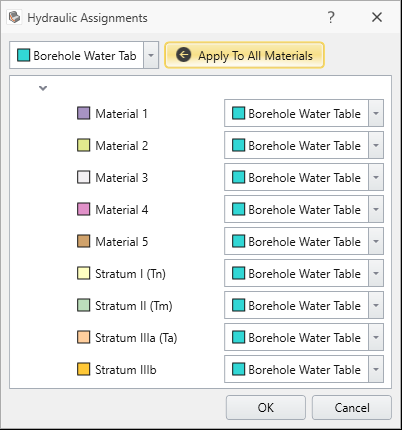
- Select Borehole Water Table under the drop-down menu and select Apply to All Materials.
- Click OK.
5.0 Geometry model creation
Now we will create external volumes of the model with the borehole we've entered.
- Select Geometry > 3D Boolean > Divide All

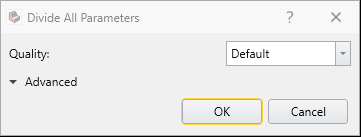
- Select OK with default settings.
6.0 Compute
Now we will compute the model.
- Select Analysis > Compute

You will see the result as shown below with Spencer of approximately 1.448.
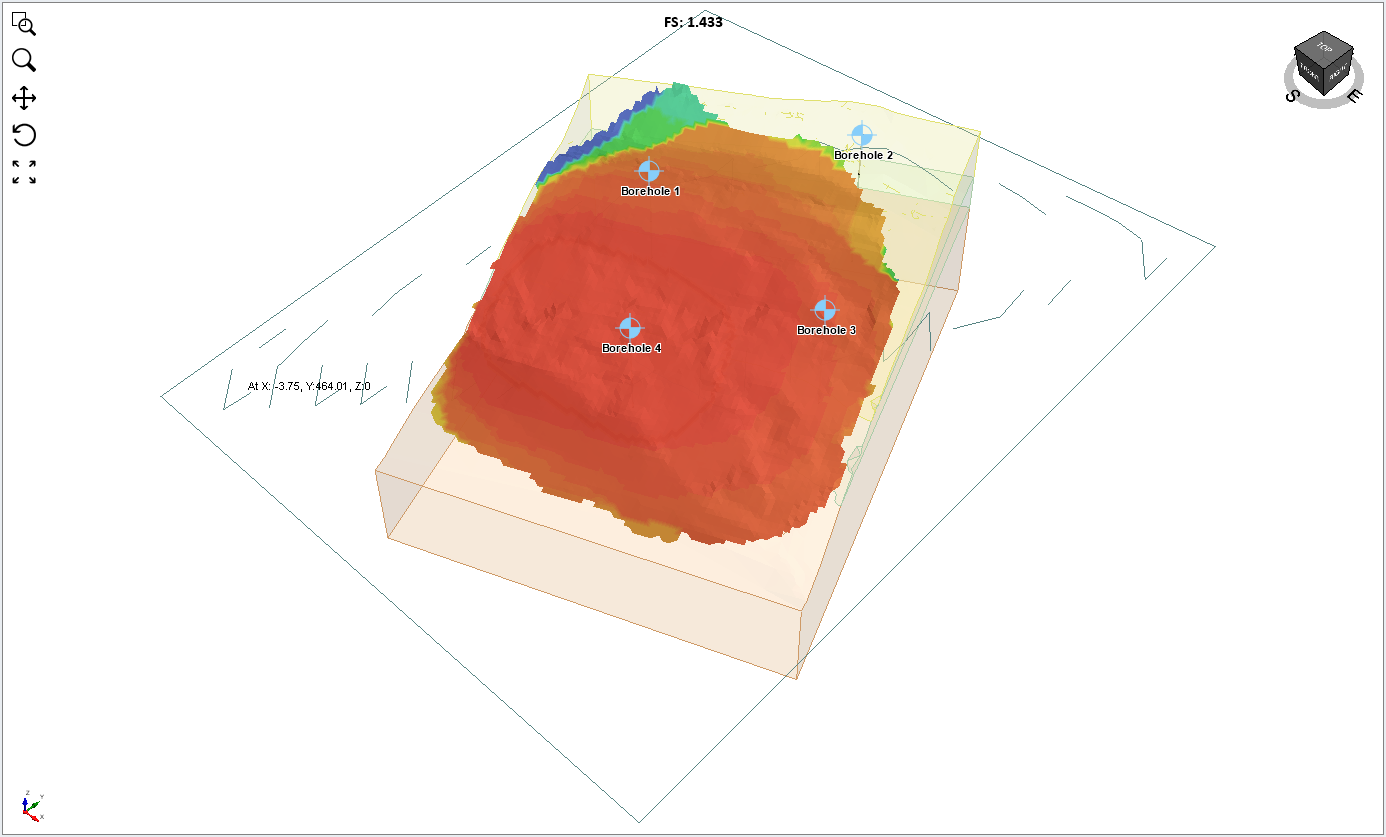
- Select Add surface safety map
 from the toolbar.
You will see the following contour plot of the hot (more critical) to cold (less critical) region of the slope.
- Select File > Save

This concludes the Borehole Manager tutorial in Slide3.