Importing Monitoring Data
1.0 Introduction
This tutorial will demonstrate how to view IDS Radar Data and will provide an example where the imported IDS Radar Data can be used to validate the results of Slide3.
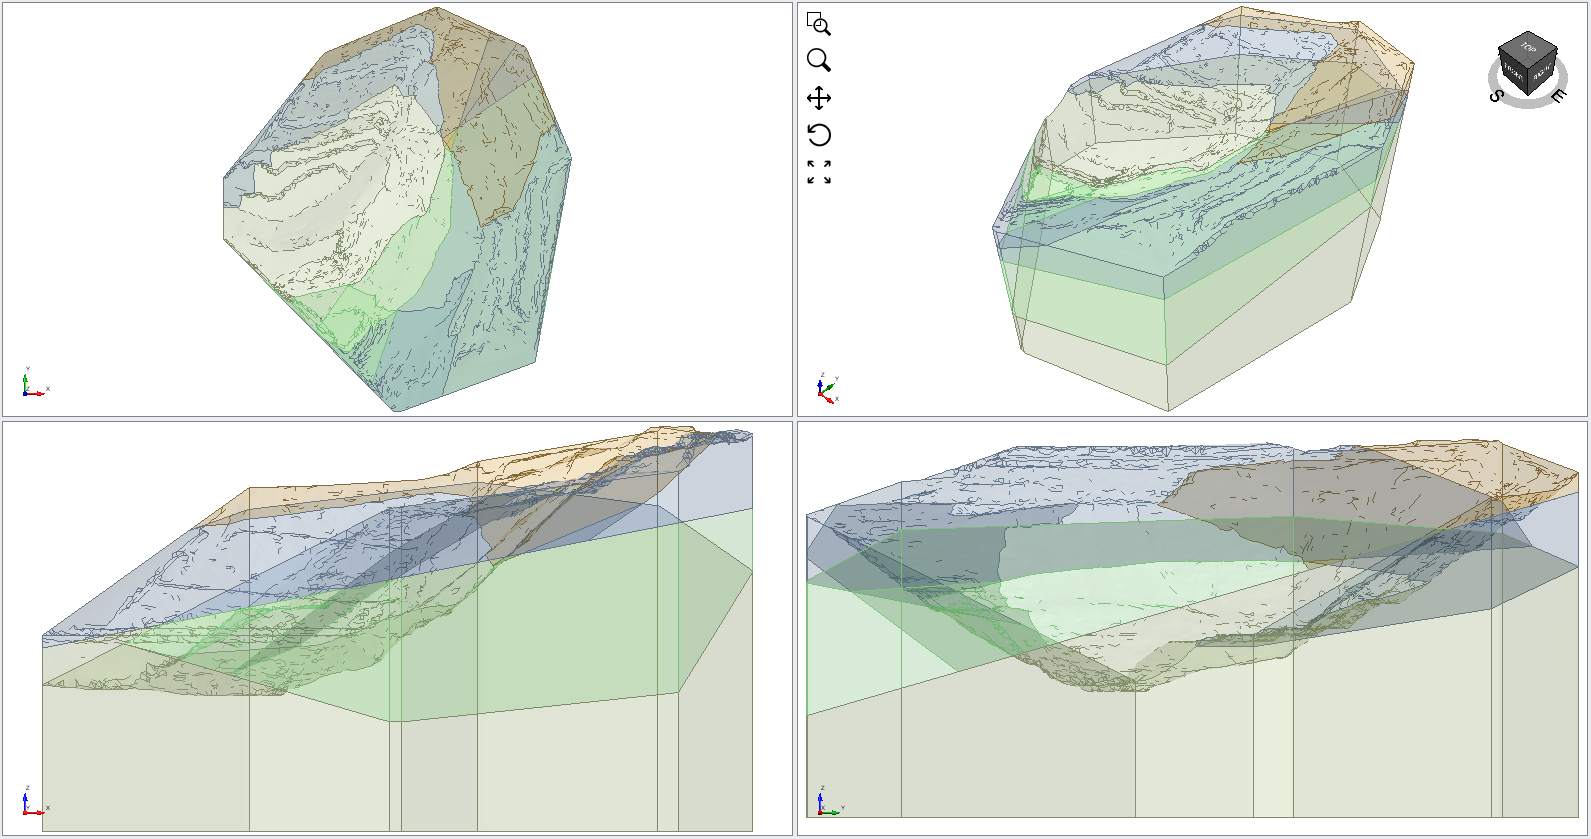
2.0 Open Slide3 Model
- Select File > Recent > Tutorials and read in the file IDS - Starting File from the installation folder.
3.0 Results
- Select Analysis > Compute

- Select the Results tab
 to view the failure surface on the model.
 - Turn on the contours by selecting the Show Contours
 option on the toolbar. The model should look as follows with the Janbu safety factor close to 1.00.
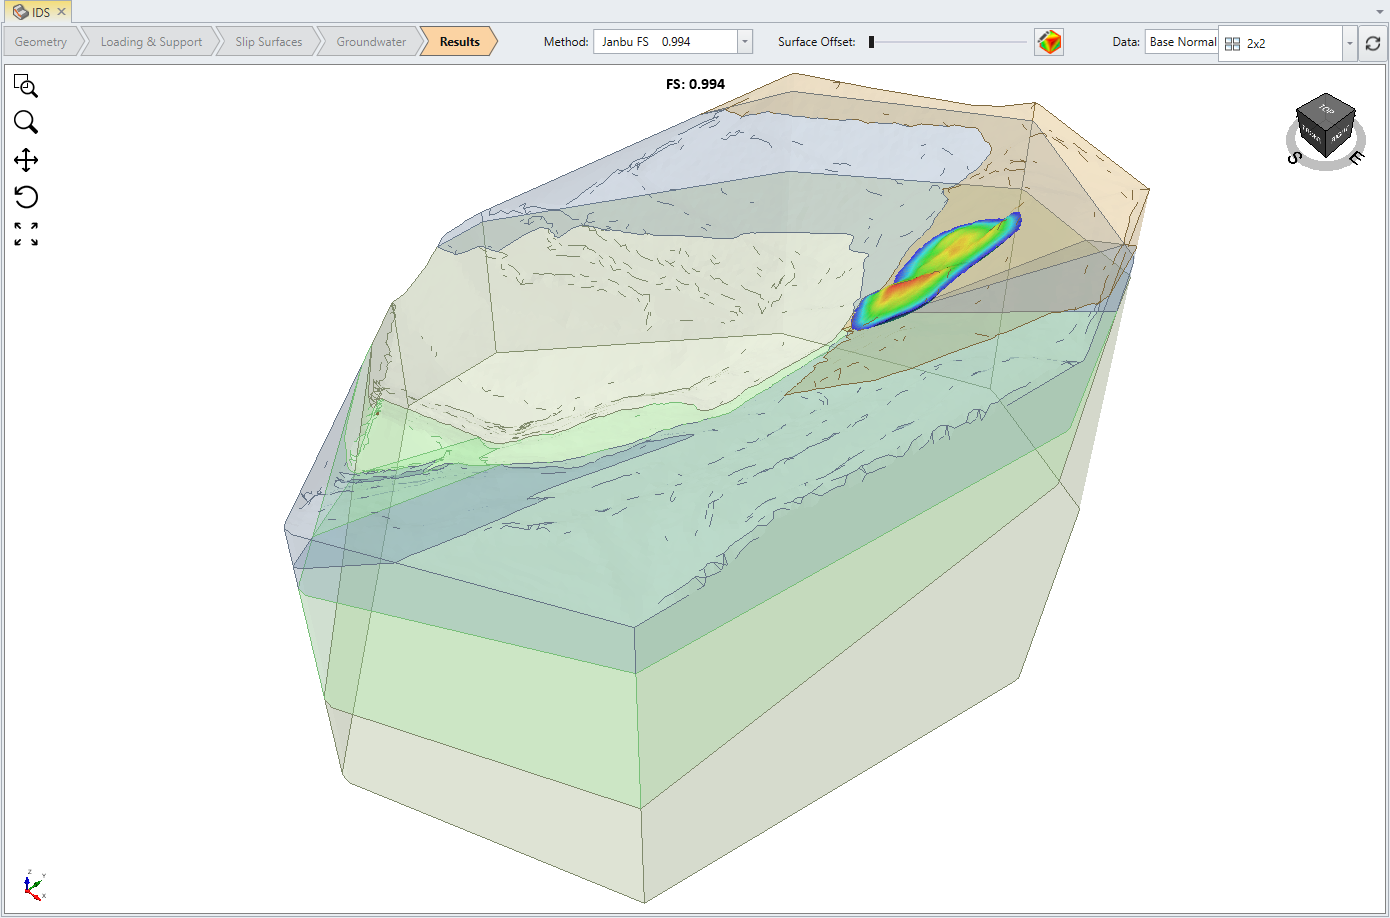
4.0 Import IDS Radar Data
- Select Interpret > Import Sensor Data > Import IDS Radar Data and select the file Bagdad_Displacement Map Twentieth_from_12_Nov_05-05_34_to_12_Nov_06-05_35 from the installation included in the Tutorials folder.
- Notice that the imported surface matches the surface of the model. Click OK to import the data set.
- In the filter value group in the top right, drag the right slider until the surface is reduced to only points with significant displacement.
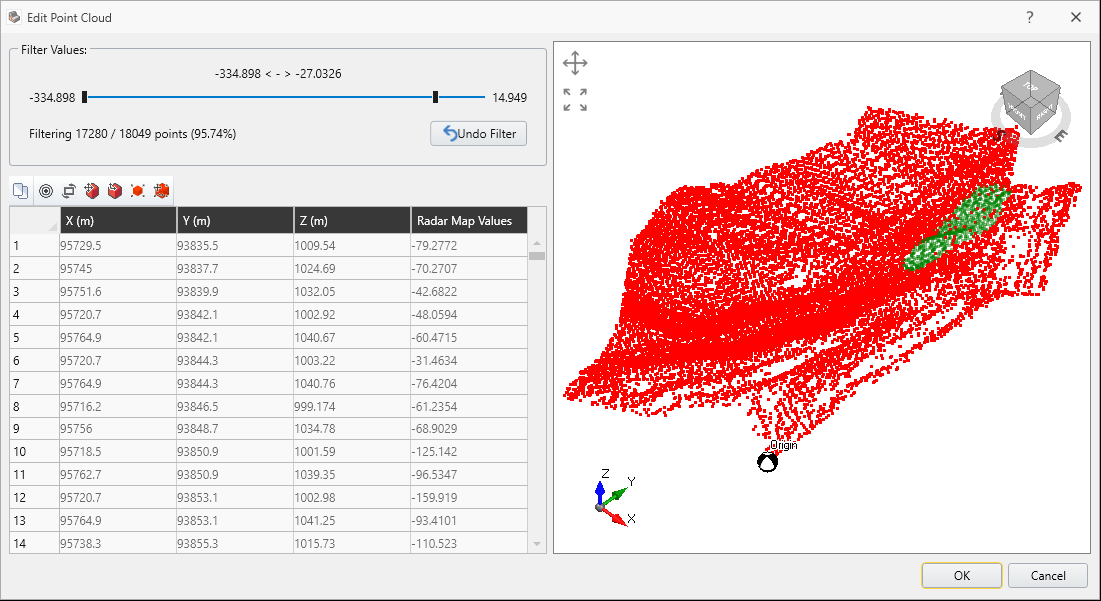
- Select OK and the surface will be imported.
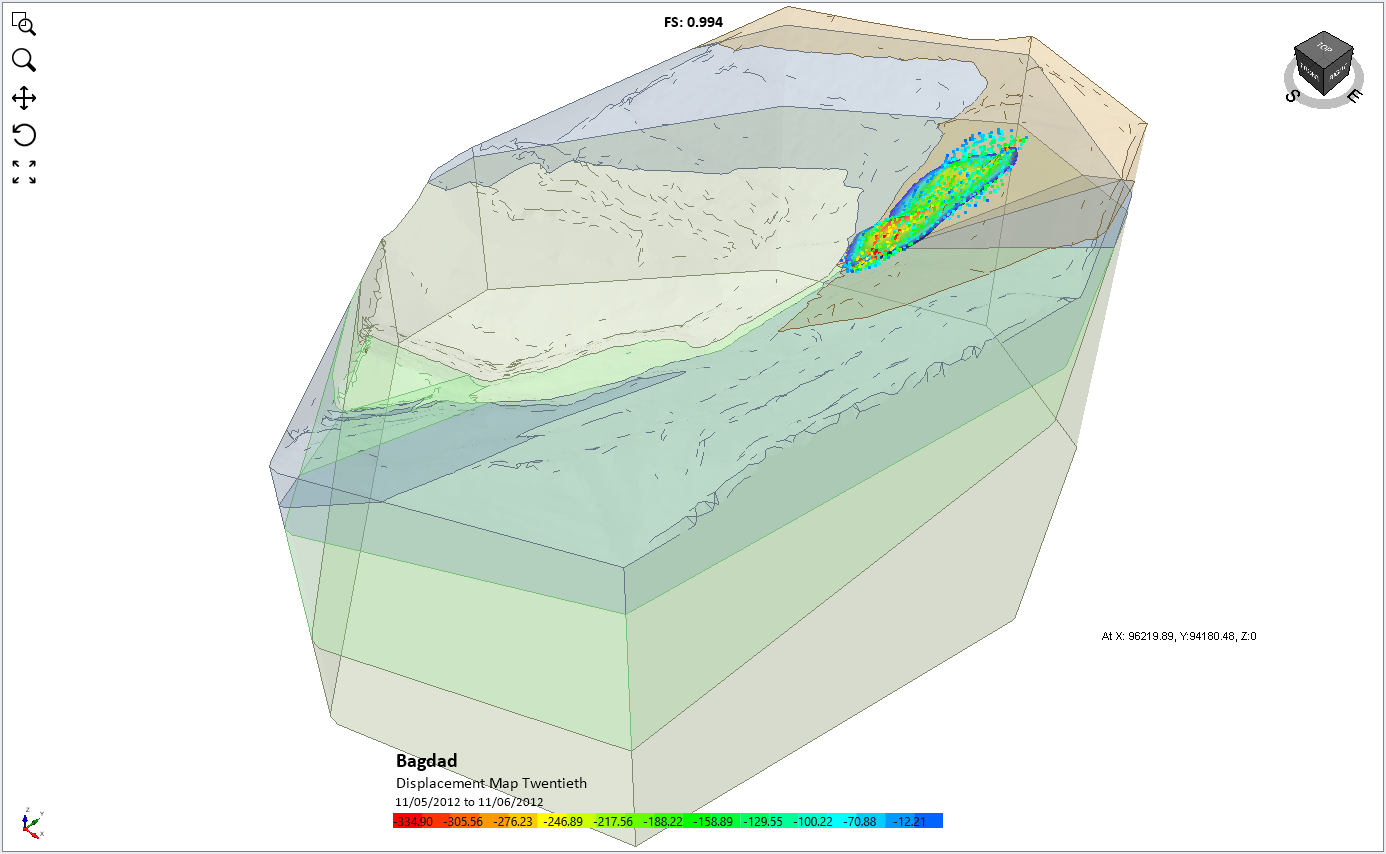
- It is already clear that there is a significant overlap between the greatest displacements measured and the failure surface predicted by Slide3. Offset the failure surface slightly to more clearly see this overlap.
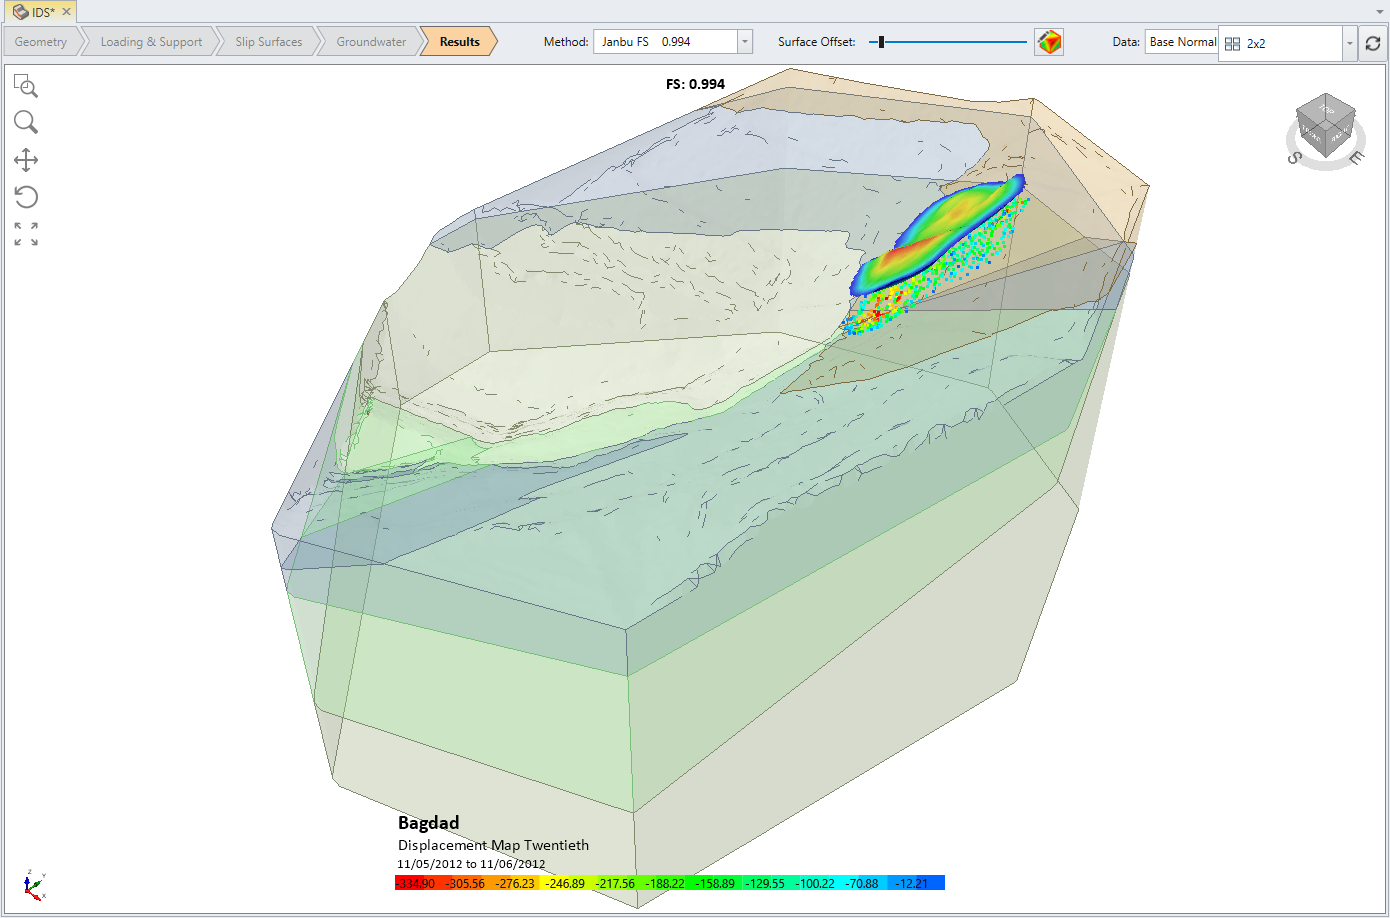
Notice how closely the Hot sections of the imported surface match the results from Slide3. This shows a very close match between the predicted surface from Slide3 and measured results.
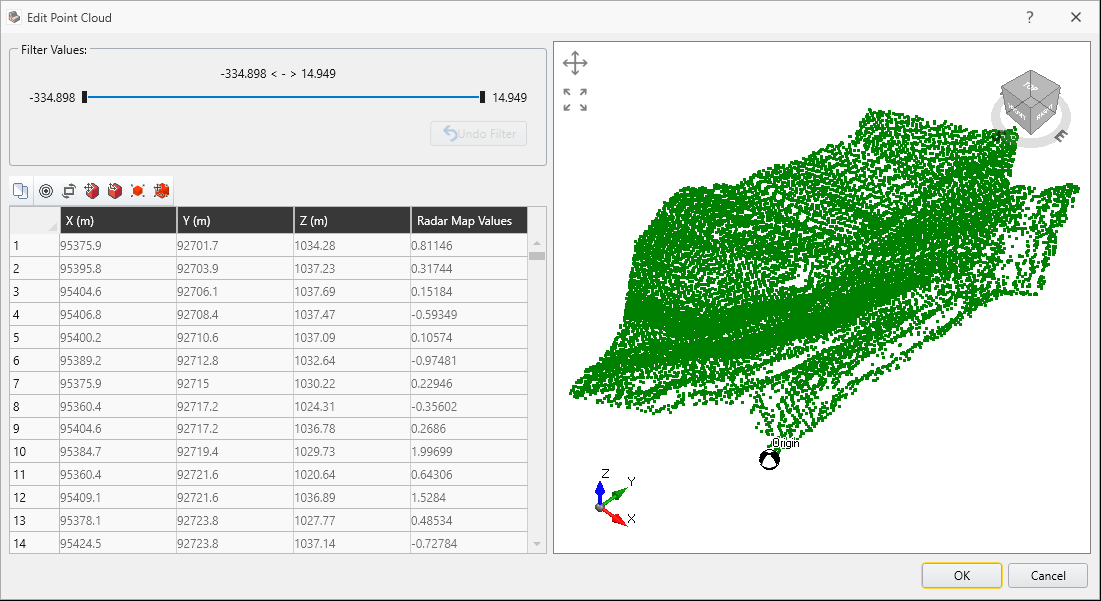
Despite importing the whole data set, we are only truly interested in the small hot region of the contours. In this case, this is the region with the most negative displacement. We can apply a filter to remove the points with the small displacements from the set.
If you wish to change the appearance of the imported surface, there are a variety of options available in the bottom left Properties pane when you select the imported surface (last item) from the Visibility pane.
This concludes the Import Monitoring Data to Slide3 (IDS GeoRadar) tutorial.