Import 3D Pore Water Pressure Grid
1.0 Introduction
It is of great importance to know the effects of pore water pressure on the stability of slopes. A 3D finite element seepage analysis can be conducted in RS3, and the results of the analysis can be used to obtain pore pressure contours on critical failure surfaces. In this tutorial we will import pore water pressure data from RS3 to perform a slope stability analysis in Slide3.
2.0 Export Pore Water Pressure Data from RS3
After computing a groundwater seepage analysis in RS3, the pore pressure results can be exported to a pore water pressure file which can be read by Slide3. This is done in RS3 by selecting File > Export > Export Pore Water Pressure to Slide3. This will extract pore water pressure data to a comma separated text file.
3.0 Open Slide3 Model
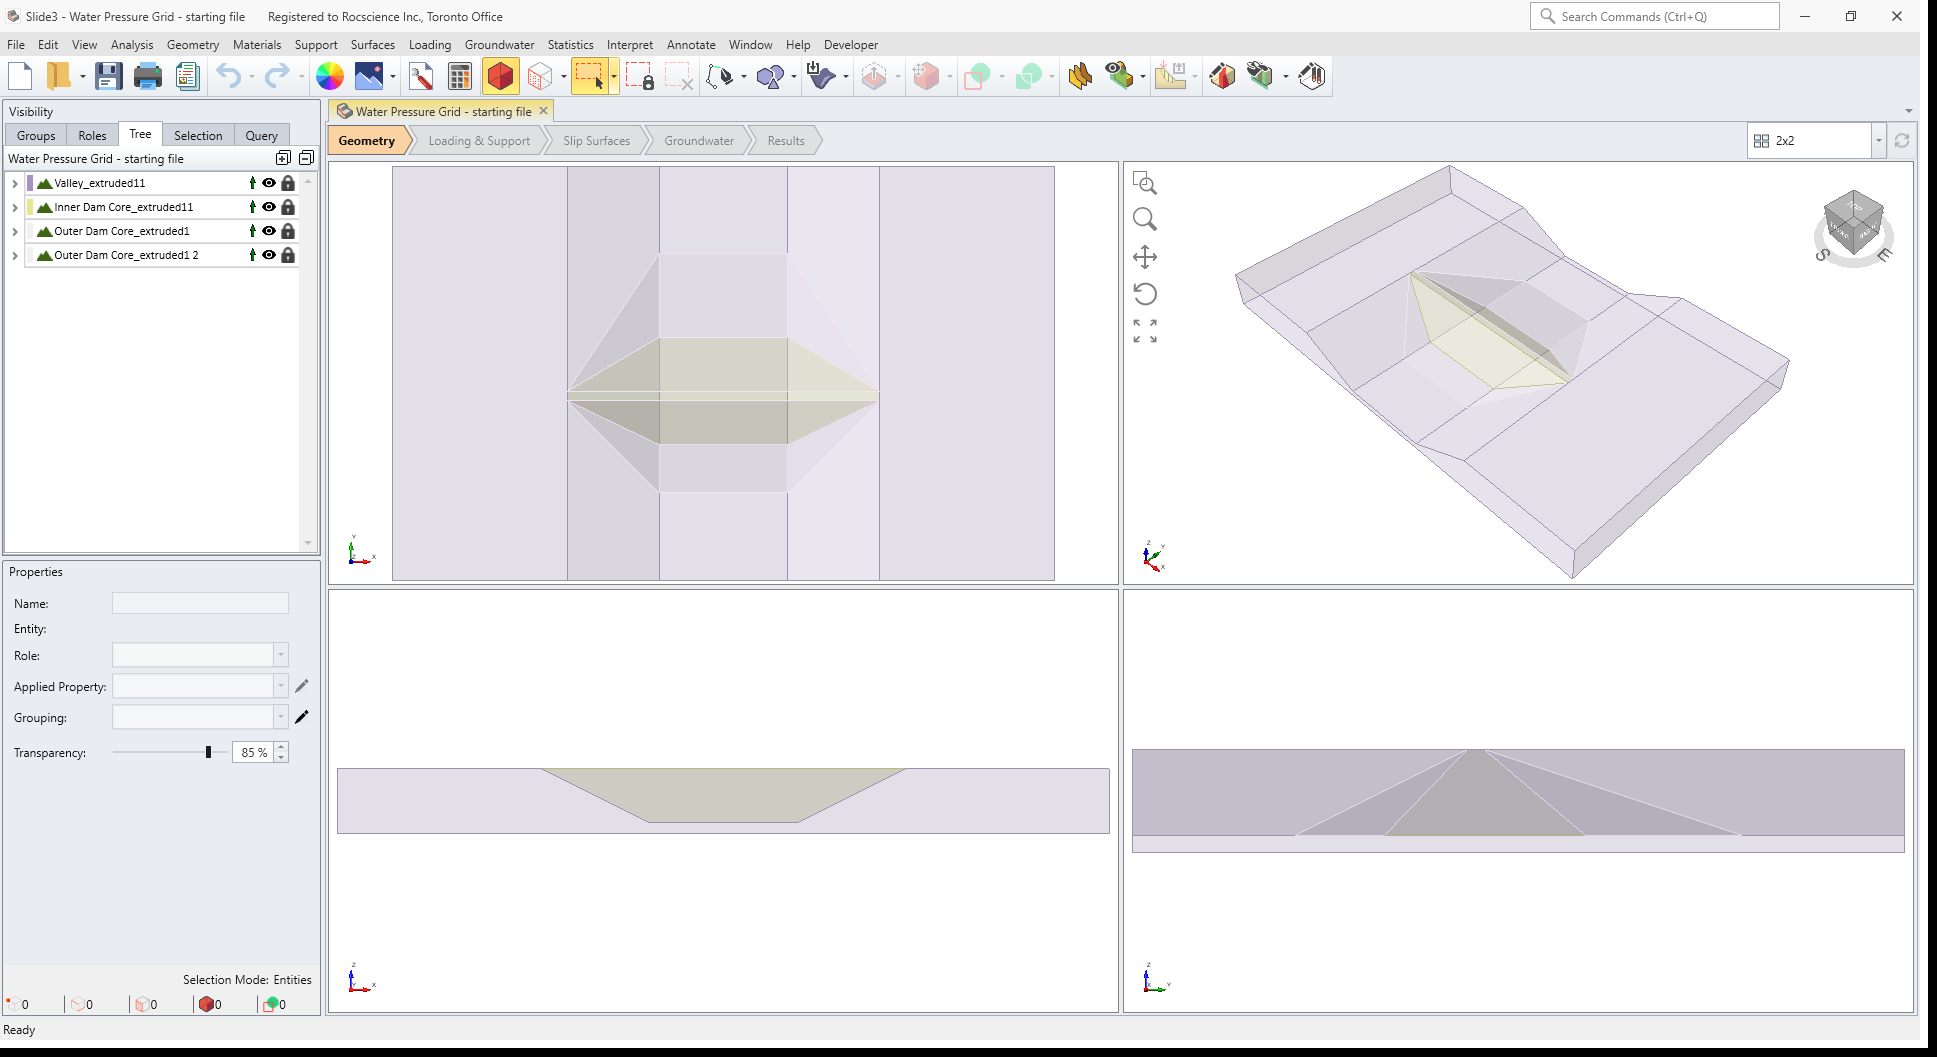
- From the Slide3 main menu, select File > Recent > Tutorials and open the file Water Pressure Grid – starting file.
This file has the relevant project settings and material properties.
3.1 Project Settings in Slide3
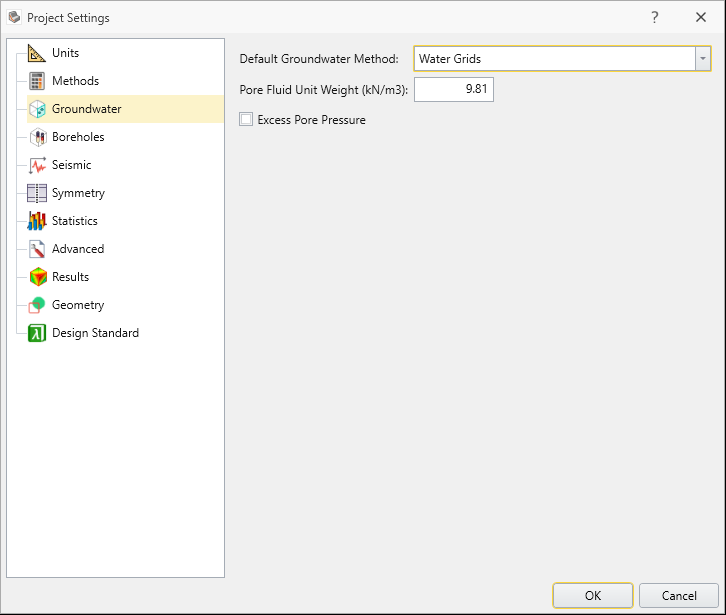
- Select Analysis > Project Settings

- In Project Settings, select Groundwater and make sure that the Default Groundwater Method = Water Grids then click OK.
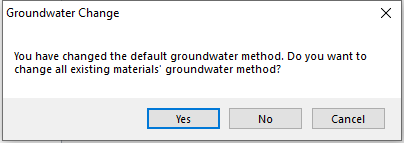
- Select Yes.
You will be prompted with this Groundwater change message.
3.2 Import Pore Water Pressure data to Slide3
We will now proceed to import the pwp3 file:
- Select Groundwater > Add Water Pressure Grid or select Add Water Pressure Grid
 from the toolbar. You will see the following dialog:
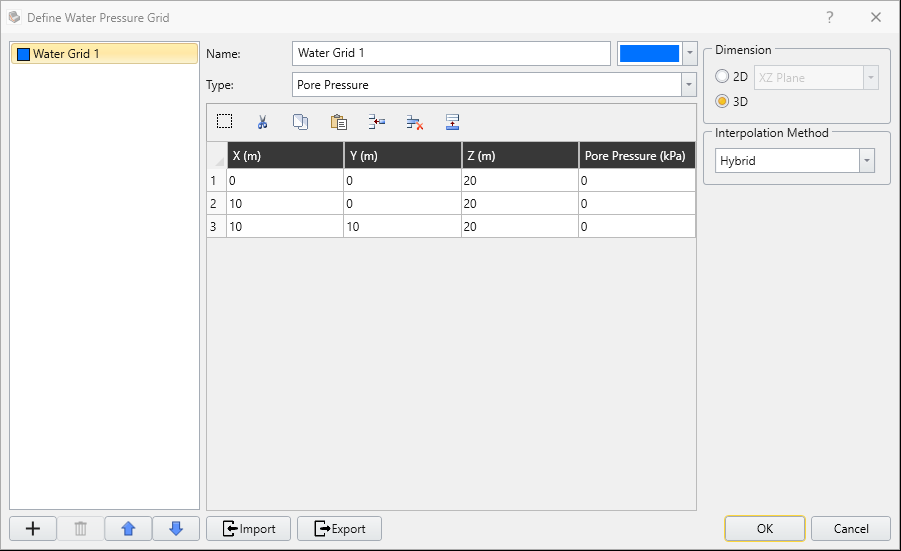
- Select the Import button. Change the open file type to PWP Files (*.PWP, PWP3).
- Open the file water pressure grid.pwp3 which you should find in the Water Pressure Grid - starting file folder. This file was created by exporting the results of a seepage analysis from RS3. When you import the file you will first see an Import CSV file dialog.
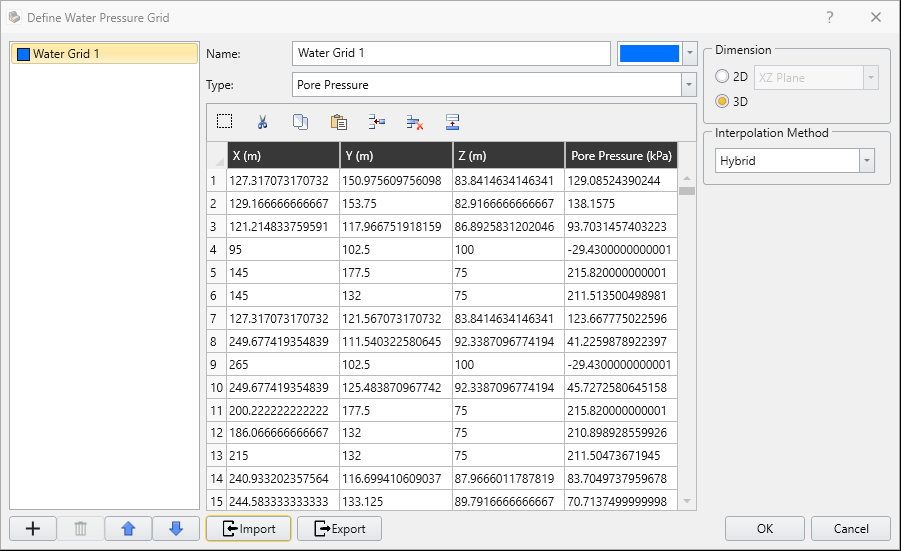
- Select OK and the data should appear in the Water Pressure Grid dialog.
- Select OK again. Then, the menu to assign Water Grid to materials will pop up as sown below:
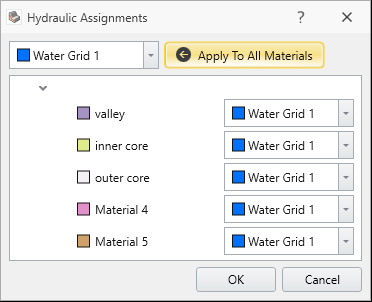
- In the dialog, select Water Grid 1, select Apply to All Materials, then click OK.
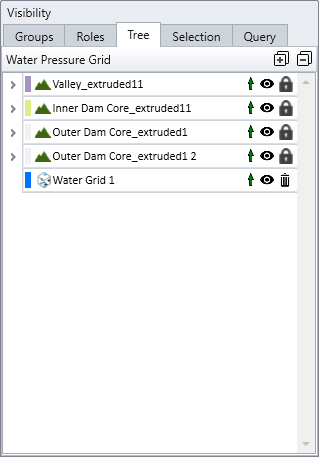
you should see the water pressure grid displayed as a grid of blue points on the model.
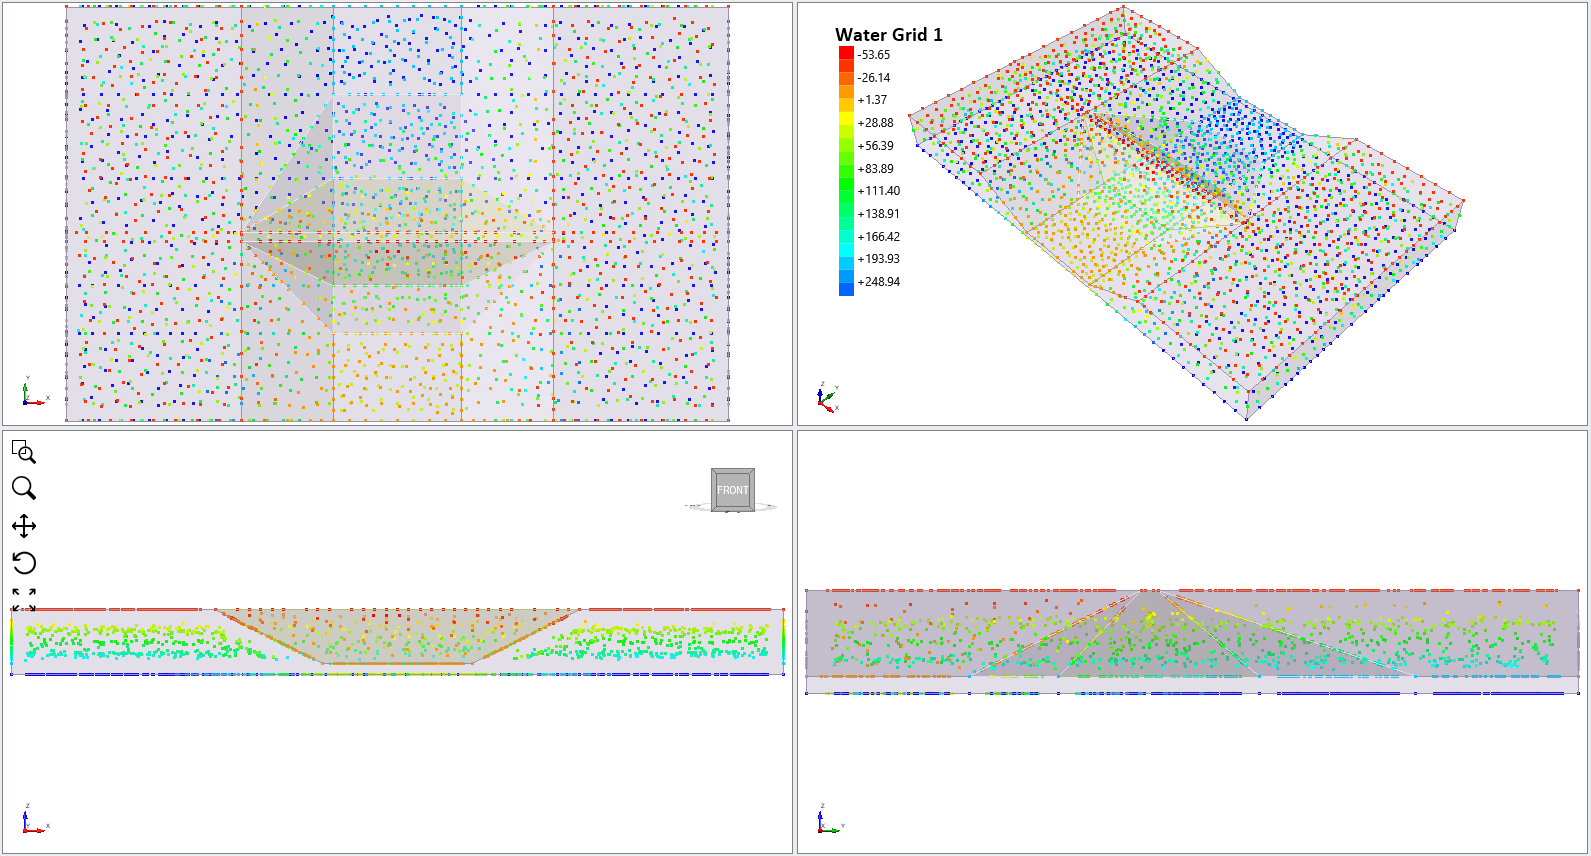
Water Grid 1 should be added to the Visibility Pane in the model as shown below.
4.0 Define Ponded Water Load
A Water Pressure Grid in Slide3 defines groundwater pore pressure, but does not simulate the weight (hydrostatic force) of ponded water against the upstream face of the dam. To simulate this we must define a water table as following to create the ponded water load.
4.1 Draw Polyline
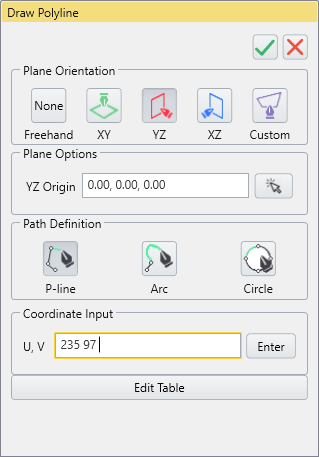
- Select Geometry > Polyline Tools > Draw Polyline

- In the sidebar select the YZ plane
 orientation button.
 - The coordinates you need to input for U,V are [111.5, 97], and [235, 97].
- Make sure you press [Enter] between each pair. Click the blue checkmark
 to close the pane.
 - Next, select Polyline in the visibility pane.
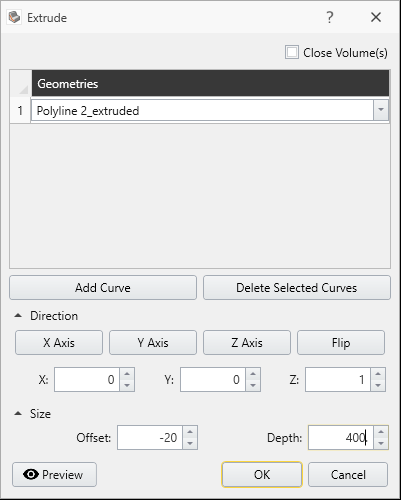
- Select Geometry > Extrude/Sweep/Loft tools > Extrude

- An Extrude Geometry dialog will appear. Enter Direction (x,y,z) = (1,0,0), Offset = -20 and Depth = 400 as shown below. When you are done, click OK.
Let's finish defining the ponded water load by following the next step.
4.2 Add Water Surface
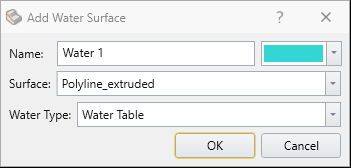
- Select Groundwater > Add Water Surface

- In the dialog, select Surface = Polyline1_extruded as shown below. Click OK.
- The Hydraulic Assignments dialog should open. Make sure you select Cancel in this dialog since we would like the Water Grid to be used for pore pressure calculations in the soil. The Water Surface will be used to only calculate the ponded water load above the ground surface.
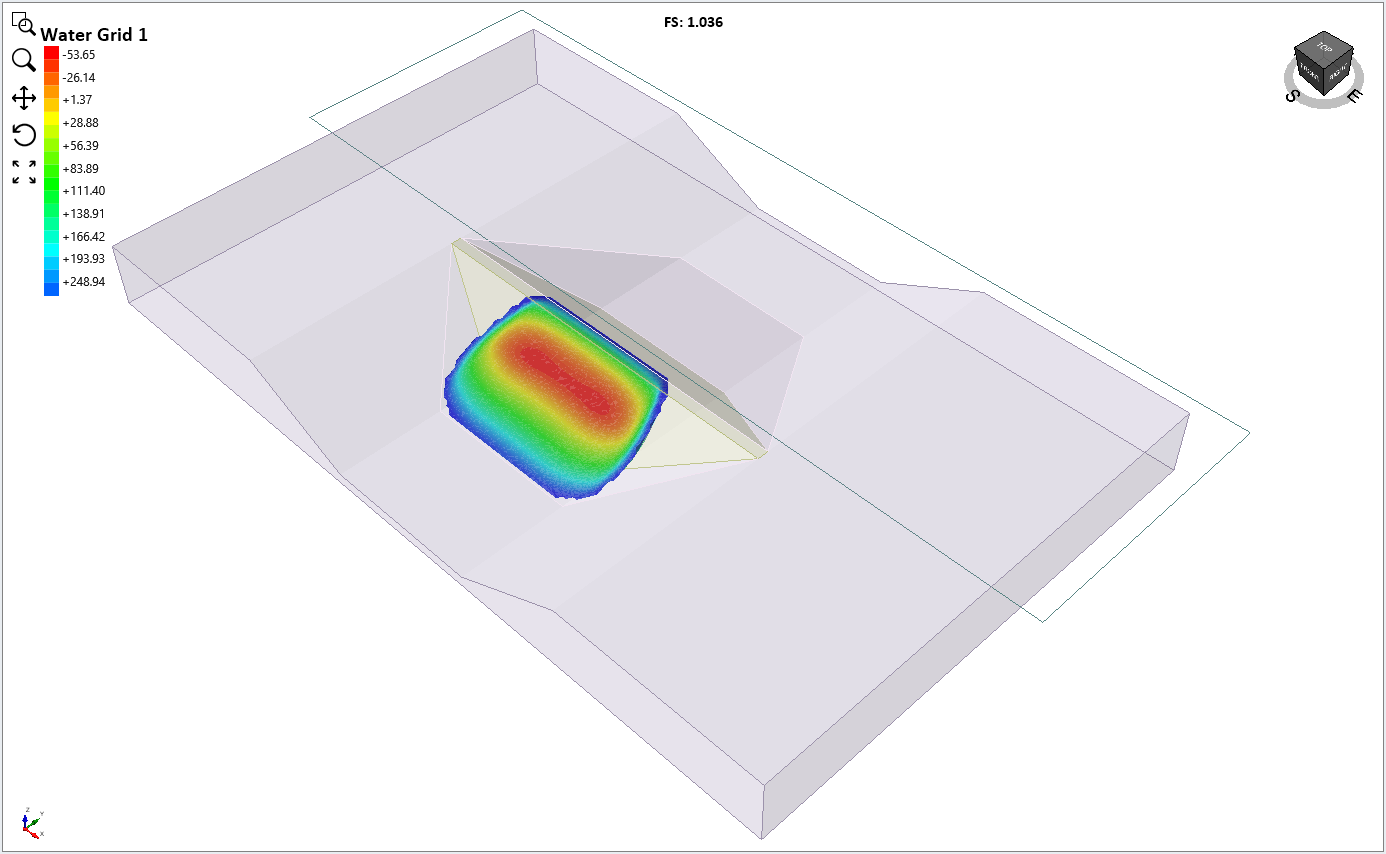
5.0 Results

- Save the file and select Analysis > Compute

- Select the Results workflow tab to view the results, and click Show Contours
 in the toolbar.
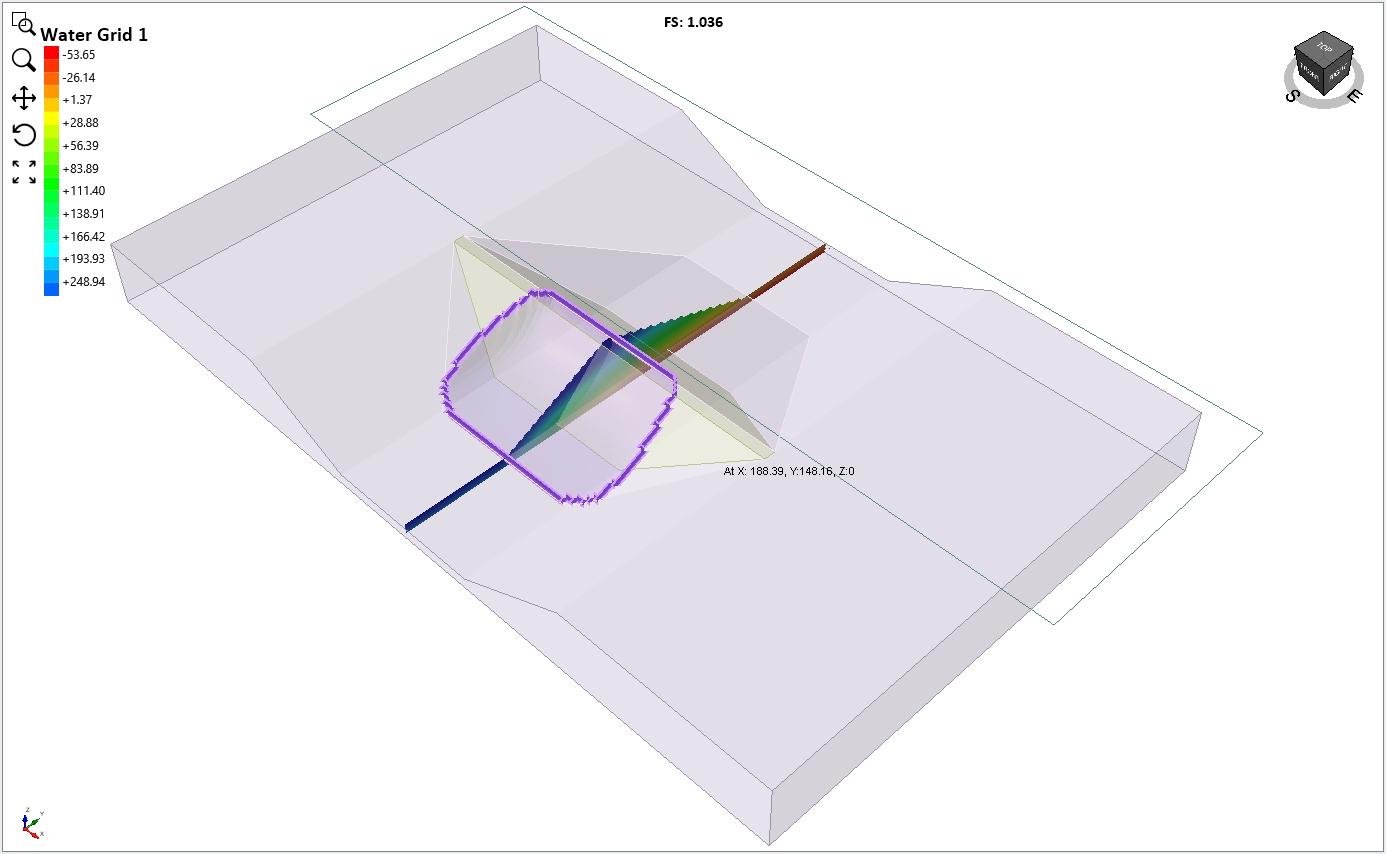
The Global Minimum slip surface for the Janbu analysis will be displayed. The safety factor for the Janbu surface is about 1.
By default you will see Base Normal Stress contours (i.e. the normal stress on the base of the columns).
5.1 Contour Pore Pressure
- Select the Show Data on YZ Plane
 option from the toolbar or the Interpret > Show Data on Plane > YZ menu.
 - Change the Data Type to Pore Water Pressure as shown below:
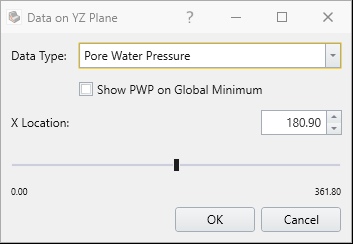
Then, you can see the actual pore water pressure contours interpolated from the pore pressure grid which we imported.