Slope-Wide Graphs Overview
These graphs are plots of the entire analysis area. The horizontal axis is always the x-coordinate of the slope. The vertical axis depends on the graph you choose. See the following topics for more information:
- Endpoint Locations
- Bounce Height
- Total Kinetic Energy
- Translational Kinetic Energy
- Rotational Kinetic Energy
- Translational Velocity
- Rotational Velocity
- Block Mass
- Block Volume
Slope-wide graphs are plotted against an outline of the slope.
Note regarding all Slope-wide Graphs (except Endpoint Locations Graph):
The horizontal axis of each slope-wide graph is the x-coordinate of the slope and the result of interest is plotted on the vertical axis. On the vertical axis you can plot from one value up to 5 values from below:
- Up to 3 user-defined percentile values,
- Maximum value (this results in an envelope graph), and/or
- Mean value.
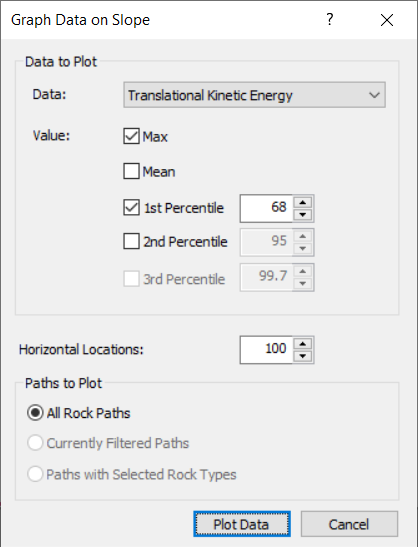
The location of each vertex on the graph (where the data is sampled) is determined by the number of Horizontal Locations. The width of each bin is calculated by dividing the width of the slope (maximum x-coordinate – minimum x-coordinate of the slope) by the number of Horizontal Locations (a.k.a. intervals, divisions). You specify the number of Horizontal Locations used to create the graph in the Graph Data on Slope dialog before you plot the graph.
- The number of Horizontal Locations cannot be changed in the Chart Properties dialog. Make sure you specify the appropriate number of Horizontal Locations in the Graph Data on Slope dialog.
- If the graph appears to be "blocky" or changes considerably when more falling rocks are analyzed, you should probably increase the number of sampling intervals (Horizontal Locations).
Underlying Slope and Seeders in the Graph
Display the slope geometry and/or seeder start locations on the same graph using the Show Slope and Show Seeder options. The secondary vertical axis is the y-coordinate of the slope.
SHOW SLOPE
To show the slope in the same graph, select Show Slope ![]() from the toolbar.
from the toolbar.
SHOW SEEDER LOCATION
To show the seeder start positions in the same graph, select Show Seeder Location ![]() from the toolbar.
from the toolbar.
Toggling Options
When only one value is plotted, you can choose to distinguish between different end reasons, seeders, rock types and rock shapes. Only one toggle can be activated at a time.