Endpoint Locations
Select from one of three Data to Plot on the horizontal axis:
- Endpoint Location
- Endpoint Distance From
- Runout Distance
Select from one of two Value types to plot on the vertical axis:
- Number of Rocks
- Percent of Rocks
Rock Endpoint Location
To plot endpoint location:
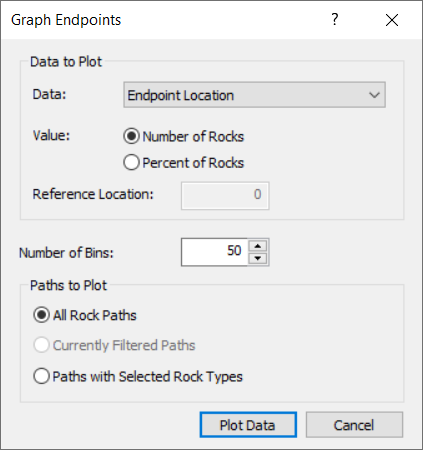
- Select Graph Endpoints
 from the Graphs menu or from the toolbar.
 - The Graph Endpoints dialog will appear.
- Select Endpoint Location as the Data to Plot using the Data drop-down menu.
- Select the Value to plot: Number of Rocks, or Percent of Rocks.
- Specify the number of Horizontal Locations used to create the graph.
- Select the Paths to Plot using the drop-down menu. Choose from All Rock Paths or Paths with Selected Rocks.
- If you opted to plot Paths with Selected Rocks, choose the seeder you want to plot.
- Click Plot Data.
The horizontal axis of the Distribution of Rock Path End Locations graph is the x-coordinate of the slope. The vertical axis is the number of rocks or percent of total rocks that ended in the bin at that location.
The width of each bin is calculated by dividing the width of the slope (maximum x-coordinate – minimum x-coordinate of the slope) by the number of bins ( a.k.a. intervals, divisions). You can change the number of bins used to create the graph in the Chart Properties dialog. The Chart Properties dialog is available from the right-click menu in the Endpoints Graph view.
Rock Endpoint Distance From
To plot endpoint distance from:
- Select Graph Endpoints from the Graphs menu or from the toolbar.
- The Graph Endpoints dialog will appear.
- Select Endpoint Distance From as the Data to Plot using the Data drop-down menu.
- Specify the Reference Location from which the endpoint distance is measured relative to.
- Select the Value to plot: Number of Rocks, or Percent of Rocks.
- Specify the number of Horizontal Locations used to create the graph.
- Select the Paths to Plot using the drop-down menu. Choose from All Rock Paths or Paths with Selected Rocks.
- If you opted to plot Paths with Selected Rocks, choose the seeder you want to plot.
- Click Plot Data.
The horizontal axis of the Distribution of Rock Path End Locations graph is the horizontal distance from the Reference Location (x-coordinate) specified in the Graph Endpoints dialog. The vertical axis is the number of rocks or percent of total rocks that ended in the bin at that distance.
Rock Runout Distance
To plot runout distance:
- Select Graph Endpoints from the Graphs menu or from the toolbar.
- The Graph Endpoints dialog will appear.
- Select Runout Distance as the Data to Plot using the Data drop-down menu.
- Select the Value to plot: Number of Rocks, or Percent of Rocks.
- Specify the number of Horizontal Locations used to create the graph.
- Select the Paths to Plot using the drop-down menu. Choose from All Rock Paths or Paths with Selected Rocks.
- If you opted to plot Paths with Selected Rocks, choose the seeder you want to plot.
- Click Plot Data.
The horizontal axis of the Distribution of Rock Path End Locations graph is the horizontal distance from the starting position of the rock (x-coordinate). The vertical axis is the number of rocks or percent of total rocks that ended in the bin at that distance.