Density Histogram
After computing your results, EX3 has a Density Histogram feature that allows you to adjust the point range of your contours and highlight areas of interest in your model. The tool makes it easier for users to see the details of specific contours they wish to view.
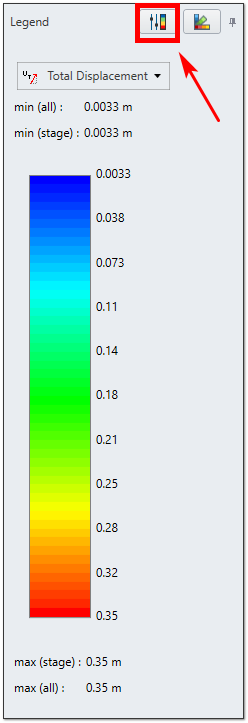
The  Density Histogram button is located in the Contour Legend on the right side of the screen.
HOW TO CHANGE THE POINT RANGE
- Toggle the Density Histogram button on and off and adjust the point range.
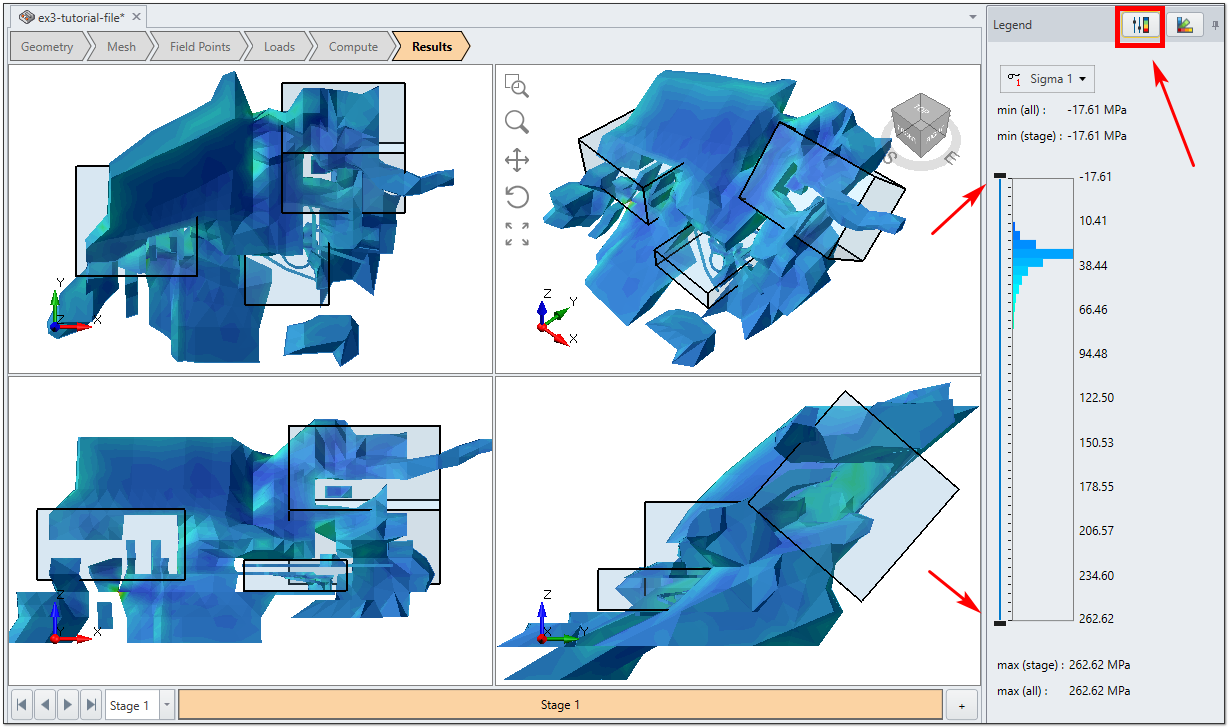
Figure 1 - Sigma 1 results with original contour point range - As shown in Figure 2, you can use your mouse to drag the sliders and set your desired point range. The contours on the model will automatically adjust.
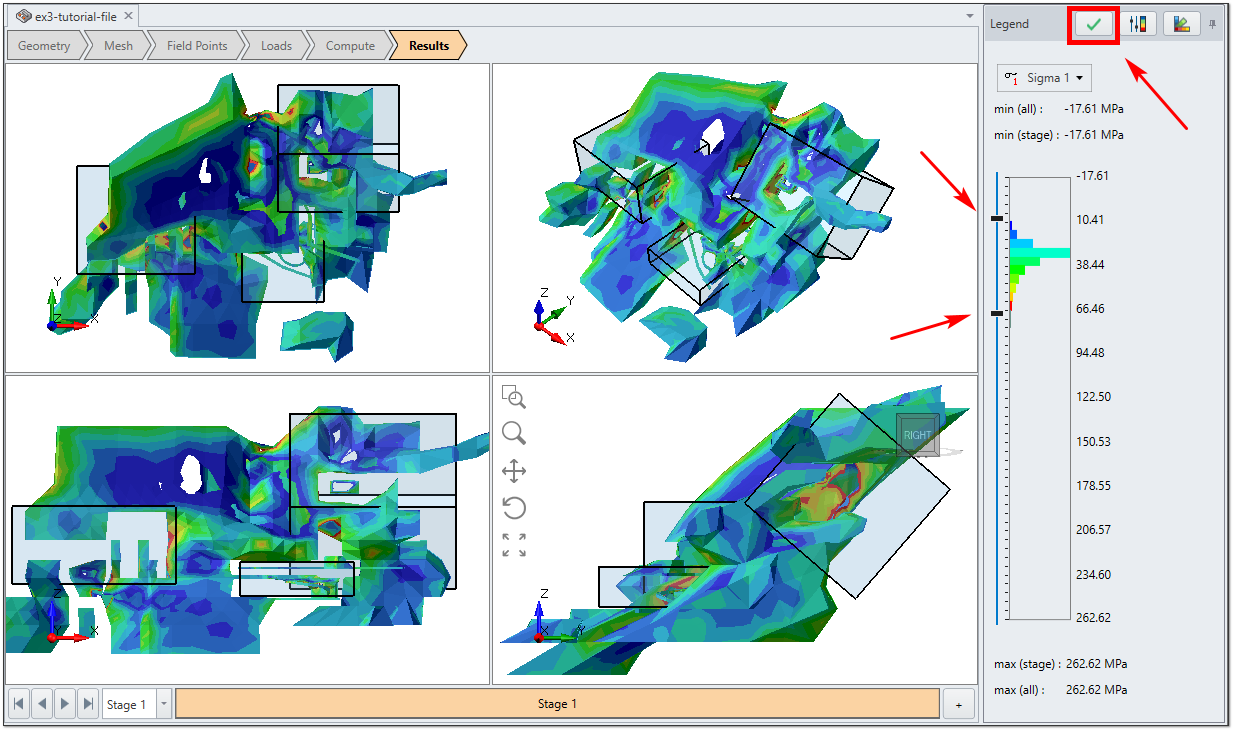
- When you have set the sliders to the desired point range, click on the
 Check mark button.
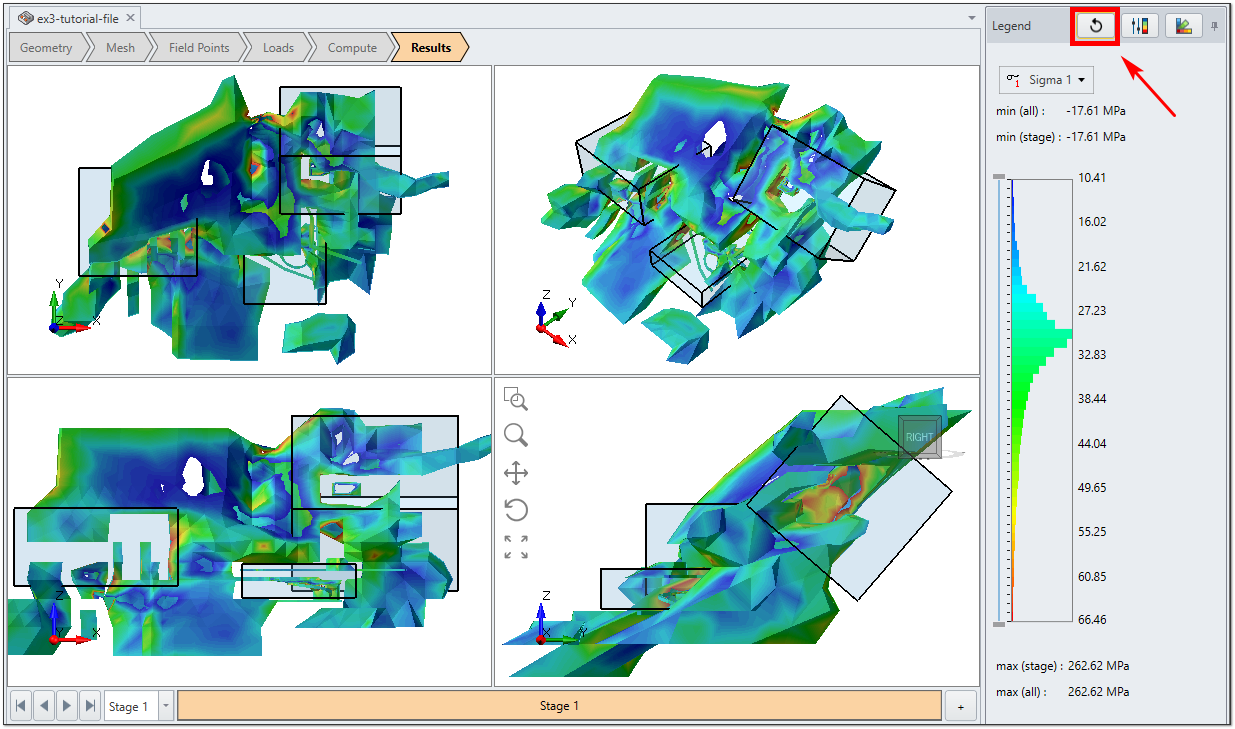
RESET THE CONTOUR POINT RANGE
If you wish to reset the point range, simply click on the ![]() Reset button (as shown below) to reset the range to the previous settings. or open the
Reset button (as shown below) to reset the range to the previous settings. or open the  Contour Options dialog to revert back to the original automatic settings (view Contour Options to learn more).