Data Contours Overview
The primary means of data interpretation after an EX3 analysis is the viewing of data contours directly on the model.
The EX3 program allows you to display contoured data from the boundary element analysis, by selecting a data type from the drop-down list in the Legend.
To view the contours of various data types, use the mouse to select the desired data from the drop-list.
Basic Data
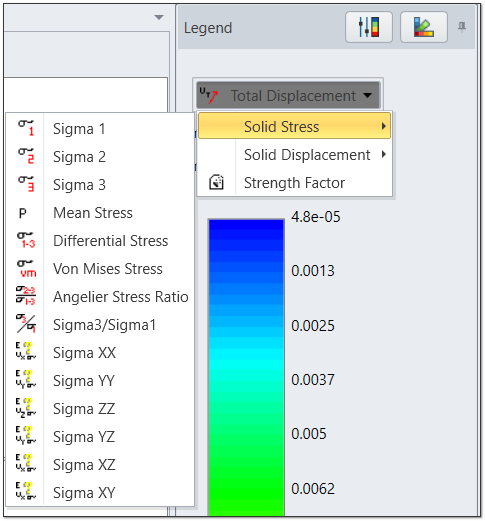
The following data types will always be available for contouring after an EX3 stress analysis:
- Solid Stress - Sigma 1, Sigma 2, Sigma 3, Mean Stress, Differential Stress, Von Mises Stress, Angelier Stress Ratio, Spalling Criterion, Sigma3/Sigma1, Sigma XX, Sigma YY, Sigma ZZ, Sigma YZ, Sigma XZ, Sigma XY
- Solid Displacement - Horizontal, Vertical, Total
- Strength Factor
User Data
With the User Data option, EX3 allows the user to contour almost any data used in the analysis, including user-defined functions of all input or output analysis variables. If User Data has been defined, then the names of these variables will appear at the end of the list of variables available from the drop-down list in the legend. See the User Data topic for details.
Notes:
- If you want to simultaneously view more than one data type for a single file (e.g. Sigma 1 and Sigma 3), then you must select New Window from the Window menu. This will generate a new window. You can then plot any data you wish in the new window.
- Any number of new windows can be opened for a given file, allowing the user to view different data in different windows, or to view different parts of the model in different windows, for example.
- Selecting a new data option from the Legend updates the contour plot in the active view only.
- If multiple windows have been opened, the user can select Tile Horizontally or Tile Vertically from the Window menu, to automatically tile the windows within the application window.
Many options are available in the Contour Options dialog, allowing the user to change the style, range, etc. of the contour plots. The Contour Options operate on a per-view basis so that each view can have its own set of contour options applied.