Geotextile Reinforced Ramp
1.0 Introduction
This tutorial investigates the performance of a ramp under loading. The model was constructed in four stages:
- Foundation soil layer is brought to equilibrium.
- Fill is added on top of the soil interlaid with geotextile support layers. Precast concrete liners are added to support the fill.
- The concrete road bed is constructed on top of the fill.
- Load is applied to the road surface.
1.1 Open the Initial File
- Select: File > Recent Folders > Tutorial Folder > Support
- Open the Geotextile Reinforced Ramp file.
This file has the model geometry created, material properties defined and assigned, and support properties defined. The tutorial begins with assigning geotextiles. Note that the geotextile reinforcement layers were modelled using Structural Interfaces. The Structural Interface properties are already defined in this model; the structural interface is composed of a geotextile liner sandwiched between two joints (slip elements).
2.0 Model
2.1 Assign Geotextiles
![]()
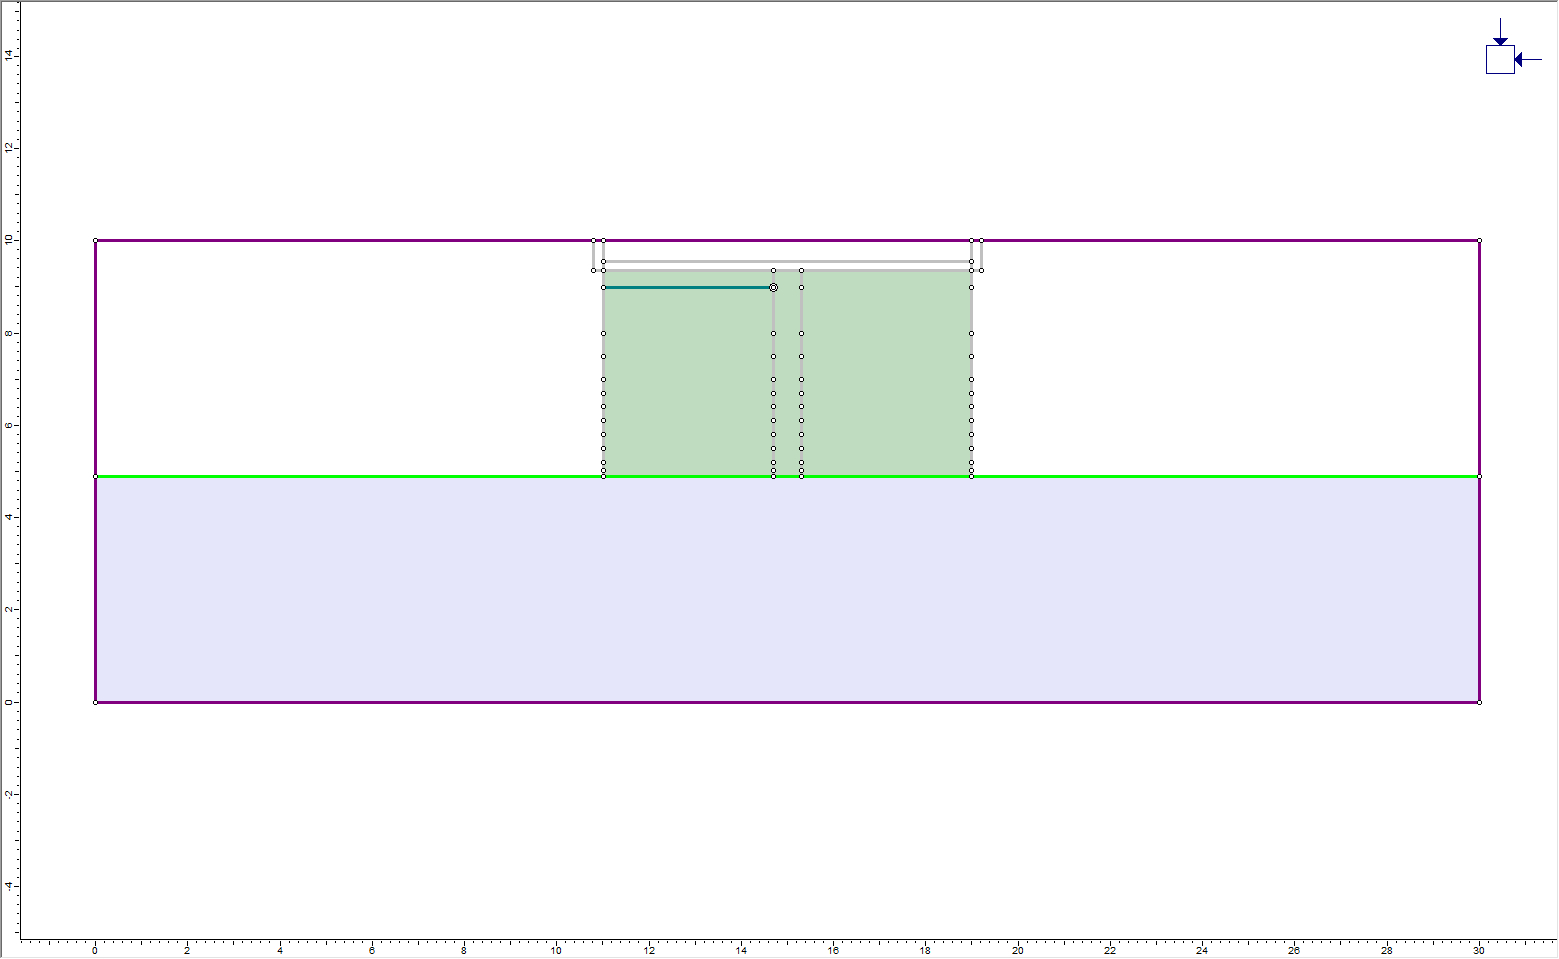
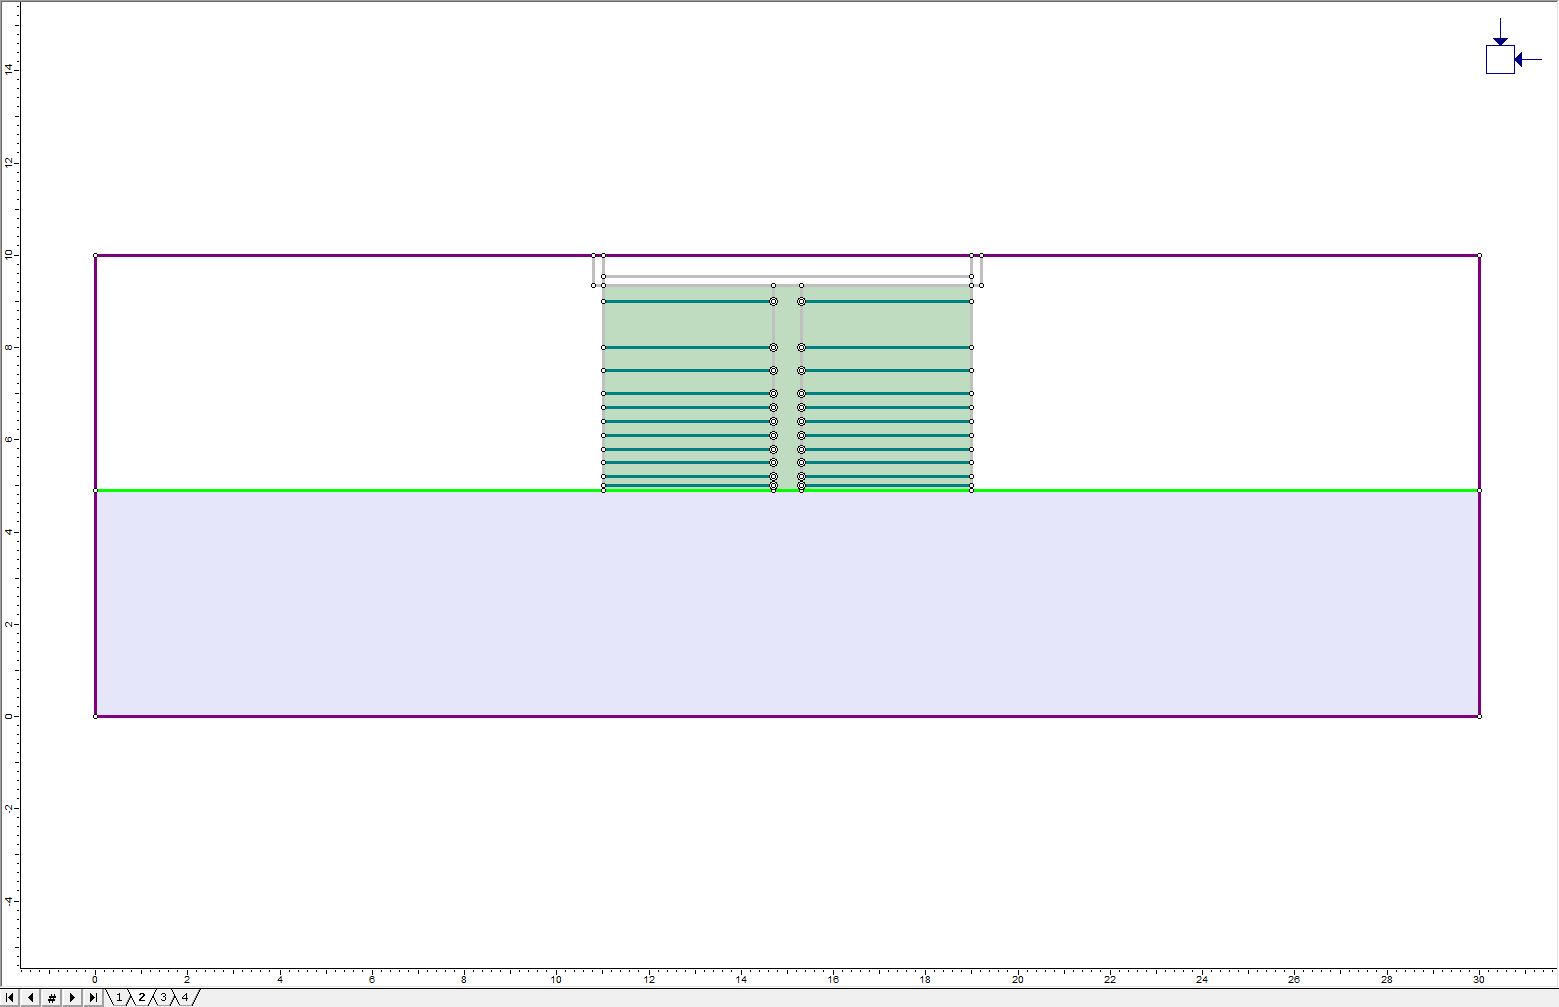
The geotextile supports are a series of horizontal Structural Interfaces within the Fill. The coordinates are already defined. To add the Structural Interfaces:
- Select: Boundaries > Add Structural Interface

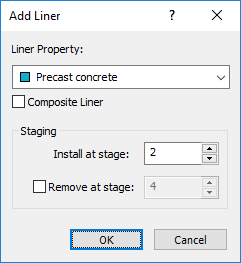
- In the Add Structural Interface dialog, select First point closed / last point open. Under Staging, set Install at stage to 2. The dialog should appear as shown:
- Click the OK button. Ensure Stage 2 is selected. Select the point with coordinates (11, 9). Now click on the point at (14.7, 9). Right-click and choose Done. There is now one structural interface that is free to slip on the inside edge and is unable to slip on the outside edge.
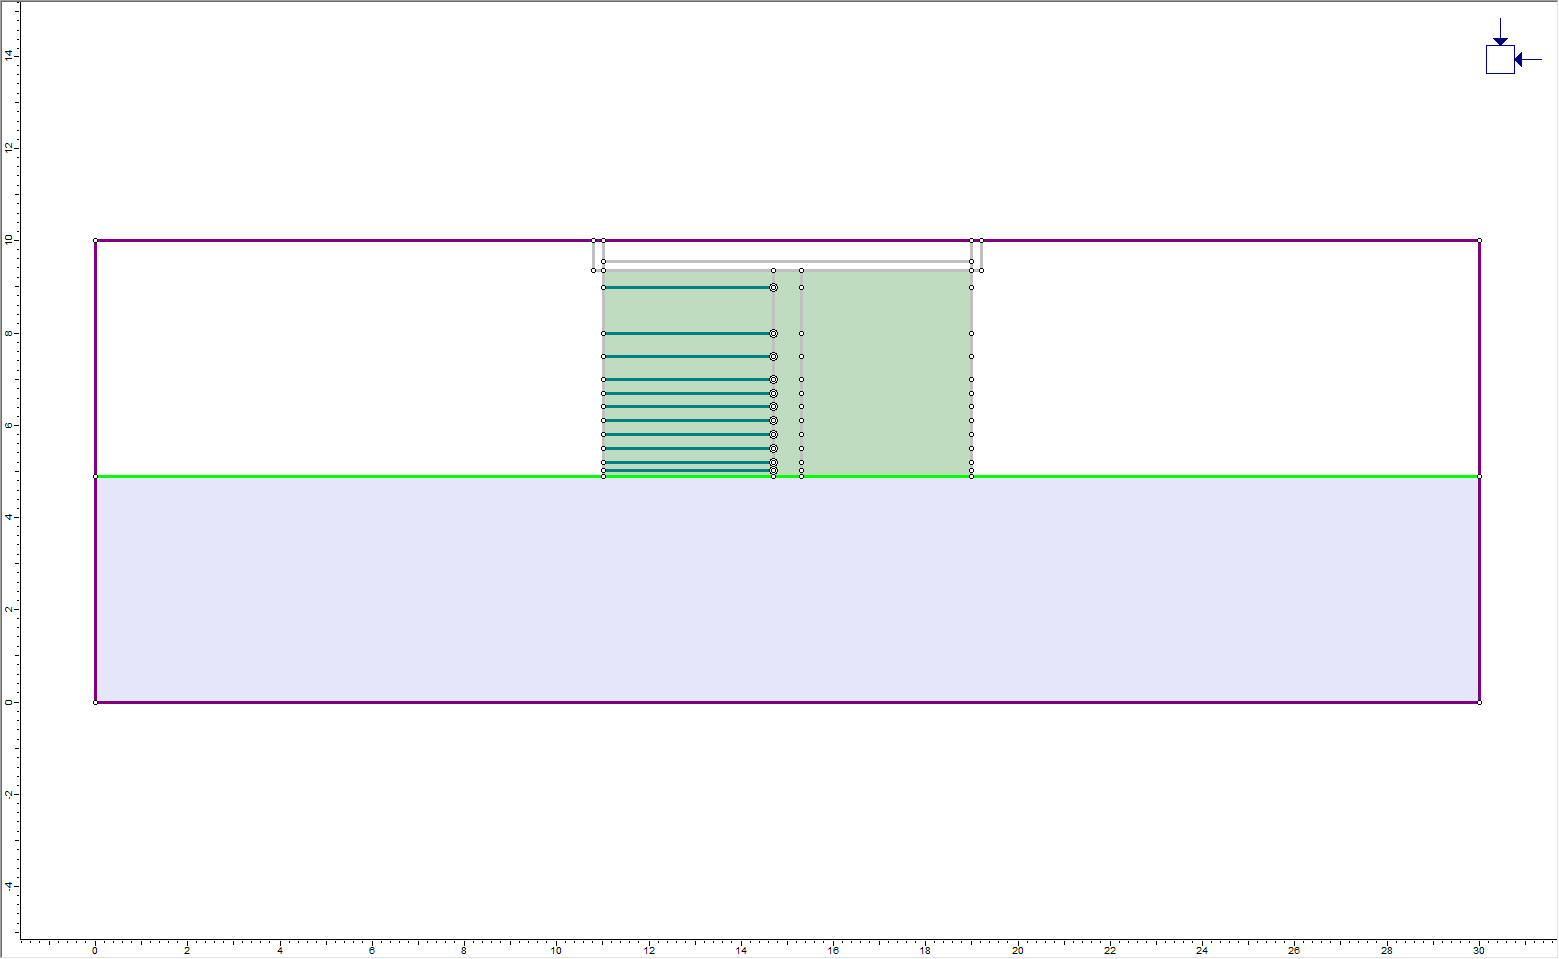
The easiest way to add the remaining Structural Interfaces is by copying and pasting.
- Right-click on the Structural Interface. Select Copy Boundary.
- To enter a point from which to copy (base point), select the left point of the existing Structural Interface.
- Enter the point to copy to by selecting the next point directly below (11, 8). A copy of the Structural Interface should now appear.
- Repeat these steps for the remaining points on the left side of the Fill until the model appears as shown.
Now, add Structural Interfaces to the right side of the fill. Repeat the above technique (be careful to ensure that the outside point is closed and the inside point is open). Alternatively, use the multiple copying capability of RS2.
- Select: Boundaries > Edit > Copy
- Select all the Structural Interfaces by drawing a selection window around them (click the left mouse button and hold it down while moving the mouse to expand the size of the box).
- Hit Enter to finish the selection. Now select a base point to copy from (say 11, 9) and then a point to copy to (15.3, 9). There should now be an exact copy of the Interfaces on the right side of the fill.
TIP 1: For selecting multiple boundaries, the default option is Select Inside Only, meaning that only line segments completely inside the selection window will be selected. Change this to select line segments that cross the selection window as well by right-clicking while making the selection, choosing Selection Window, and choosing Select Inside or Crossing.
TIP 2: When trying to select the Structural Interfaces, enclose other boundaries with the Selection Window. To copy only the Structural Interfaces, use a Selection Filter. Just before drawing the Selection Window, right-click and choose Selection Filter. Now un-check everything except for Structural Interfaces as shown. This will ensure that only Structural Interfaces are selected.
Notice that the Interfaces on the right side are oriented the wrong way, with the closed points on the inside and the open points on the outside. To flip them around:
- Select: Boundaries > Convert Boundary
- Select all the Interfaces on the right side using a Selection Window (don’t forget to apply the Selection Filter again to ensure only Structural Interfaces are selected) and press Enter.
- The Convert To dialog box will appear. Select Structural Interface and click OK. In the Add Structural Interface dialog, select First point open / last point closed. Click OK. The model should now look like this.
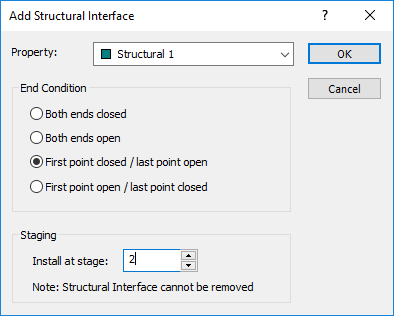
2.2 Loading
![]()
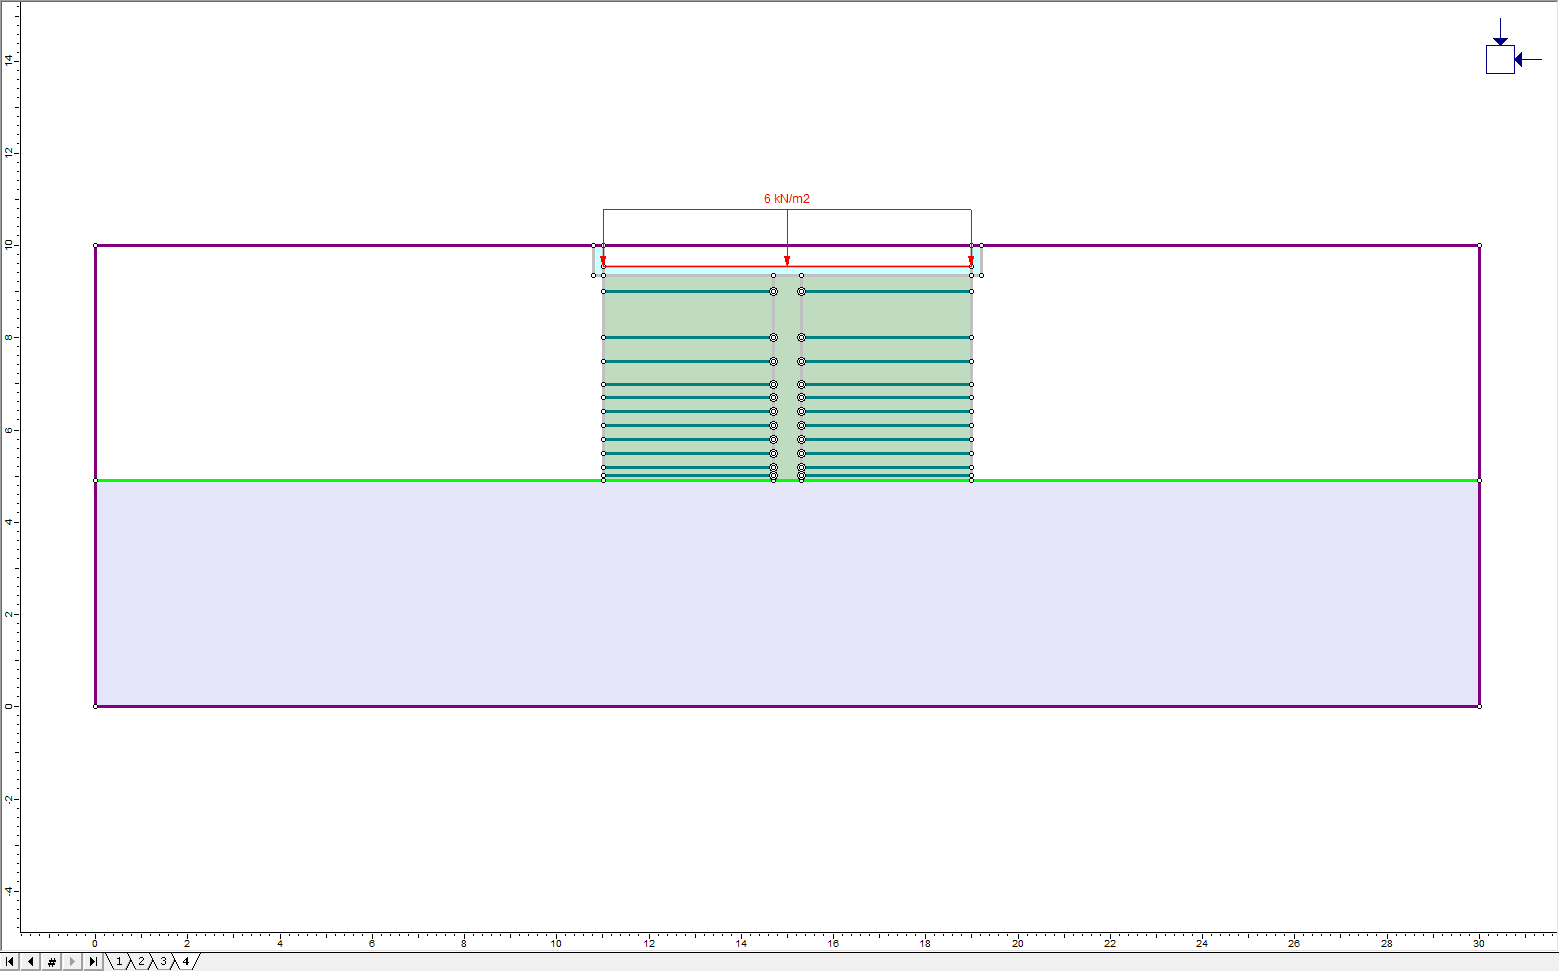
Click on the Stage 4 tab. To add the loading to the road surface:
- Select: Loading > Distributed Loads > Add Uniform Load

- Leave the orientation as "Normal to boundary" and enter 6 kN/m for the magnitude.
- The load only needs to be applied during Stage 4, so turn on the Stage Load option and click the Stage Factors button.
- Enter 0 for the Stage 1, 2 and 3, and 1 for Stage 4. Click OK.
- Now click OK in the Add Distributed Load dialog. In the model, click on the stage boundary that is the road surface.
Press Enter and the model should now look like this:
2.3 Field Stress
The last step is to specify the field stress in the model.
- Select: Loading > Field Stress

- Set the Field Stress Type to Gravity and turn on the option Use actual ground surface as shown.
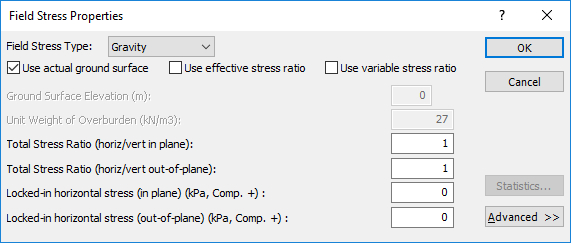
- Click OK to close the dialog.
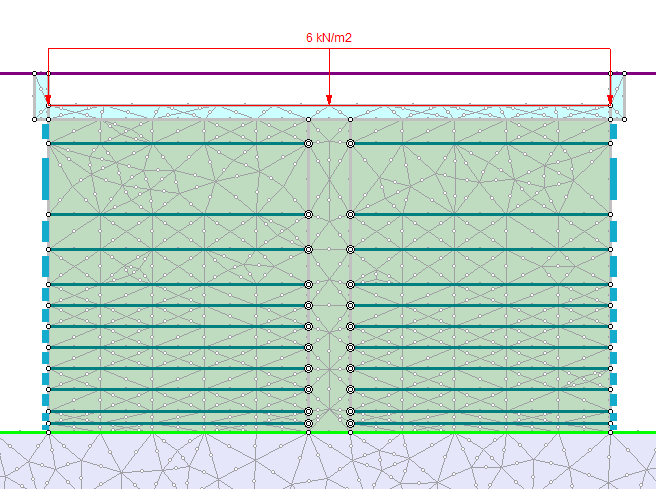
2.4 Mesh
![]()
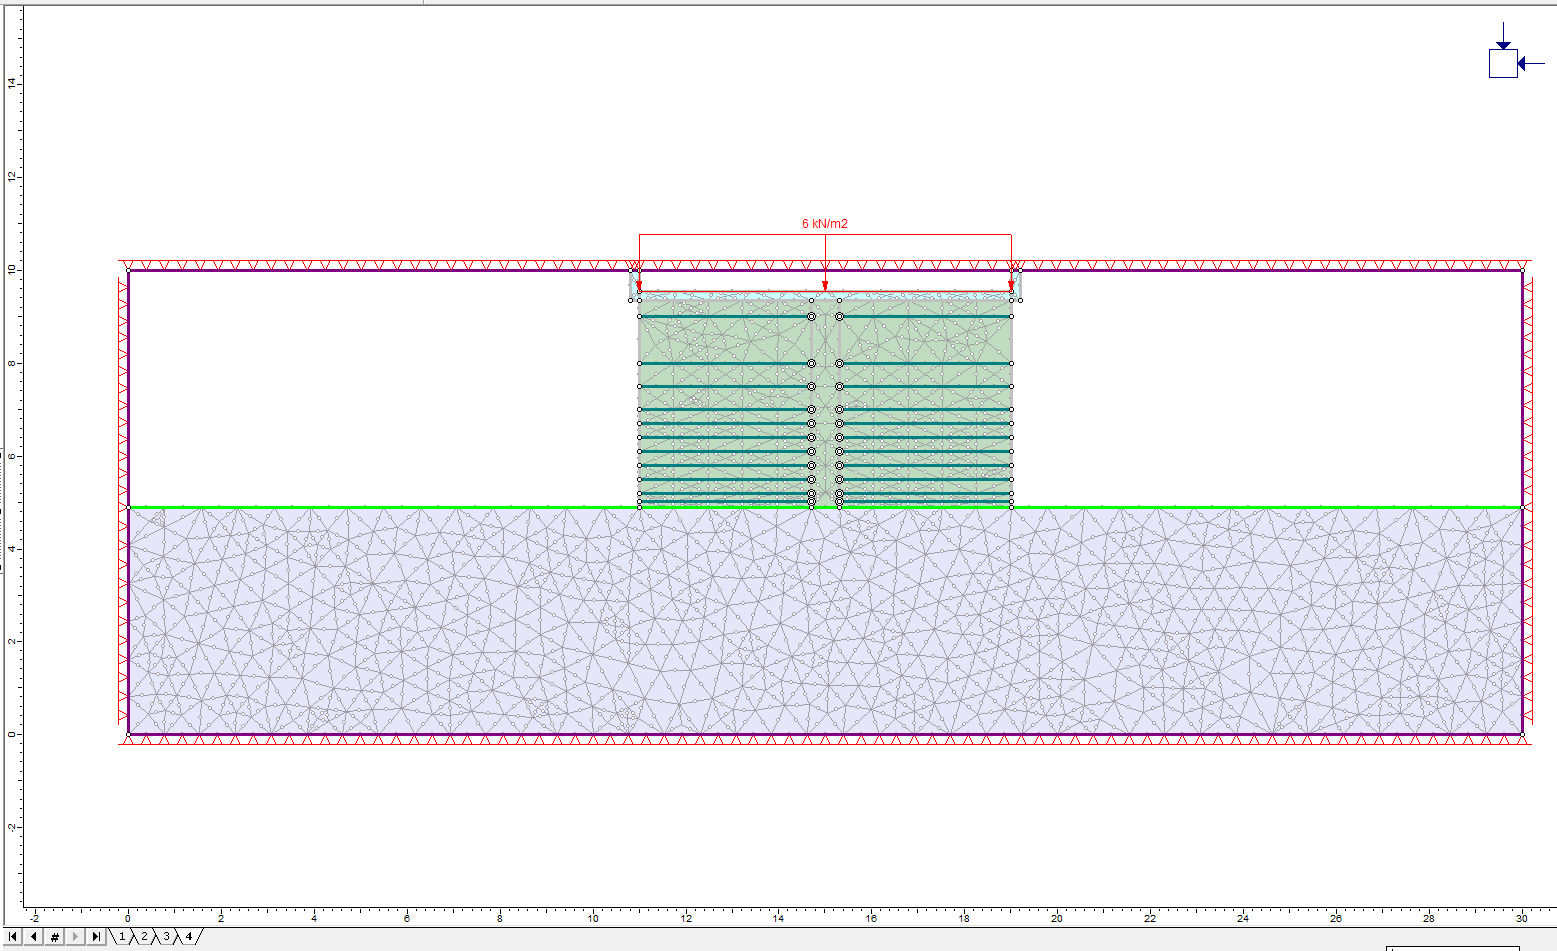
- Select: Mesh > Mesh Setup

- Change the Mesh Type to Uniform. Leave the default element type (6 Noded Triangles) but set the number of elements to 1200. Click the Discretize button followed by the Mesh button.
- Close the Mesh Setup dialog by selecting the OK button. The model should now appear as shown.
2.5 Assign Liners
![]()
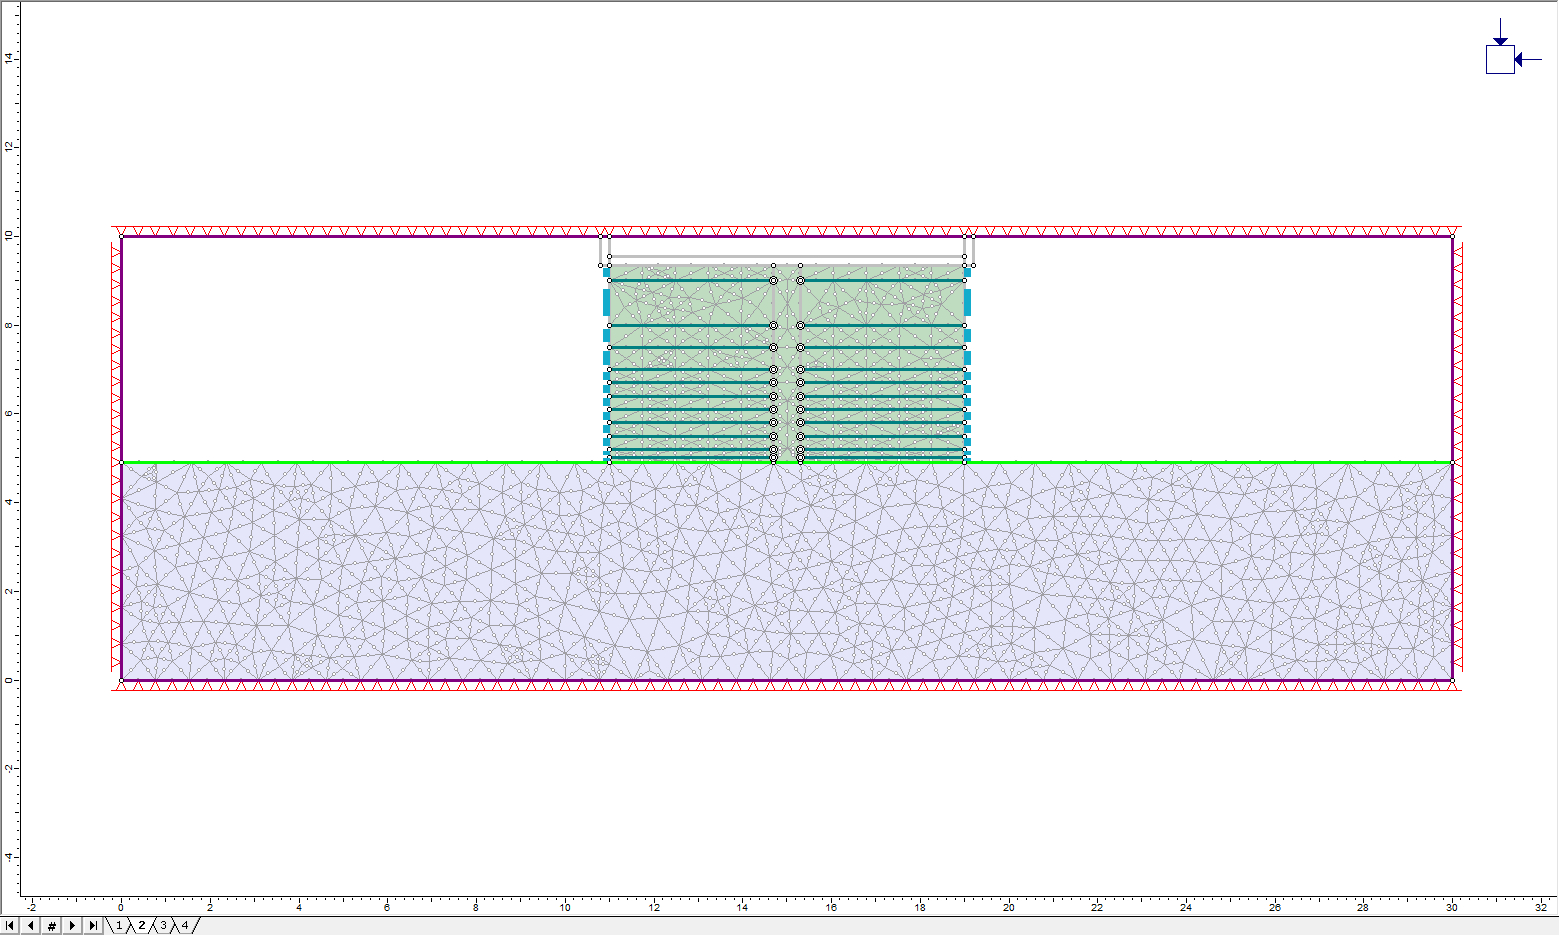
Click on the Stage 2 tab. To add the precast concrete liners:
- Select: Support > Add Liner

- Ensure that the Liner property is Precast Concrete and the Install at stage is set to 2.
- Click OK. Now select all the boundary segments on the left side of the Fill layer. Select them all at once by encompassing them in a box as described above. Do the same for the right side of the fill. Right-click and choose Done Selection. The model should now appear as shown:
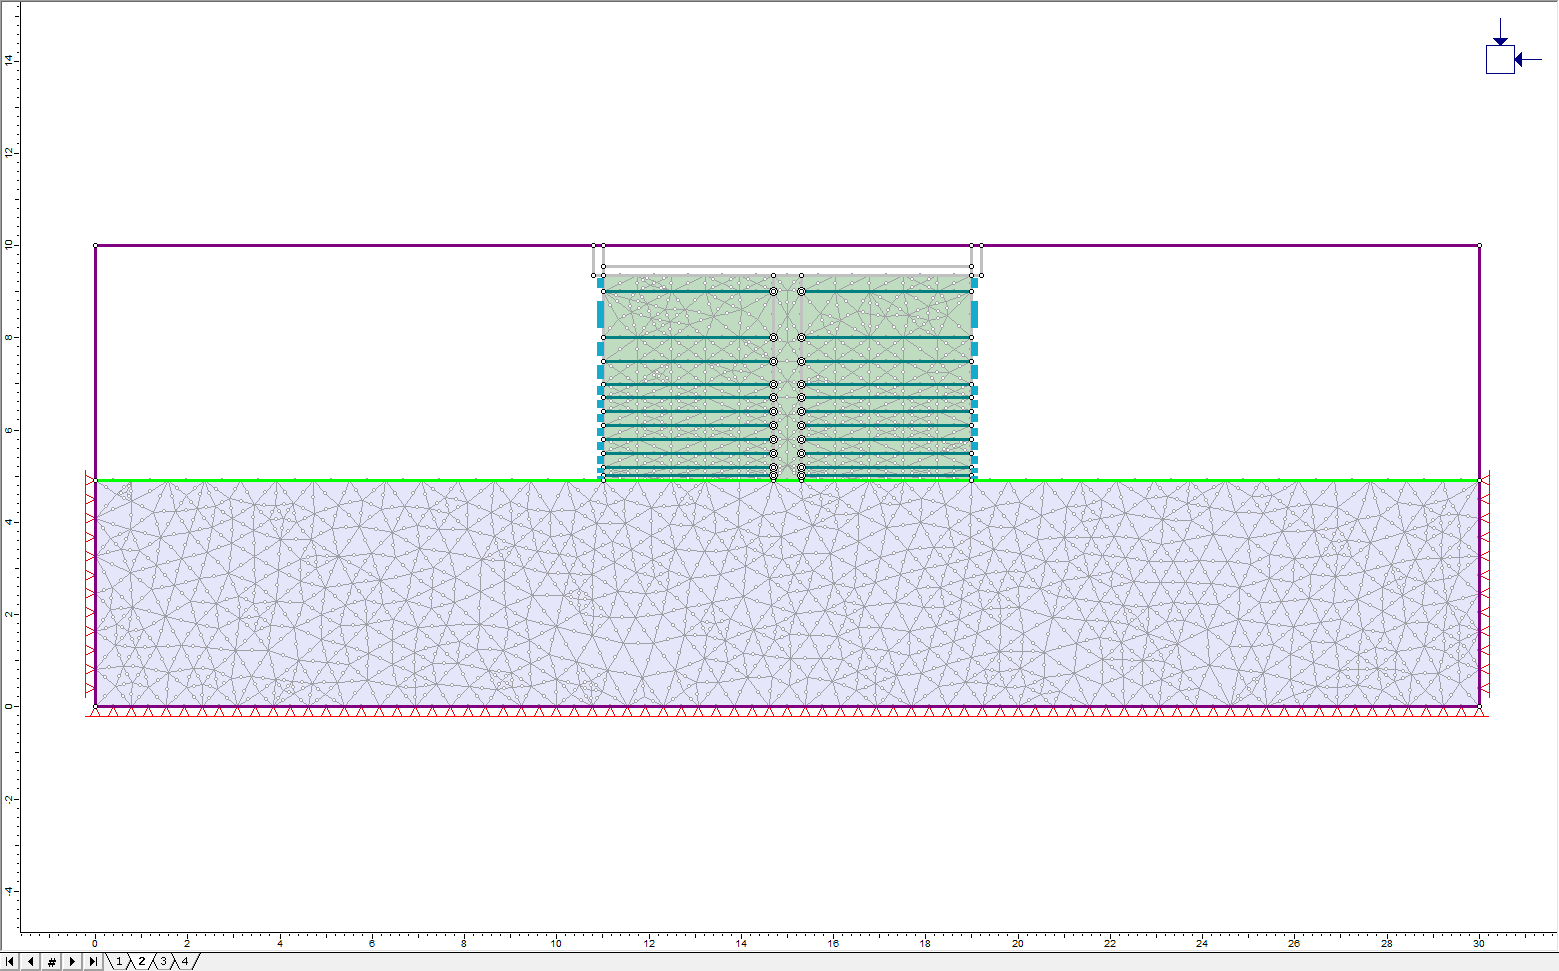
2.6 Boundary Conditions

The model now shows the default boundary conditions (all external boundaries fixed in the x and y directions). Only the edges and bottom of the Soil layer need to be fixed. To free the other boundaries:
- Select: Displacements > Free

- Click on all the outer boundaries except the sides and edges of the Soil layer. Be sure to select the very small boundary segments that form the top edges of the road
- Hit Enter to finish selecting.
The top left and top right nodes of the soil layer have now been freed. To re-fix them, select Restrain X, Y from the Displacements menu and click on the left and right edges of the soil layer. Hit Enter to finish. The model should now look like this:
The model is now complete. Save the model before computing.
3.0 Compute
- Select: Analysis > Compute

4.0 Results and Discussion
- Select: Analysis > Interpret

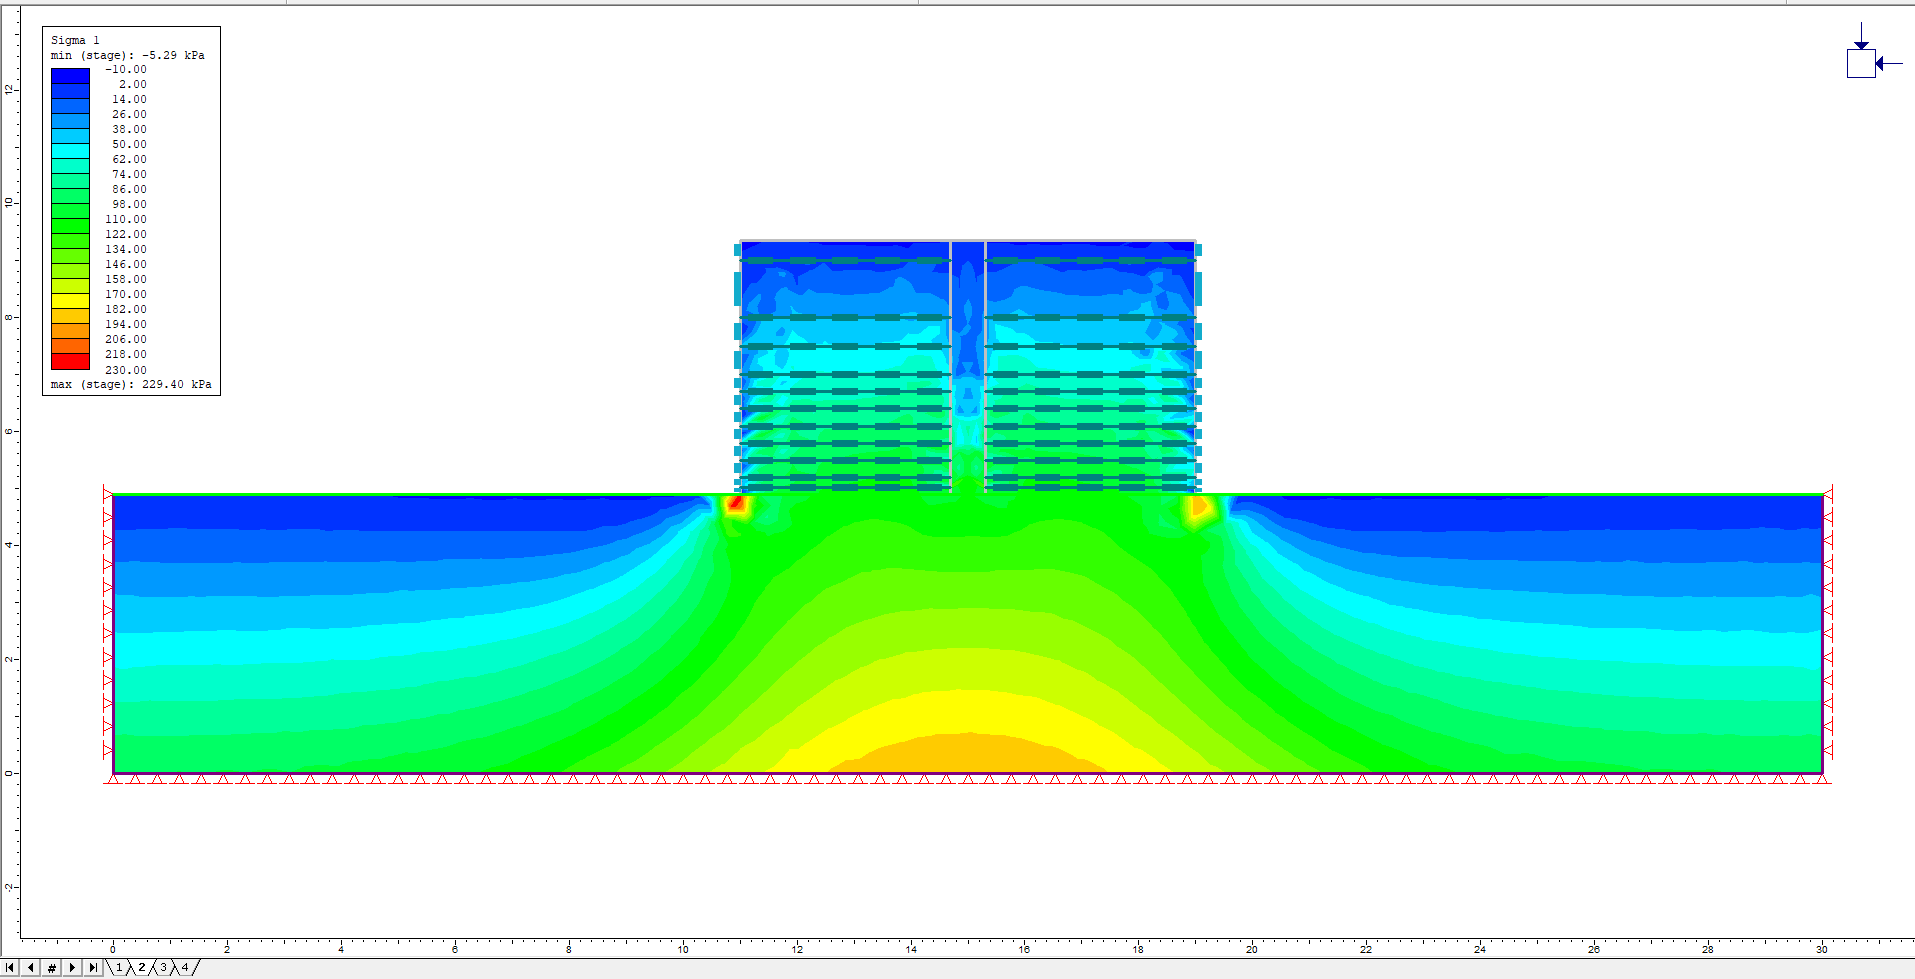
The following screen is displayed showing the maximum stress in the Foundation Soil layer for Stage 1:
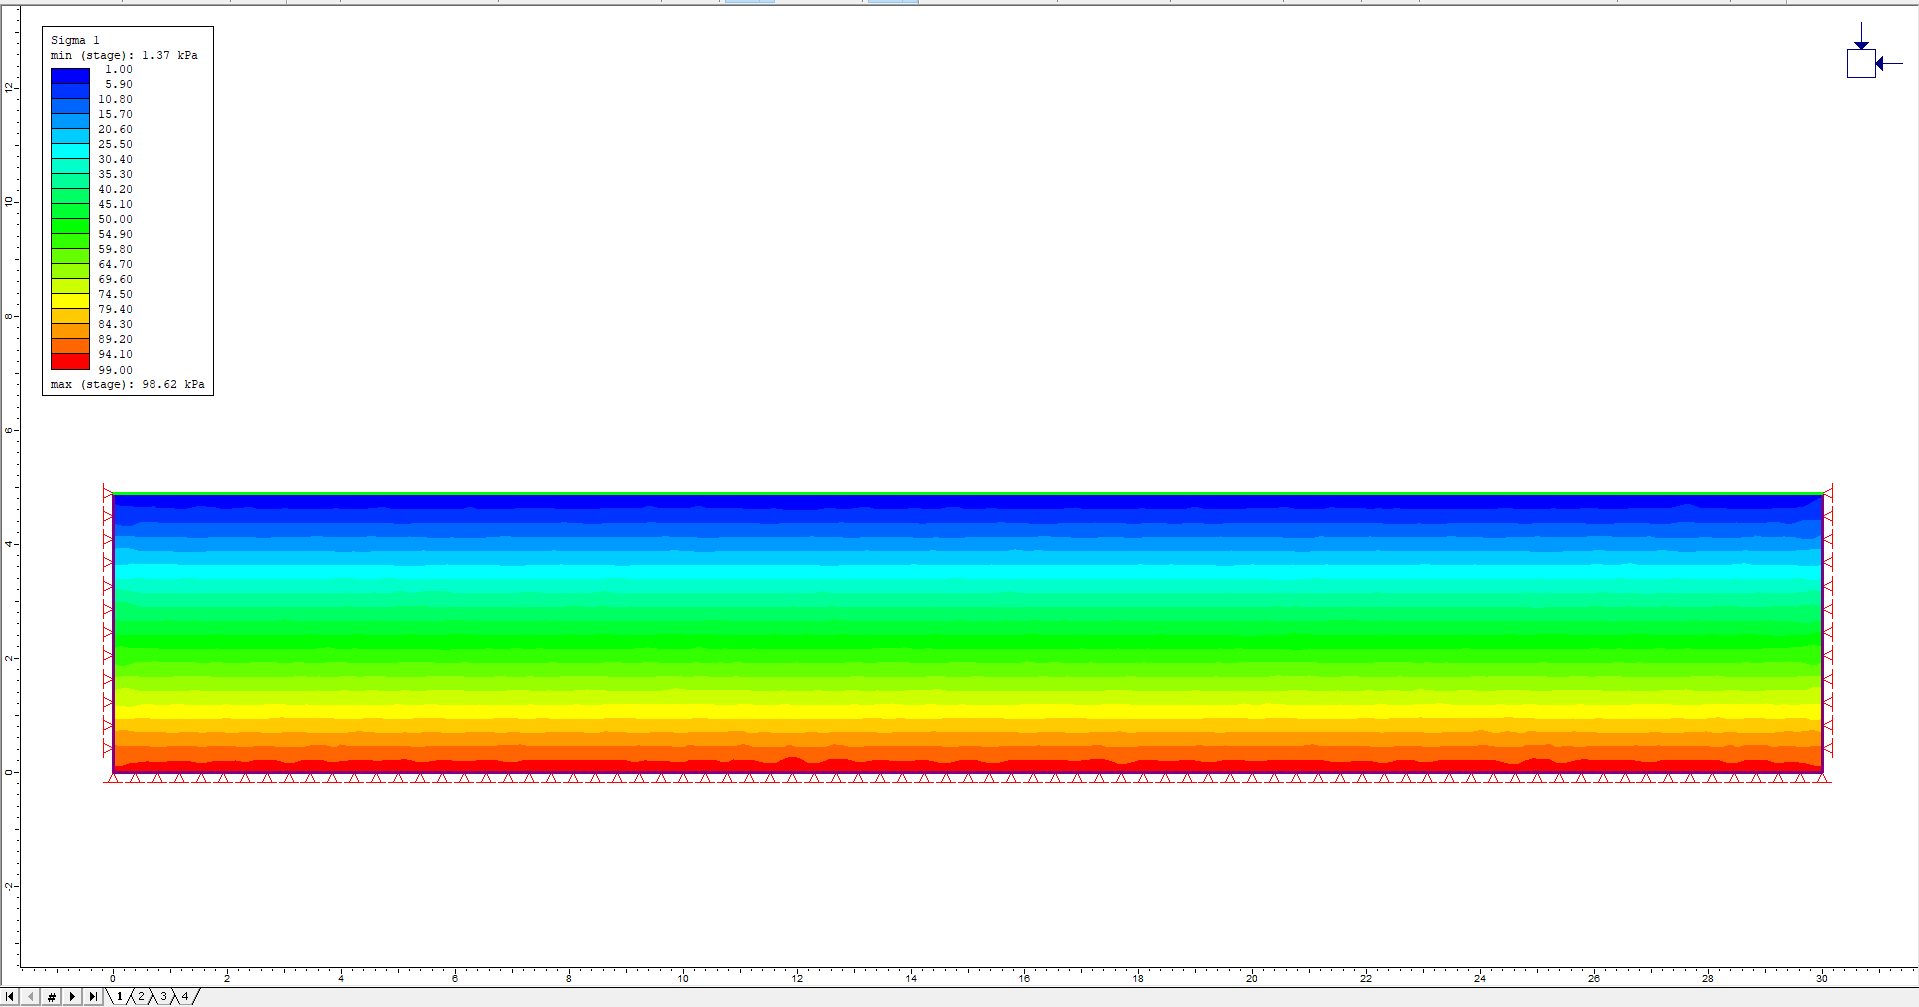
This reflects the initial element loading of the soil layer. Plotting displacements will show that no displacement has occurred.
Click on the Stage 2 tab.
- The maximum stress after the fill has been added is now visible
- To make the plot clearer, shrink the size of the plotted Structural Interface
- Right-click anywhere in the window and choose Display Options. Click on the Support tab and turn off the option for Expand Composites under the Support heading. The plot should appear as below:
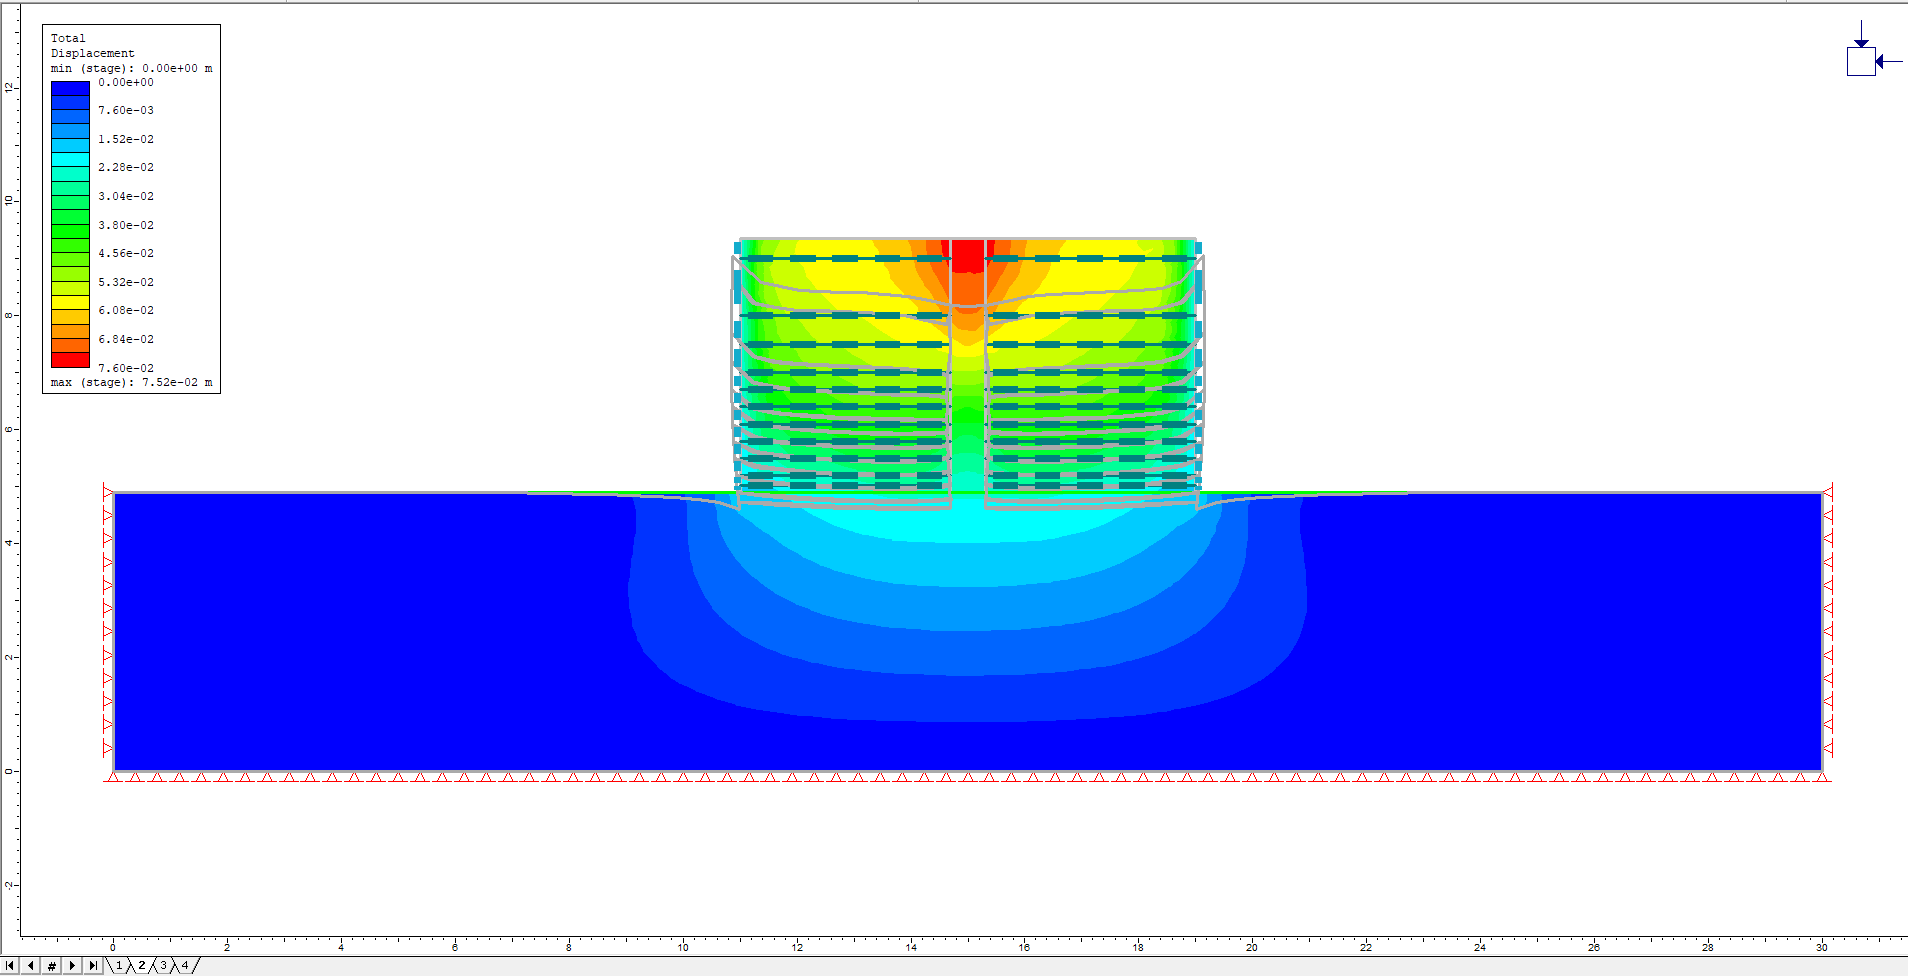
- Plot displacements by choosing Total Displacement from the drop-down menu on the toolbar.
- Plot the deformed boundaries by clicking the Display Deformed Boundaries button
Significant downward displacement in the fill is visible since it has settled under its own weight. There is less displacement at the edges where the fill is being supported by the precast concrete liner.
Click through the other stages and view the increased deformation as the concrete roadbed is added and then when the load is applied in Stage 4. To see the effect of the load only, set Stage 3 as the reference stage:
- Select: Data > Stage Settings. Drag the slider for Reference Stage to Stage 3
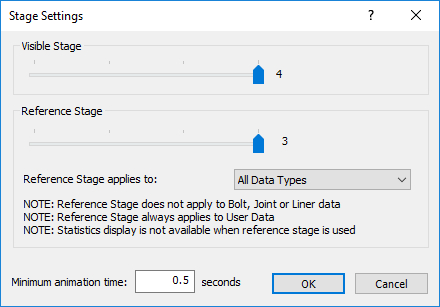
- Click OK to see the effect of just the loading in the final stage.
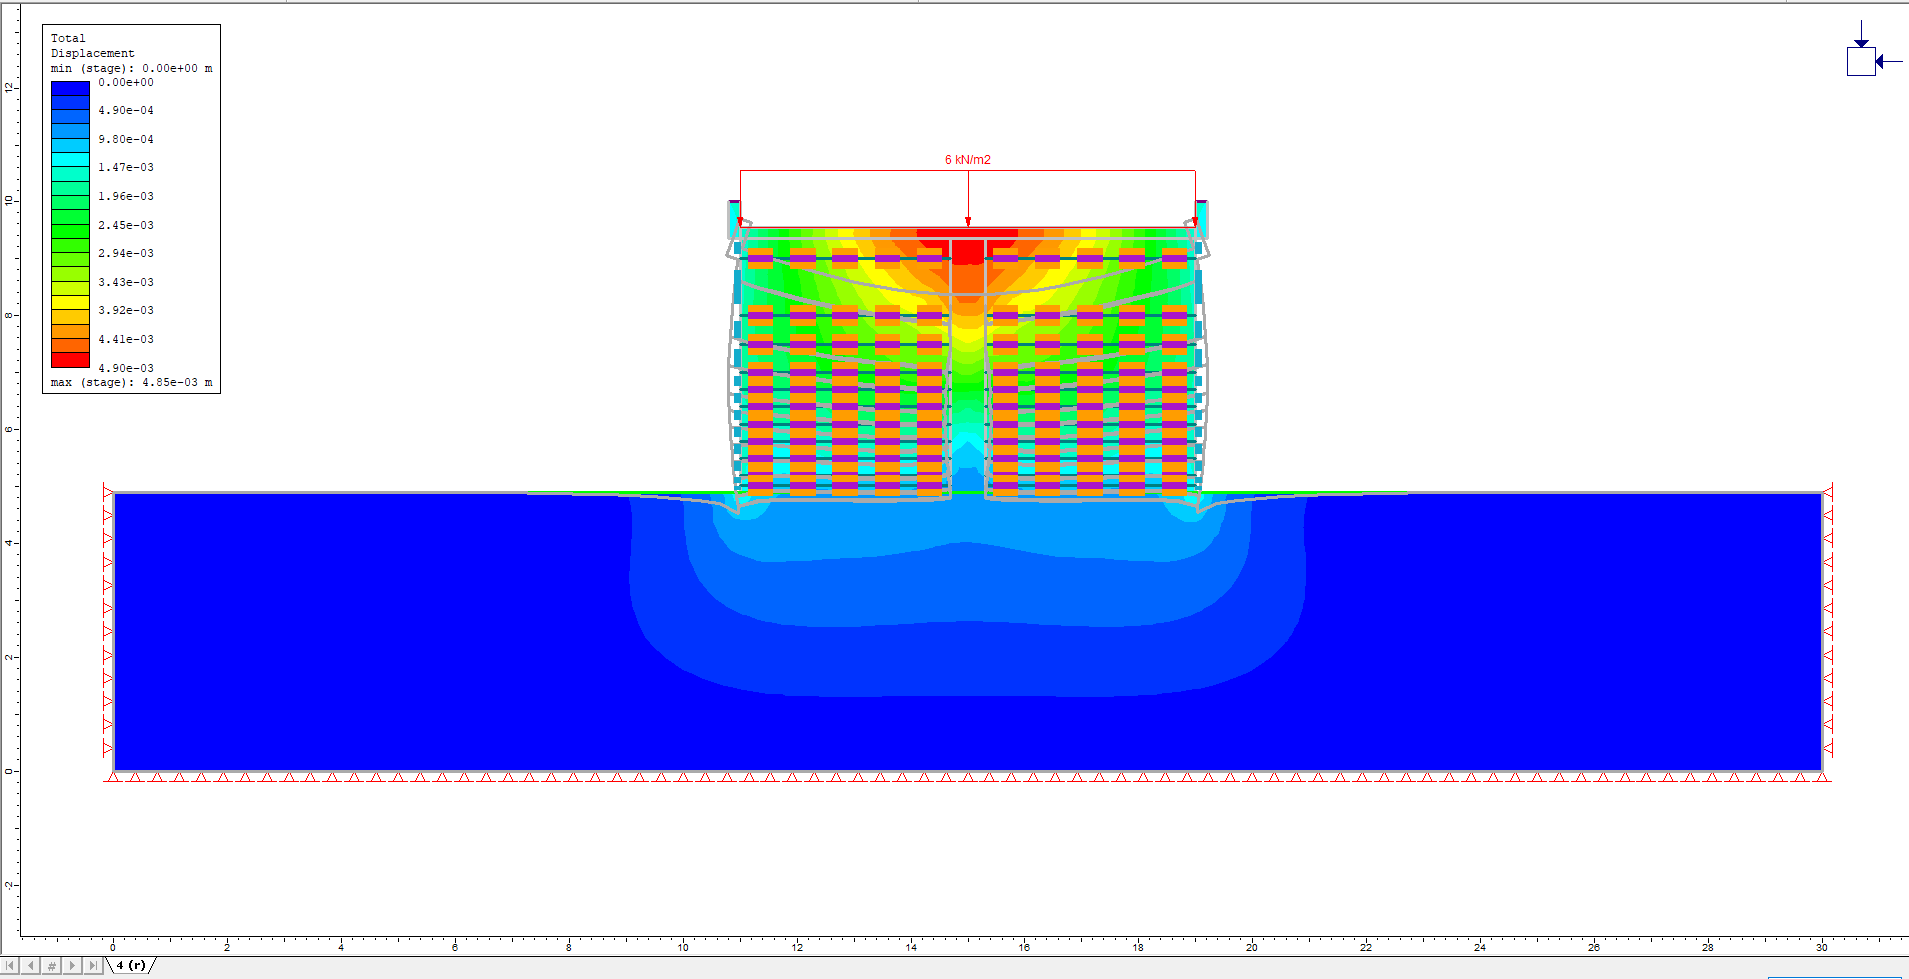
Check if any of the supports have failed by clicking on the Display Yielded Liners button. The outside edges of the upper geotextiles have failed. The precast concrete liners have remained intact since they were set as elastic.
It is also possible to plot the bending moments associated with the concrete supports.
- Turn off the deformed boundaries.
- Right-click on the liner and select Show Values > Bending Moments
- Check the Liners check box and choose Bending Moment from the drop-down menu.
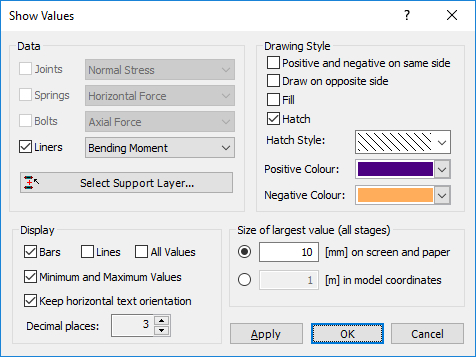
- Click OK and the bending moments will be plotted graphically on the model.
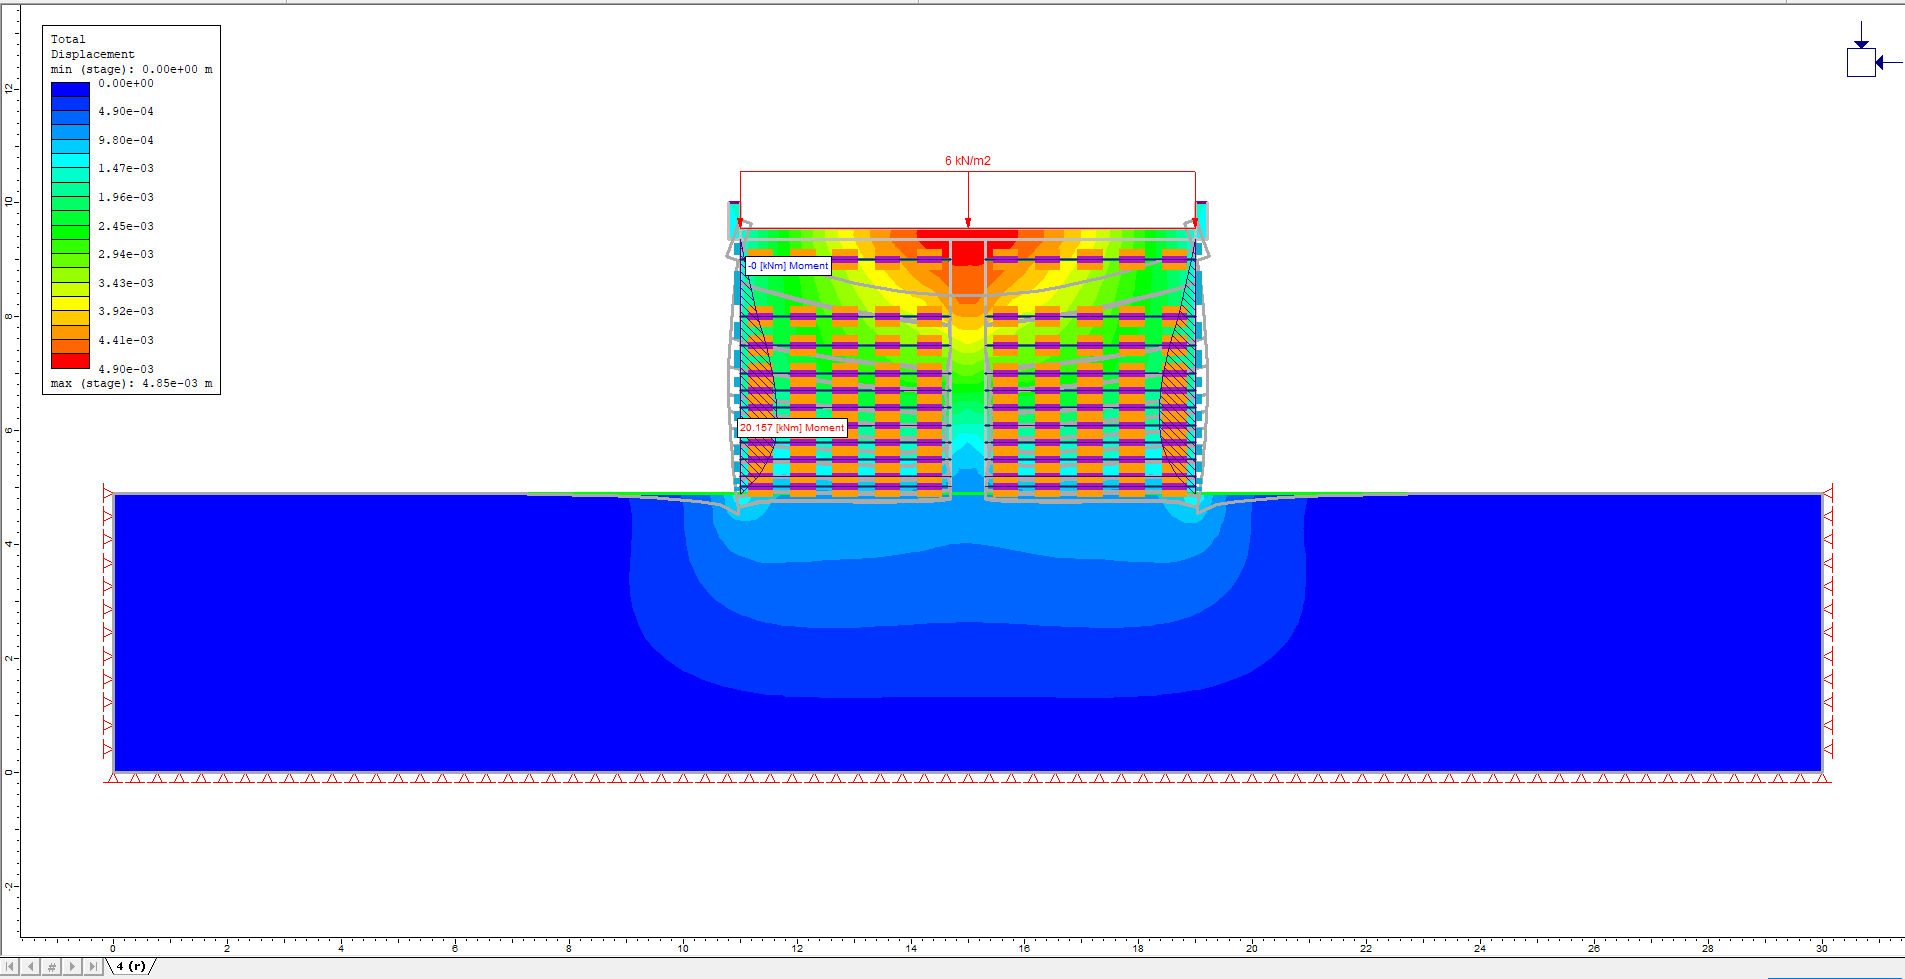
The maximum and minimum moments are shown. Note that the geotextiles cannot support moments, so all their values are 0.
To see the true minimum moment for the concrete supports, turn off the plots for the geotextiles:
- Select: Analysis > Toggle Show Values
- Now click on each of the geotextiles to turn them off.
This concludes the Geotextile Reinforced Ramp Tutorial.