Coupled Drawdown Analysis
1.0 Introduction
In this tutorial, RS2 is used to simulate slope drawdown to determine its effect on slope stability, specifically the change in slope factor of safety. Furthermore, this problem considers different drawdown rates for fully drained, drained, and undrained conditions.

The drainage conditions used in RS2 are defined as follows:
- Drained – Fluid can move into and out of the model, total volume (voids and soil skeleton) can change. Drainage is a function of time. Excess pore pressures can exist. Transient pore pressure state.
- Undrained – Fluid cannot move into or out of the model. Zero volume change. Excess pore pressure is a function of applied loads.
- Fully drained – Zero excess pore pressure. Drained analysis at infinite time. Steady-state result.
In this tutorial, a fully drained example and undrained example are analyzed. A drained example is also analyzed, with the different drawdown rates of R=0.1m/day, 0.25m/day, 0.5m/day, 0.75m/day, and 1m/day. For the overall analysis of the problem, the drawdown ratios used were L/H = 0.2, 0.4, 0.6, 0.8, and 1.0 (where L is the external water level drop from the initial water level, and H is the slope height or initial water level).
2.0 Model
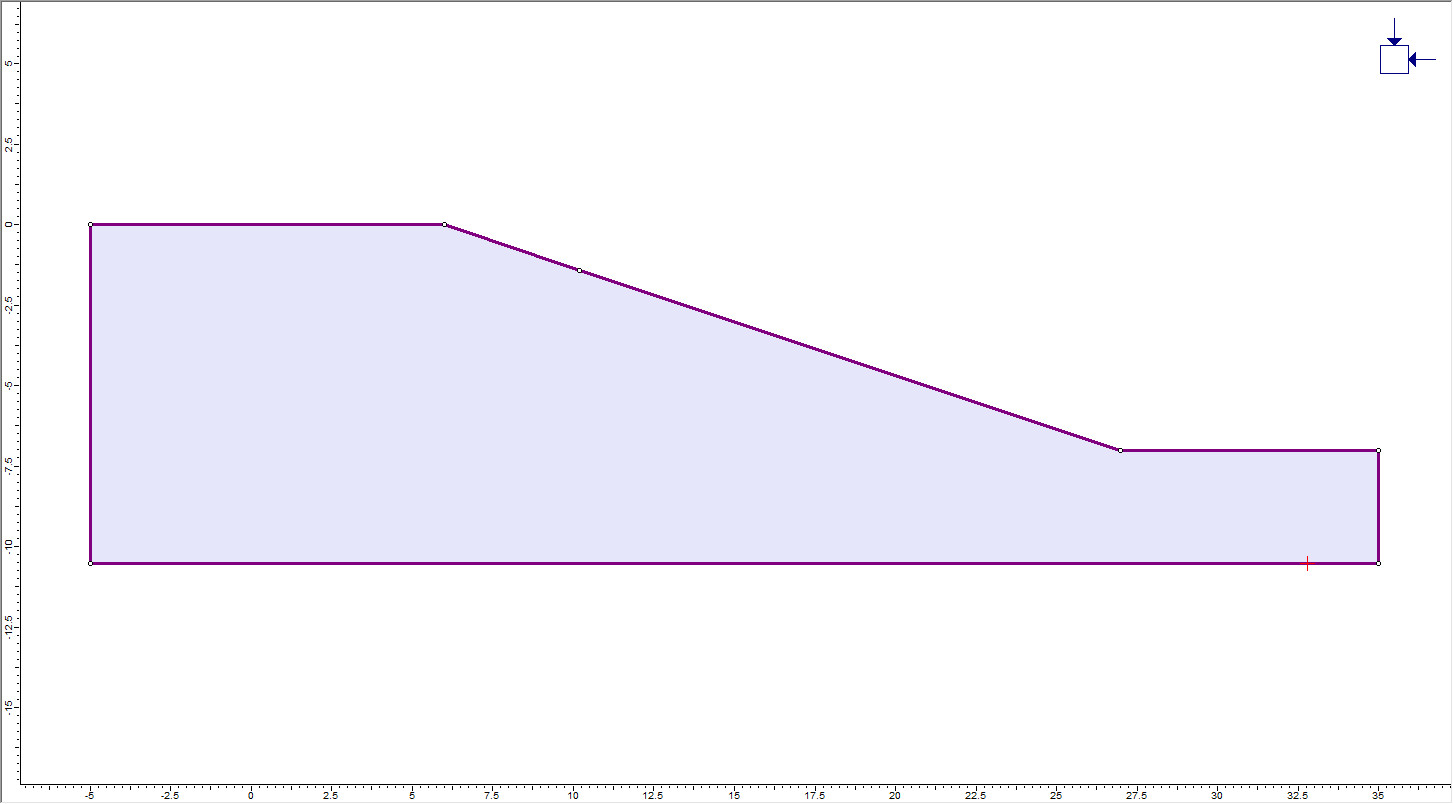
Import the geometry for the model.
Select: File > Import > Import DXF
Navigate to the Tutorials folder and open the file Coupled Drawdown Analysis.dxf. In the DXF Options dialog, make sure External Boundary is selected and click Import. The imported external boundary should look like the following model:
2.1 Project Settings
 Select: Analysis > Project Settings
Under the Groundwater tab:
- Set the Method = Transient FEA
- Check box for "Define pwp method by stage"
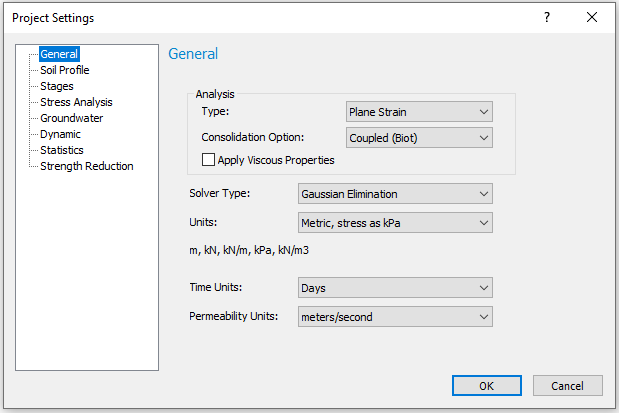
Select the General tab.
- Select Consolidation Option: Coupled (Biot) to simulate the different drainage conditions to accurately determine slope stability. The stability of a slope is dependent on the internal and external forces applied, including pore pressure and surface water. A change in the water level causes seepage-induced pore pressures and stress-induced excess pore pressure to develop, which dissipates over time resulting in consolidation and thus potentially decreasing slope stability.
- Make sure the Units option is set to Metric, stress as kPa, the Time Units to Days, and the Permeability Units to meters/second.
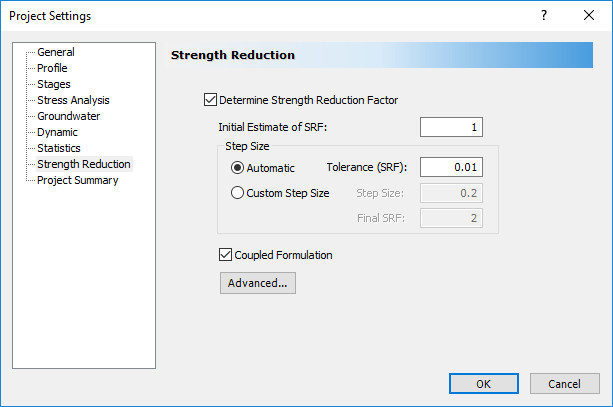
Select the Strength Reduction tab.
- Check Determine Strength Reduction Factor, and then check Coupled Formulation, as shown below.
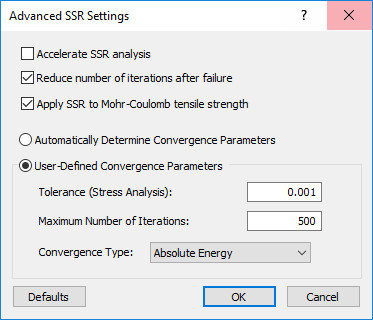
Click on the Advanced setting and select User-Defined Convergence Parameters and change the convergence type to Absolute Force & Energy, as shown in the figure below.
FULLY DRAINED
For the fully drained example:
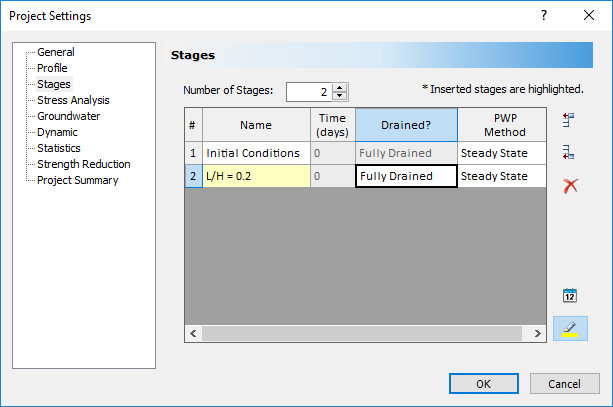
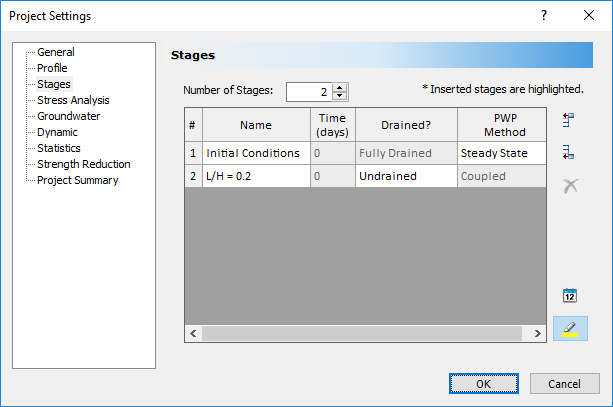
- Select the Stages tab and change the number of stages to 2.
- Change the staging information to the following:
Close the dialog by clicking OK.
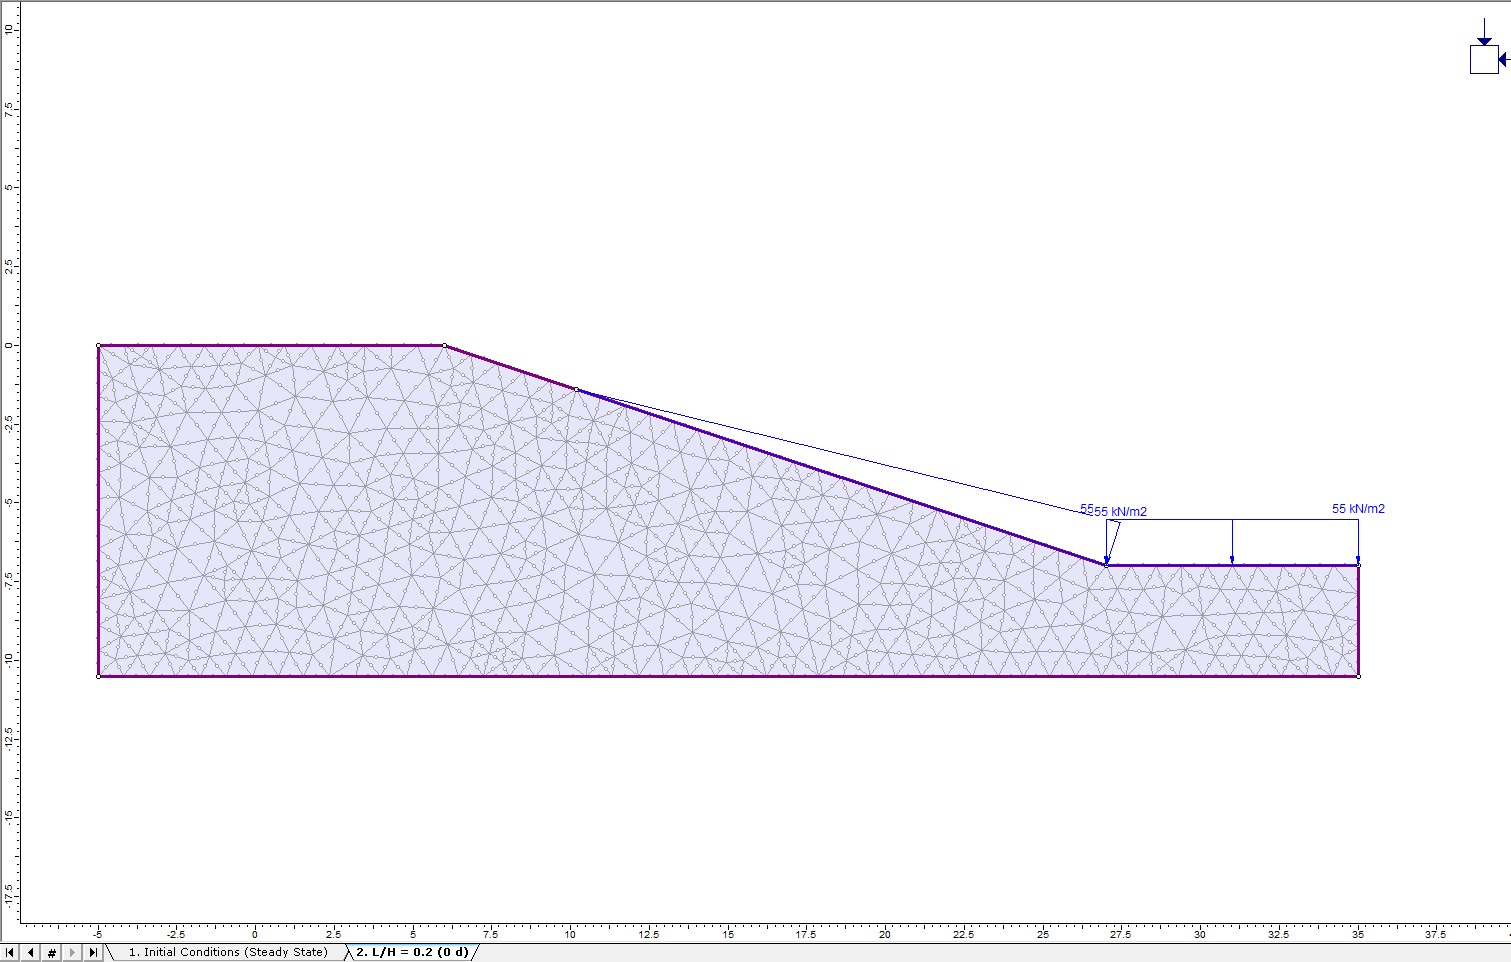
2.2 Boundaries
![]()
Let’s add a vertex representing the drawdown level on the slope.
 Select: Boundaries > Edit > Add Vertices.
Input the coordinate points (10.2, -1.4) and press Enter. The slope should look like the model below:
2.3 Materials
![]()
 Select: Properties > Define Materials.
Change the unit weight, Poisson's Ratio, Young's Modulus, Tensile Strength, Friction Angle, and Cohesion to the following values shown in the figures below. To conduct a slope stability analysis, ensure that the material type is Plastic and "Apply SSR" is checked.
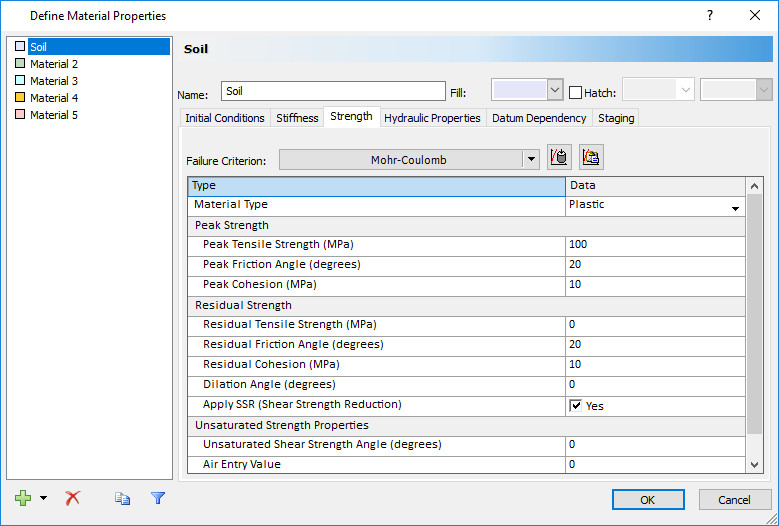
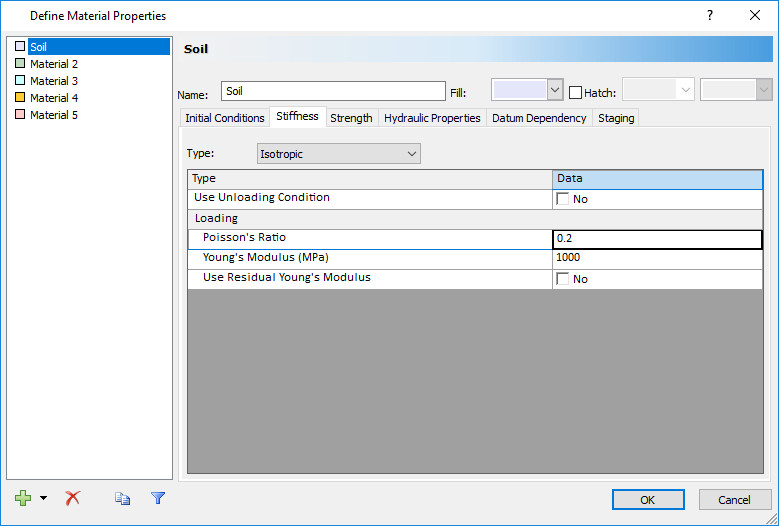
These properties will remain the same for all three drainage examples.
2.4 Hydraulic Properties
![]()
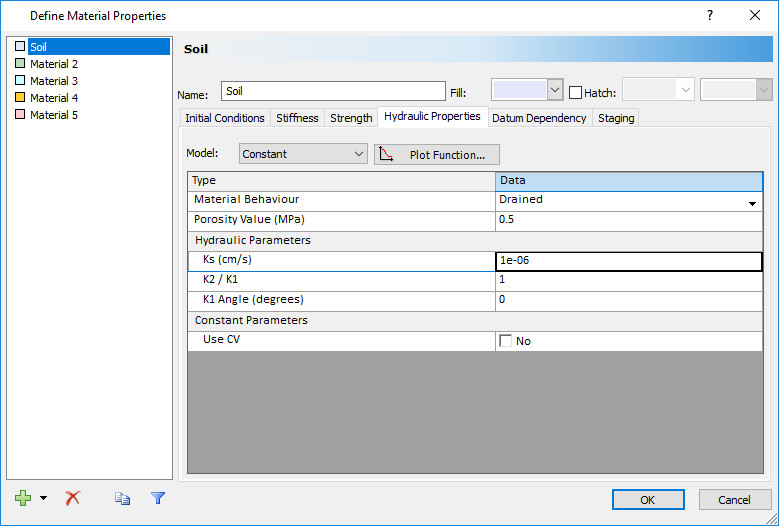
 Next, let’s define the hydraulic properties:
- Select the Hydraulic Properties tab in the Define Material Properties dialog
- Change the model to "Constant".
- Change the hydraulic conductivity (Ks) to 1e-6 cm/s.
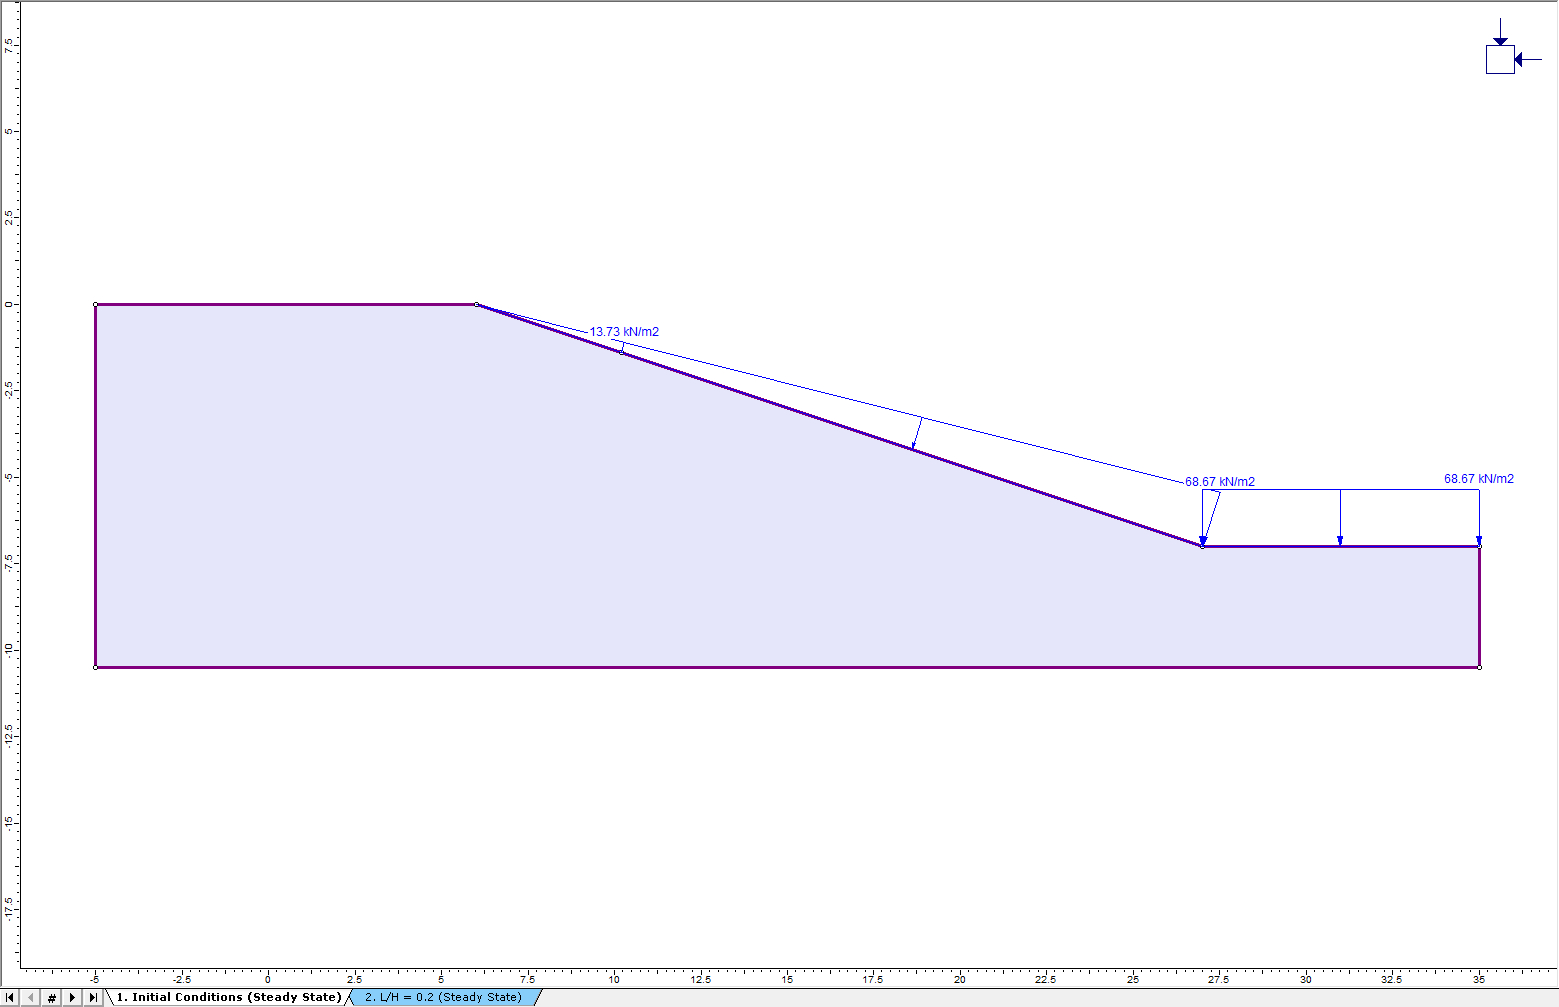
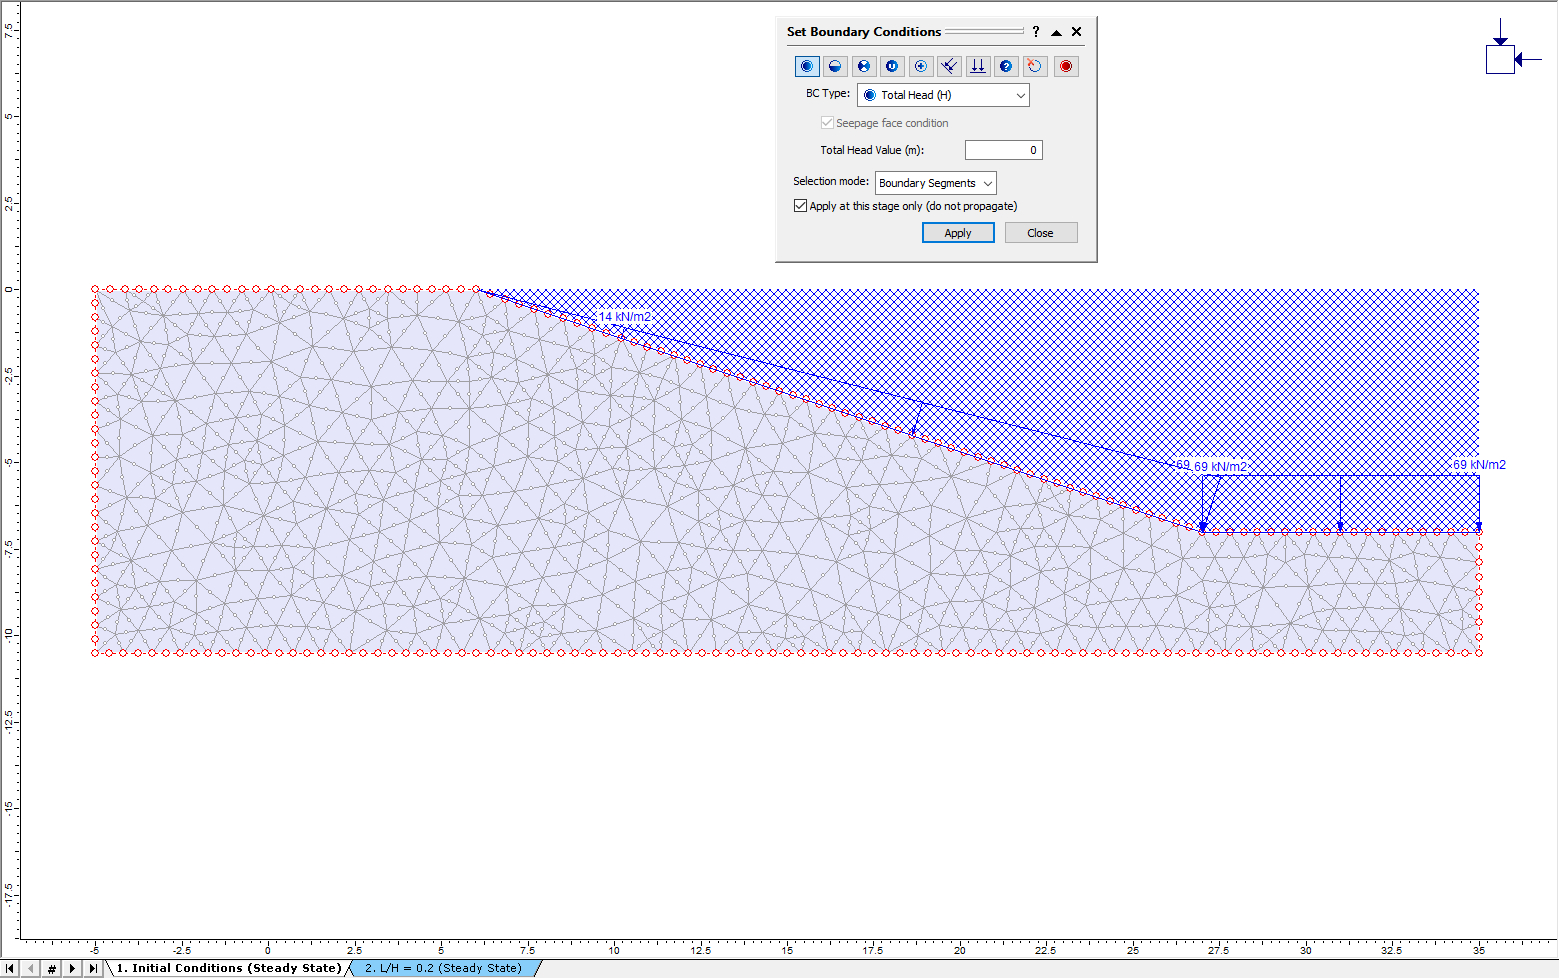
2.5 Loading
![]()
Due to drawdown, it is necessary to apply a ponded water load to the slope.
Click on the tab for Stage 2.
Select: Loading > Ponded Water Load > Add Ponded Water Load.
Select Total Head then check Stage Load.
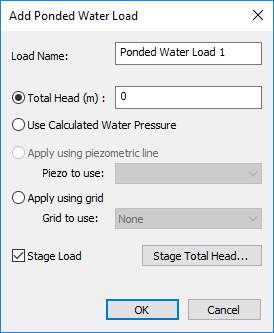
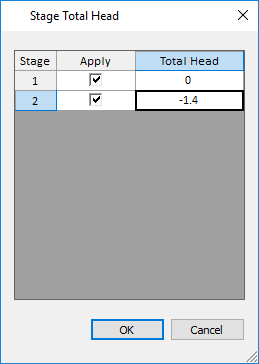
Select Stage Total Head and the dialog should appear.
Enter the Total Head values for the two stages according to the dialog shown below and then click OK to close the dialog.
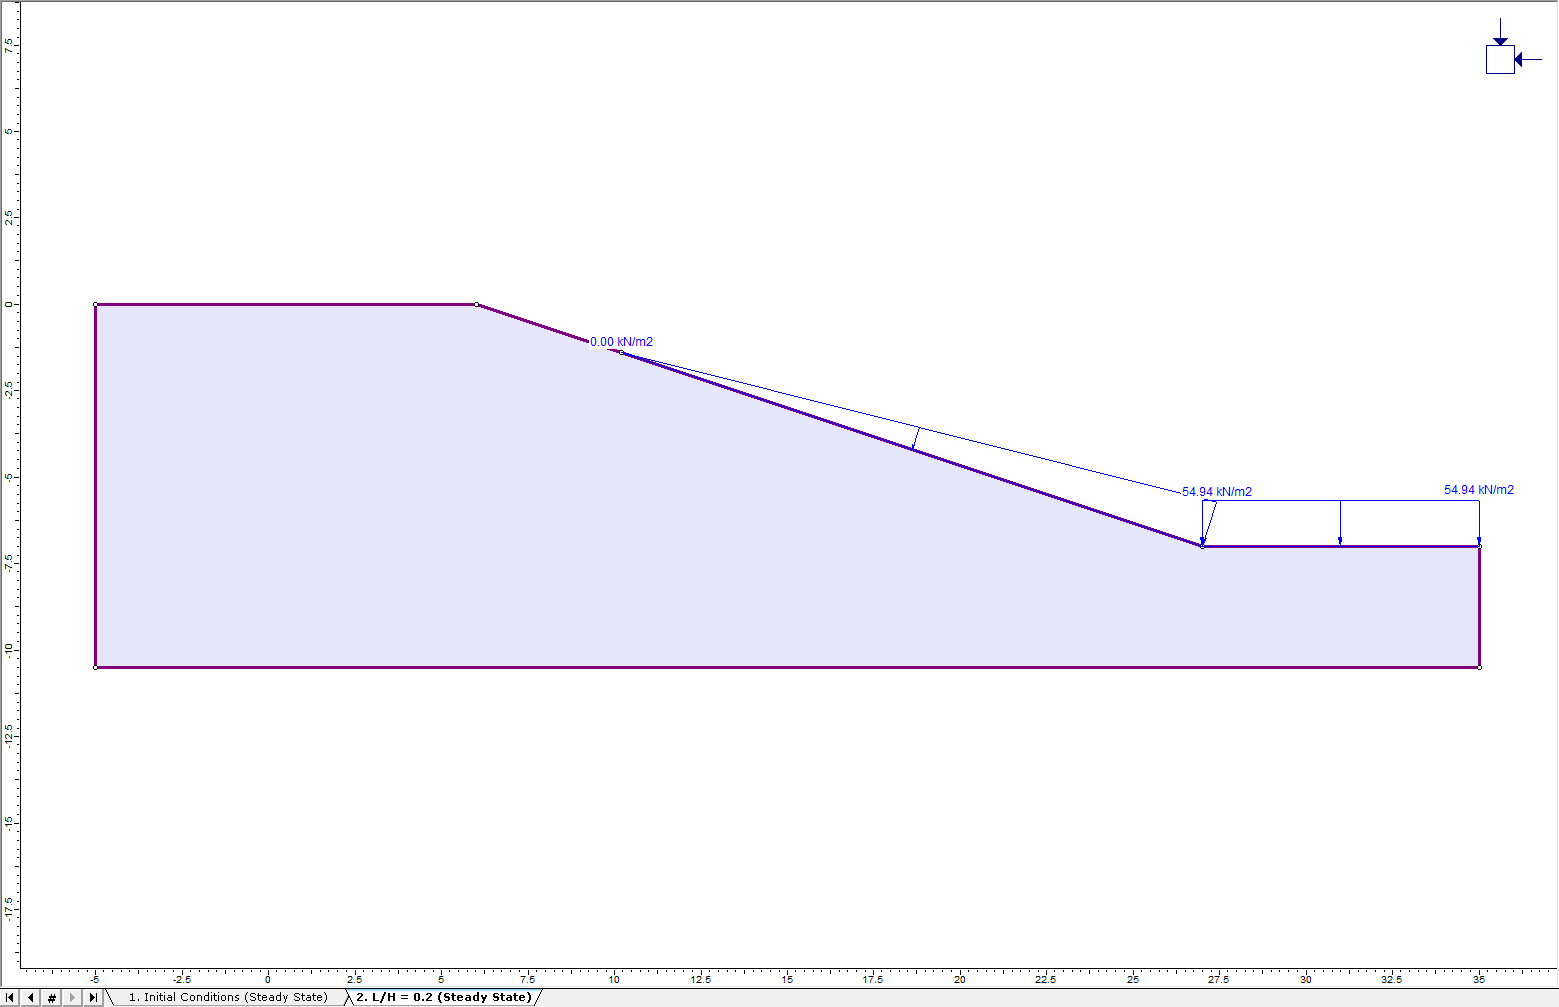
Click OK to close the Add Ponded Water Load dialog. A prompt will appear asking the user to select a boundary on which to apply the load. Select the horizontal and slope sections on the top of the boundary. Press Enter and the model should now have a load that looks like this:
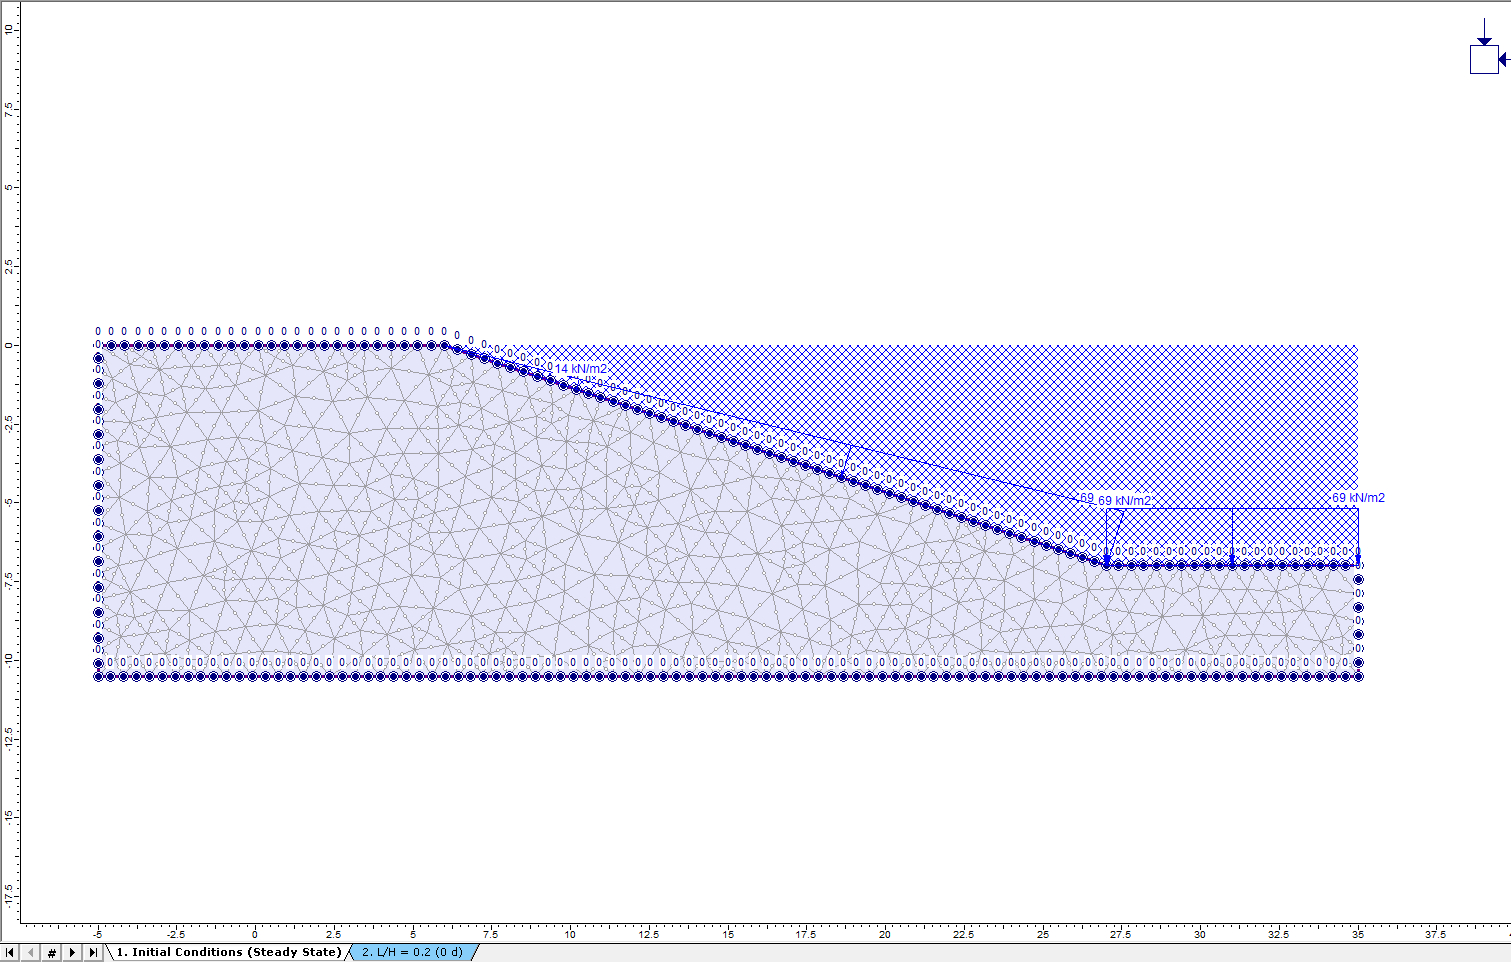
Next, select the Stage 1 tab. Repeat the previous steps until the Stage Total Head dialog appears. Uncheck "Apply" for Stage 2 to account for the change in load with drawdown. The dialog should now look like this:
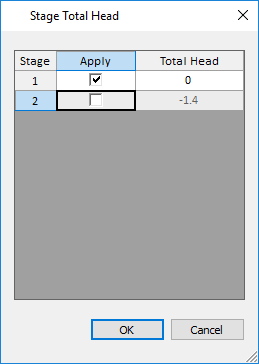
Click OK to close the Add Ponded Water Load dialog. Select the top slope section. Press Enter and the model should now have a load that looks like this:
2.6 Field Stress
Because the top of the model represents the true ground surface, a gravity field stress should be used.
 Select: Loading > Field Stress
For Field Stress Type, select Gravity and click the check box for Use actual ground surface. Leave the values as the default values given.
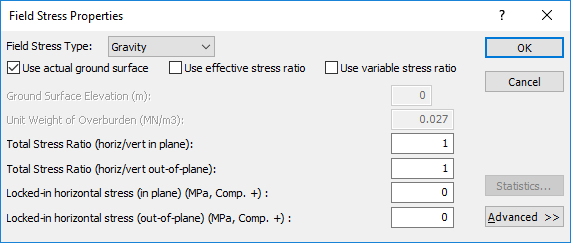
Select: Properties > Define Material Properties and change the Initial Element Loading for Material 1 to Field Stress Only.
Click OK to close the dialog.
2.7 Mesh
![]()
Select the Mesh workflow tab. This tutorial uses a 6-noded finite element mesh type.
 Select: Mesh > Mesh Setup
Let’s use a uniform, 6-noded element mesh. Change the mesh type to Uniform, the element type to 6 Noded Triangles, and the Approximate Number of Mesh Elements to 1000:
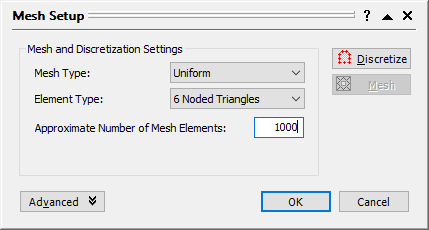
Click the Discretize button and then the Mesh button. Click OK to close the dialog. The mesh will look like this:
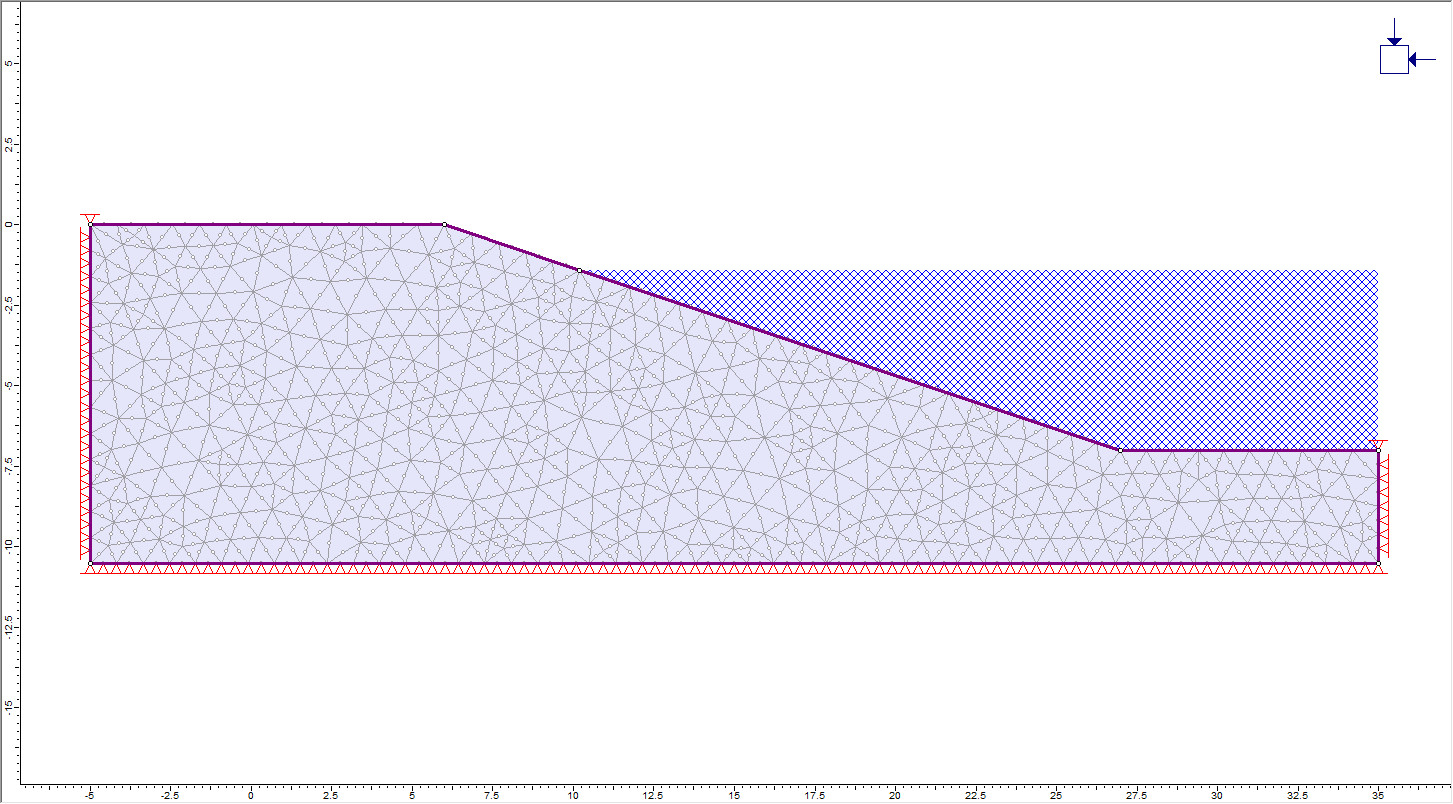
2.8 Groundwater

Since there are no liners or additional reinforcement in the model, skip the Support tab and move on to the Groundwater tab. Let’s model the drawdown along the slope between the two stages.
![]() Select: Groundwater > Set Boundary Conditions
Select: Groundwater > Set Boundary Conditions
In the Groundwater Boundary Condition dialog:
- Select the Stage 1 tab. From the BC Type drop-down menu, select Total Head (H).
- Enter a Total Head Value (m) of 0 meters.
- Selection mode is enabled. Ensure that Apply at this stage only is checked. Let’s apply the Total Head boundary condition to all boundaries, so select over the entire model.
When the selection looks like the model above, click “Apply” from the Add Boundary Conditions dialog and then close the dialog.
- Now move onto the next stage and select the Stage 2 tab. From the BC Type drop-down menu, select Total Head (H) and enter a Total Head Value (m) of -1.4 meters.
- Select the right vertical boundary, the adjacent horizontal boundary.
Click "Apply" and then close the dialog.
The two stages of the model should have groundwater conditions shown in the following models.
Stage 1:
Stage 2:
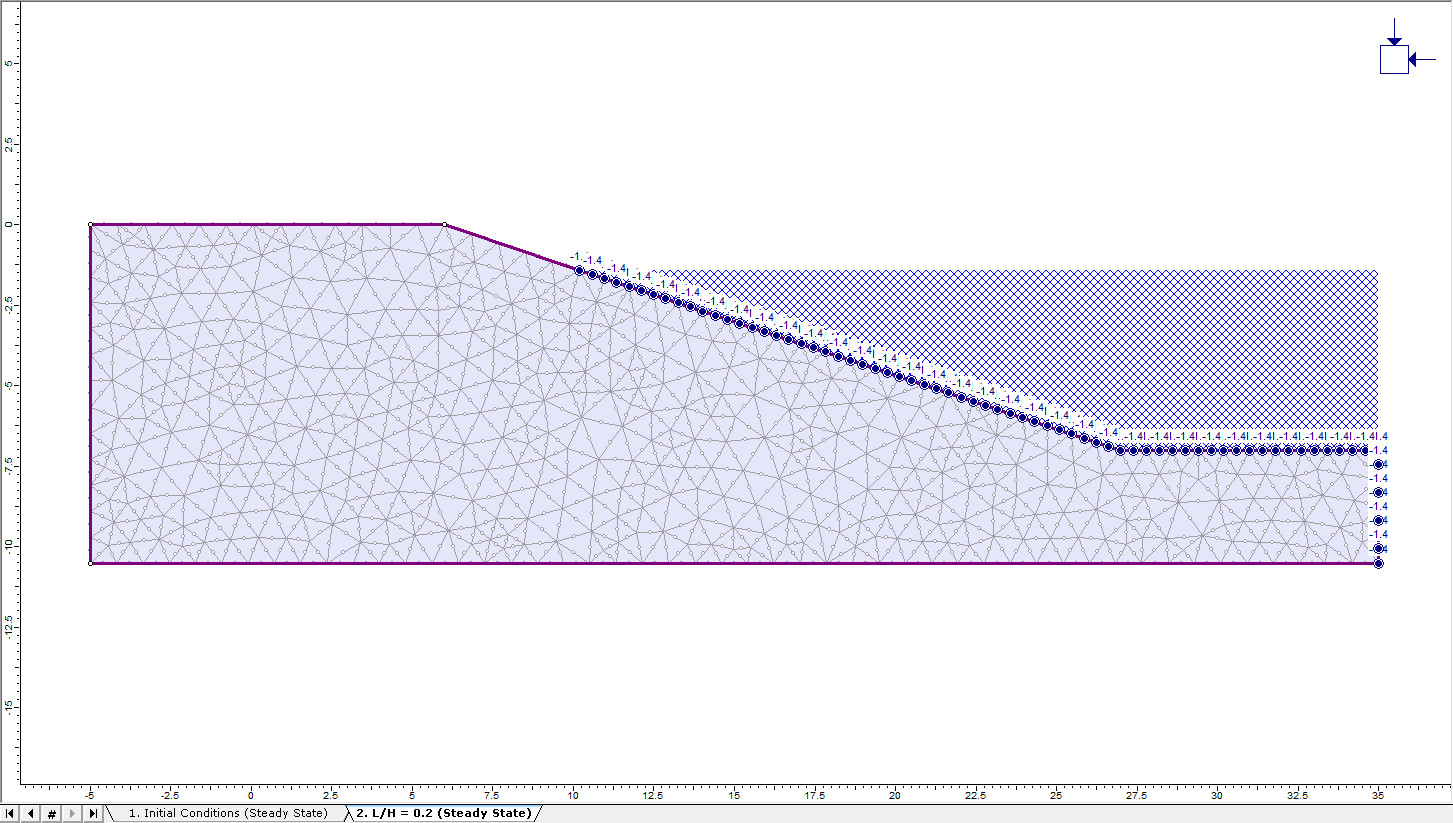
Notice the change in water level from an elevation of 0m to -1.4m, corresponding to L = -1.4m, with regards to the drawdown ratio (L/H) of 0.2.
2.9 Restraints
![]()
By default, all segments of the external boundary are fixed. Since the top of this model represents a free surface, it is necessary free the top surface.
Select: Displacements > Free. Click on the four sections that make up the top external boundary and press Enter. The fixed boundary conditions have disappeared from the top external boundaries. Let’s re-establish the fixed boundary condition on the top corners. Select: Displacements > Restrain X, Y. Select the left and right vertical boundaries (right-click and select "Pick by Vertices" from the pop-up menu) and press Enter.
The model should look like this:
The definition of the fully drained model is now complete. Save the model specifying it as the Fully Drained Example using File > Save.
To create the models for the other drawdown ratios, simply change the vertex location to the corresponding depth as well as the groundwater boundary conditions and loading, outlined in the table below:
| Drawdown Ratio (L/H) | Drawdown Depth (m) |
| 0.2 | -1.4 |
| 0.4 | -2.8 |
| 0.6 | -4.2 |
| 0.8 | -5.6 |
| 1.0 | -7 |
Additionally, to determine the slope factor of safety for initial condition (L/H = 0), simply take any of the drainage models and delete the second stage to conduct shear strength reduction for the initial stage.
2.10 Drained
To model the drained example, all steps remain the same as that of the fully drained example, except for the change in time and the change in drainage condition.
The following steps outline the drainage conditions and time for each drawdown ratio depending on the drawdown rate.
R = 0.1 m/day
| Name | Time (days) | Drained? |
| Initial Conditions | 0 | Drained |
| L/H= 0.2 | 14 | Drained |
| L/H= 0.4 | 28 | Drained |
| L/H= 0.6 | 42 | Drained |
| L/H= 0.8 | 56 | Drained |
| L/H= 1.0 | 70 | Drained |
R = 0.25 m/day
| Name | Time (days) | Drained? |
| Initial Conditions | 0 | Drained |
| L/H= 0.2 | 5.6 | Drained |
| L/H= 0.4 | 11.2 | Drained |
| L/H= 0.6 | 16.8 | Drained |
| L/H= 0.8 | 22.4 | Drained |
| L/H= 1.0 | 28 | Drained |
R = 0.5 m/day
| Name | Time (days) | Drained? |
| Initial Conditions | 0 | Drained |
| L/H= 0.2 | 2.8 | Drained |
| L/H= 0.4 | 5.6 | Drained |
| L/H= 0.6 | 8.4 | Drained |
| L/H= 0.8 | 11.2 | Drained |
| L/H= 1.0 | 14 | Drained |
R = 0.75 m/day
| Name | Time (days) | Drained? |
| Initial Conditions | 0 | Drained |
| L/H= 0.2 | 1.867 | Drained |
| L/H= 0.4 | 3.733 | Drained |
| L/H= 0.6 | 5.6 | Drained |
| L/H= 0.8 | 7.467 | Drained |
| L/H= 1.0 | 9.333 | Drained |
R = 1.0 m/day
| Name | TIme (days) | Drained? |
| Initial Conditions | 0 | Drained |
| L/H= 0.2 | 1.4 | Drained |
| L/H= 0.4 | 2.8 | Drained |
| L/H= 0.6 | 4.2 | Drained |
| L/H= 0.8 | 5.6 | Drained |
| L/H= 1.0 | 7 | Drained |
2.11 Undrained
For the undrained example, select the Stages tab and change the number of stages to 2. Change the staging information to the following:
Close the dialog by clicking OK.
All other steps, including Materials, Mesh, Loading, and Restraints, follow those outlined for the Fully Drained example, except the groundwater boundary conditions.
2.12 Groundwater
![]()
 Select: Groundwater > Set Boundary Conditions
To simulate undrained conditions, groundwater boundaries are only applied to the first stage, outline below:
- Select: Stage 1 tab. Select: BC Type > Total Head (H).
- Enter a Total Head Value (m) of 0 meters.
- The selection mode is now enabled. Ensure that Apply at this stage only is checked. Apply the Total Head boundary condition to all boundaries by selecting over the entire model.
When the selection looks like the model above, click “Apply” from the Add Boundary Conditions dialog and then close the dialog. The model for both stages should now look like this:
Stage 1:
Stage 2:
3.0 Compute
 Select: Analysis > Compute
The analysis should take several minutes to run.
4.0 Results and Discussion
![]()
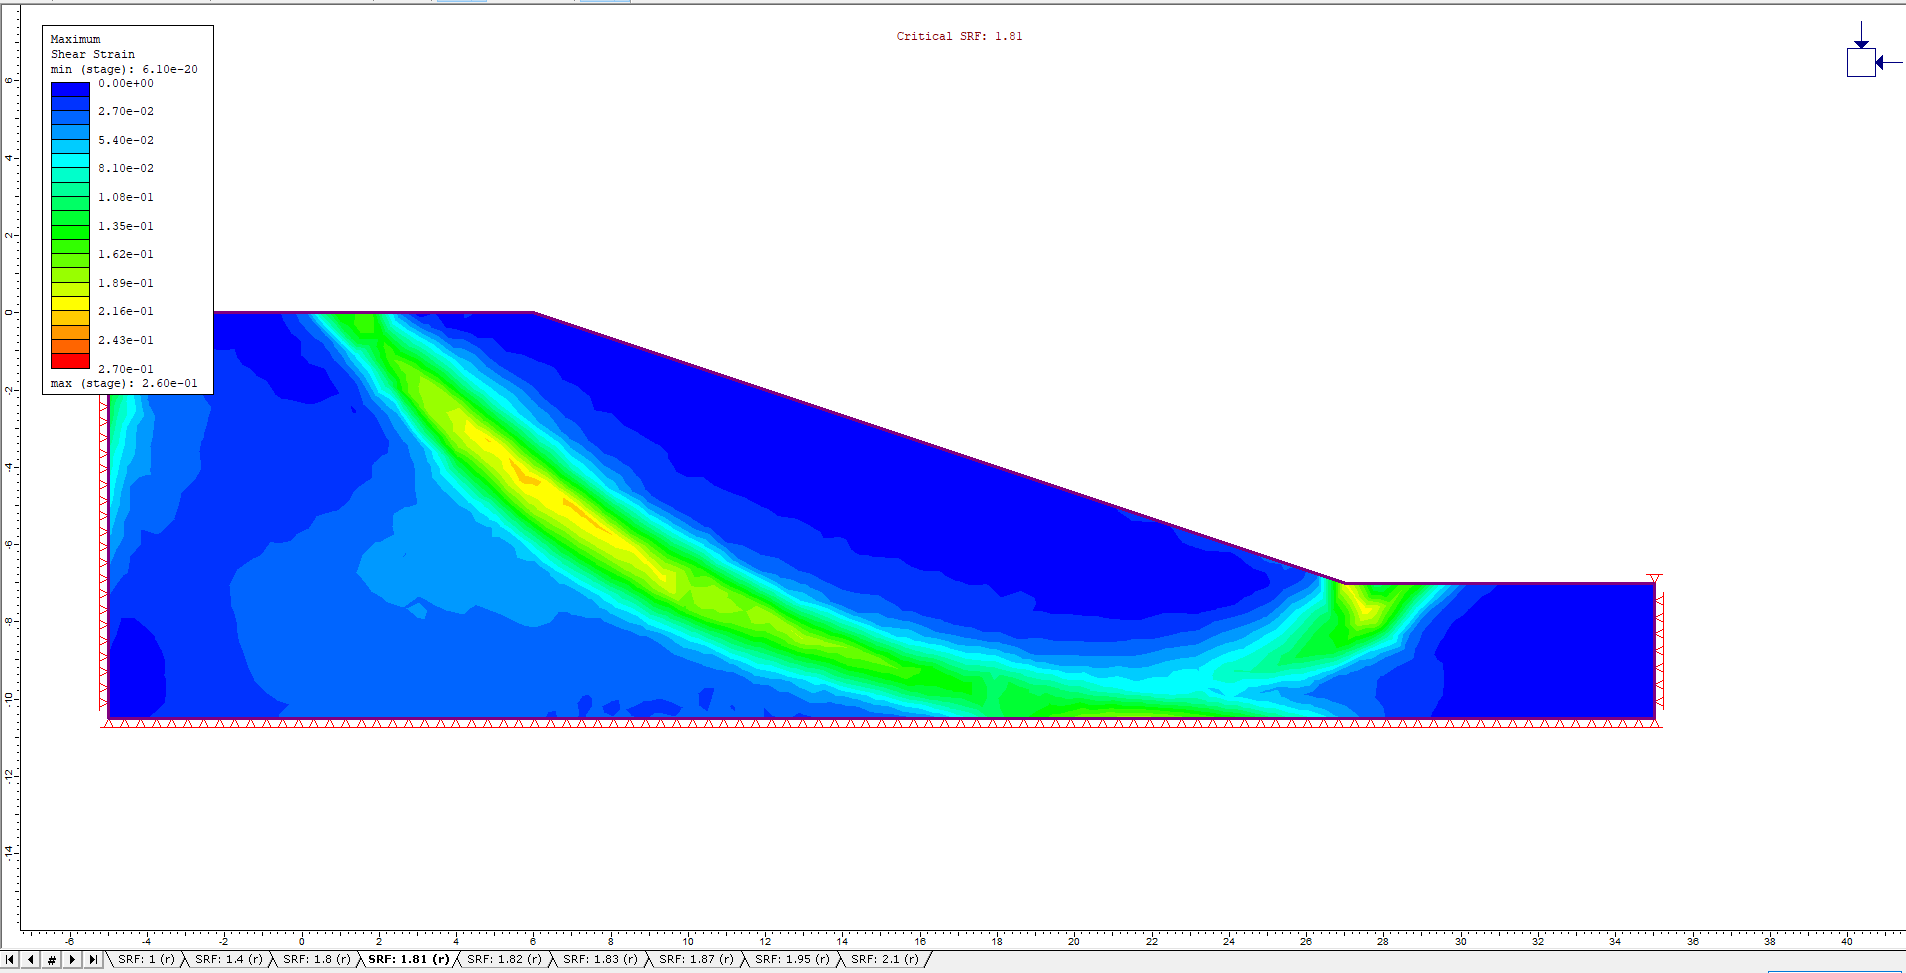
4.1 Maximum Shear Strain
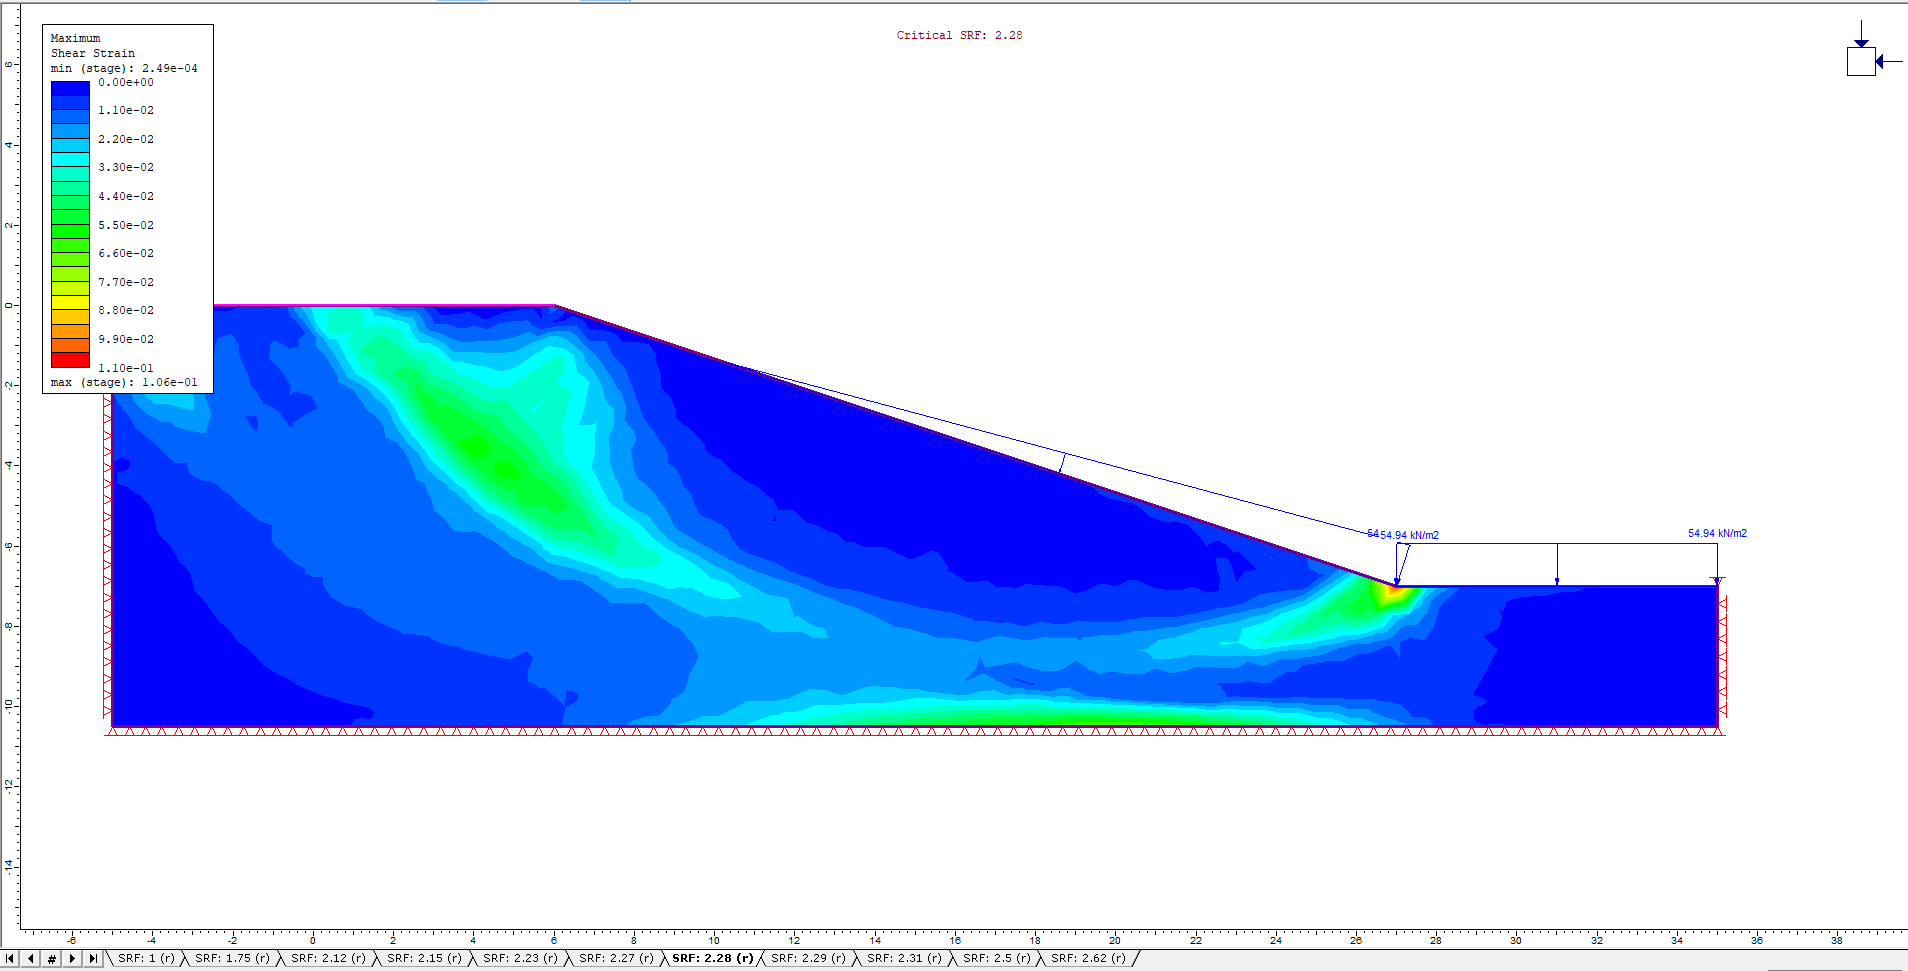
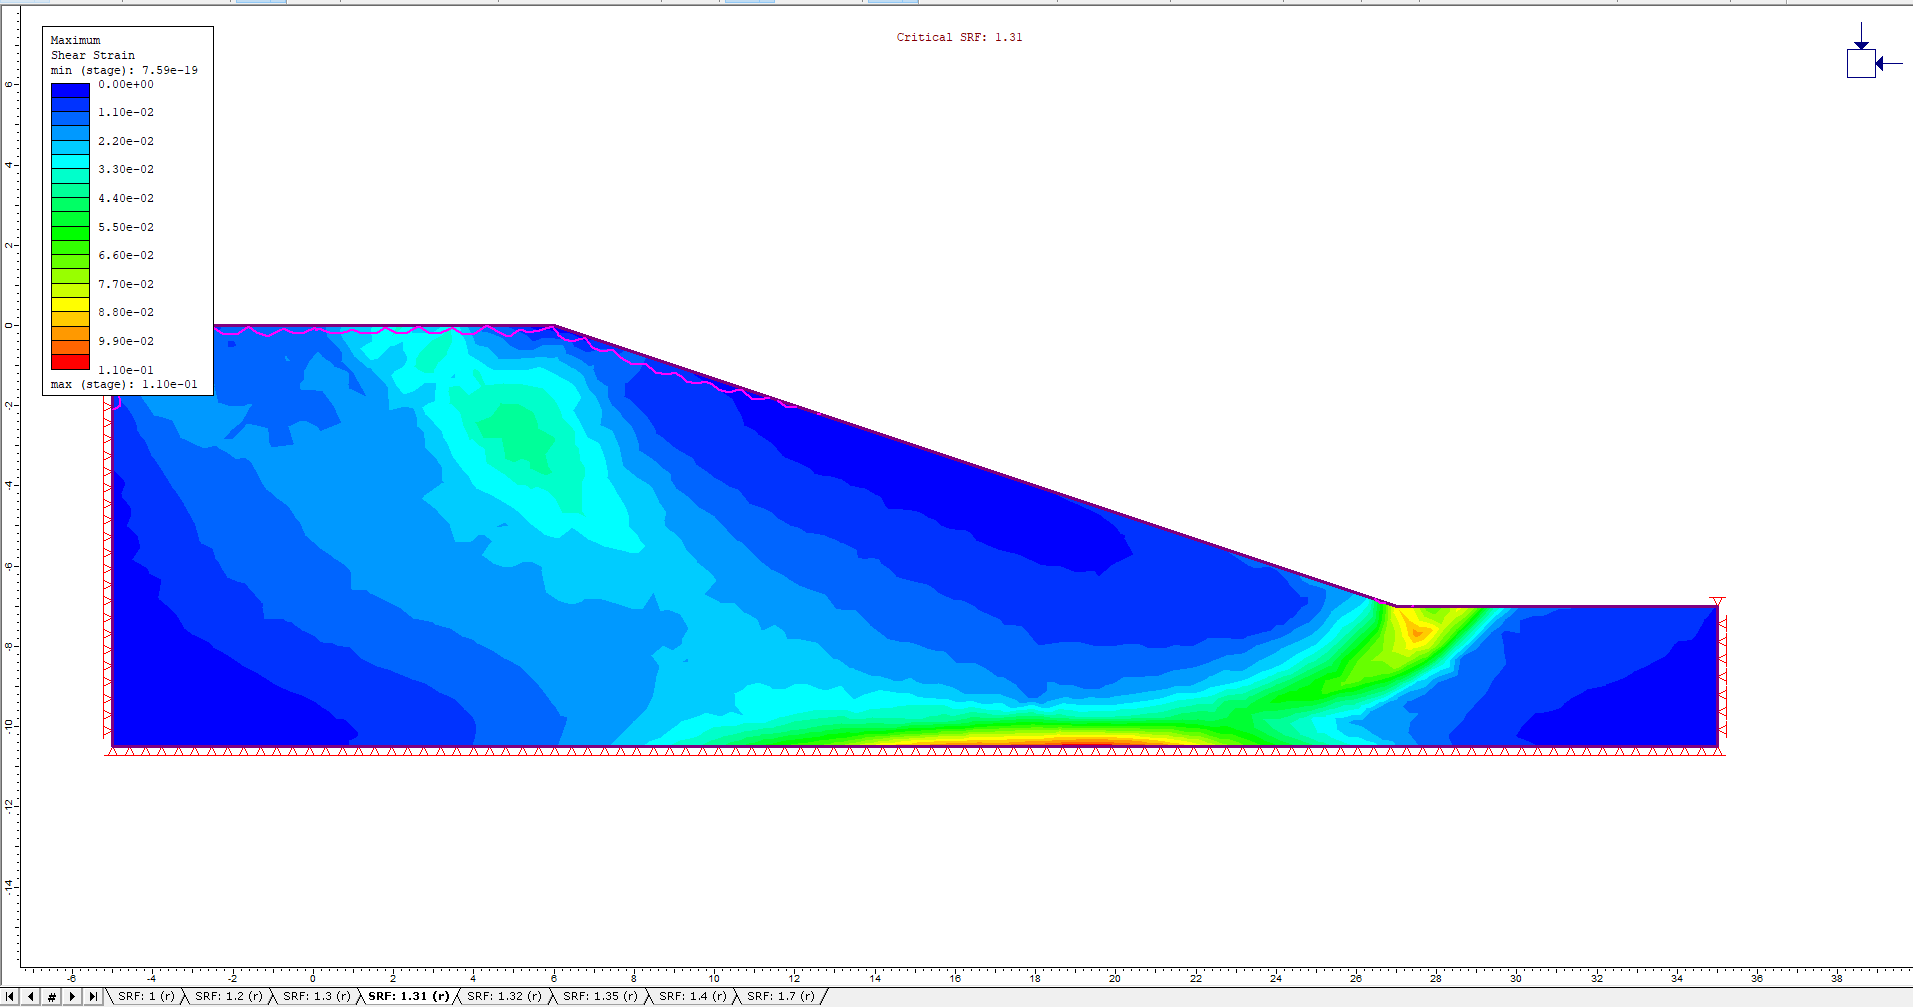
The Fully Drained Maximum Shear Strain contours and Critical SRF values for the different drawdown ratios are shown in the figures below:
L/H = 0.2
L/H = 0.4
L/H = 0.6

L/H = 0.8
L/H = 1.0
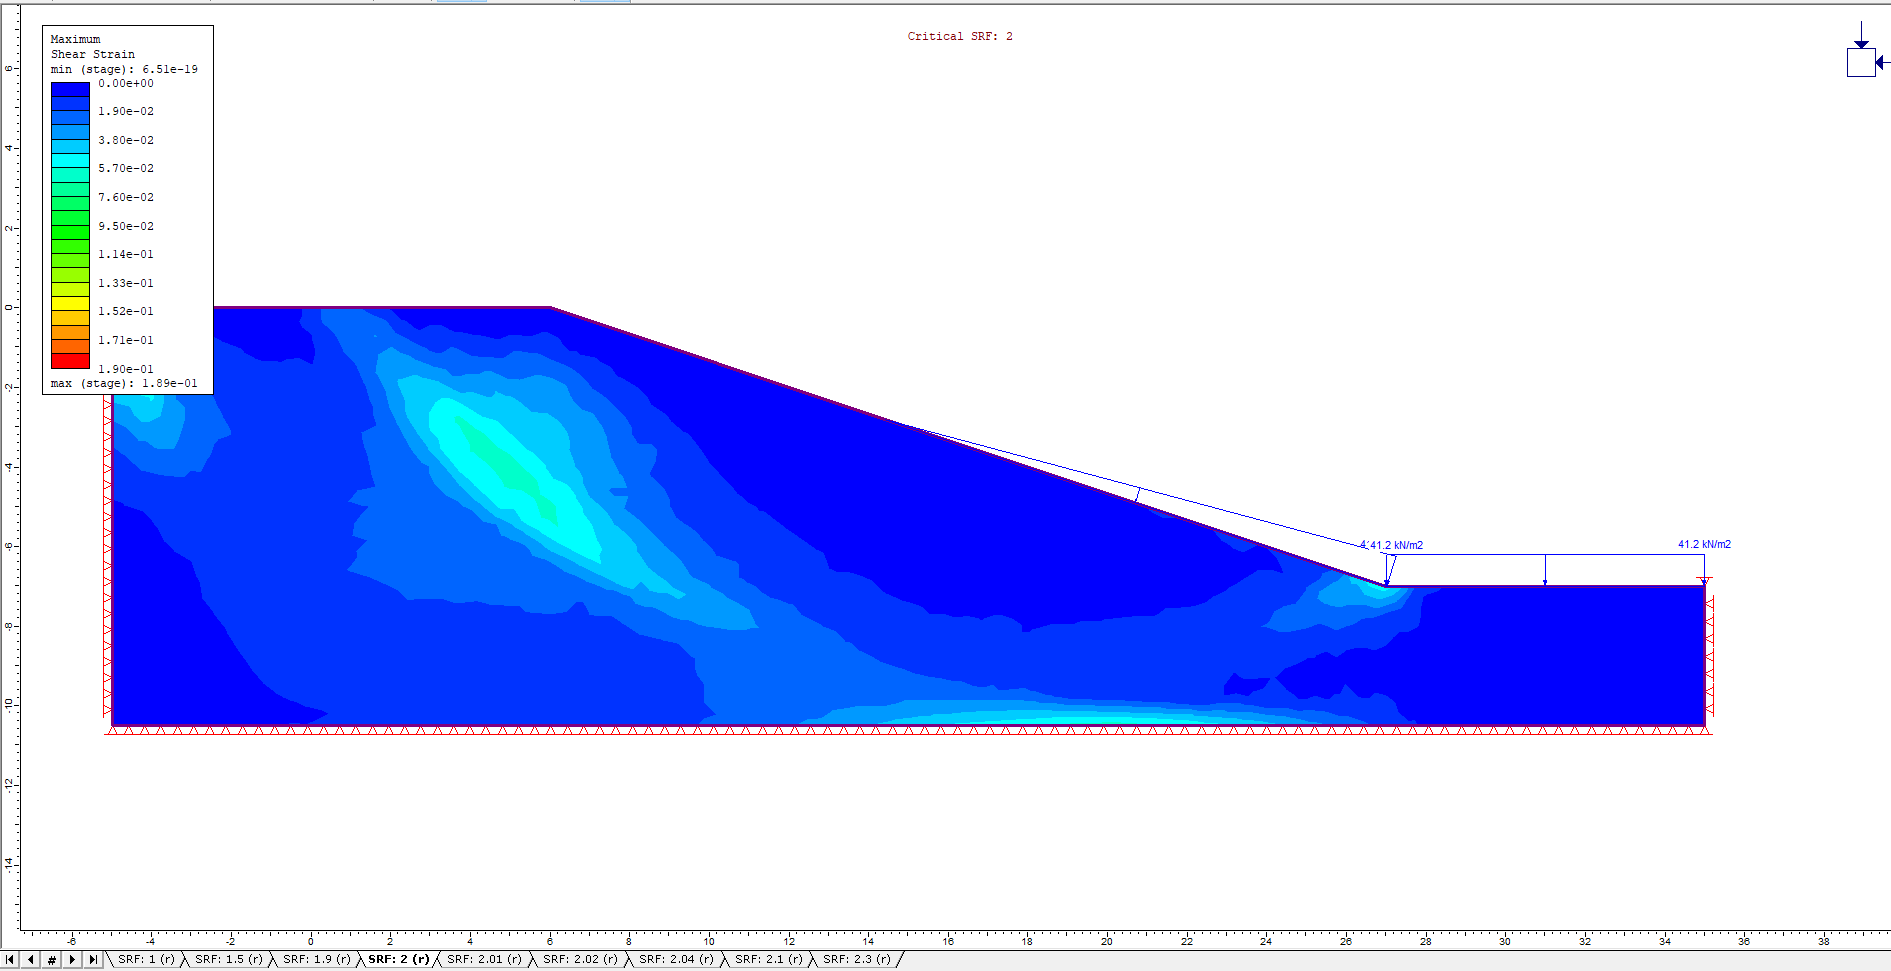
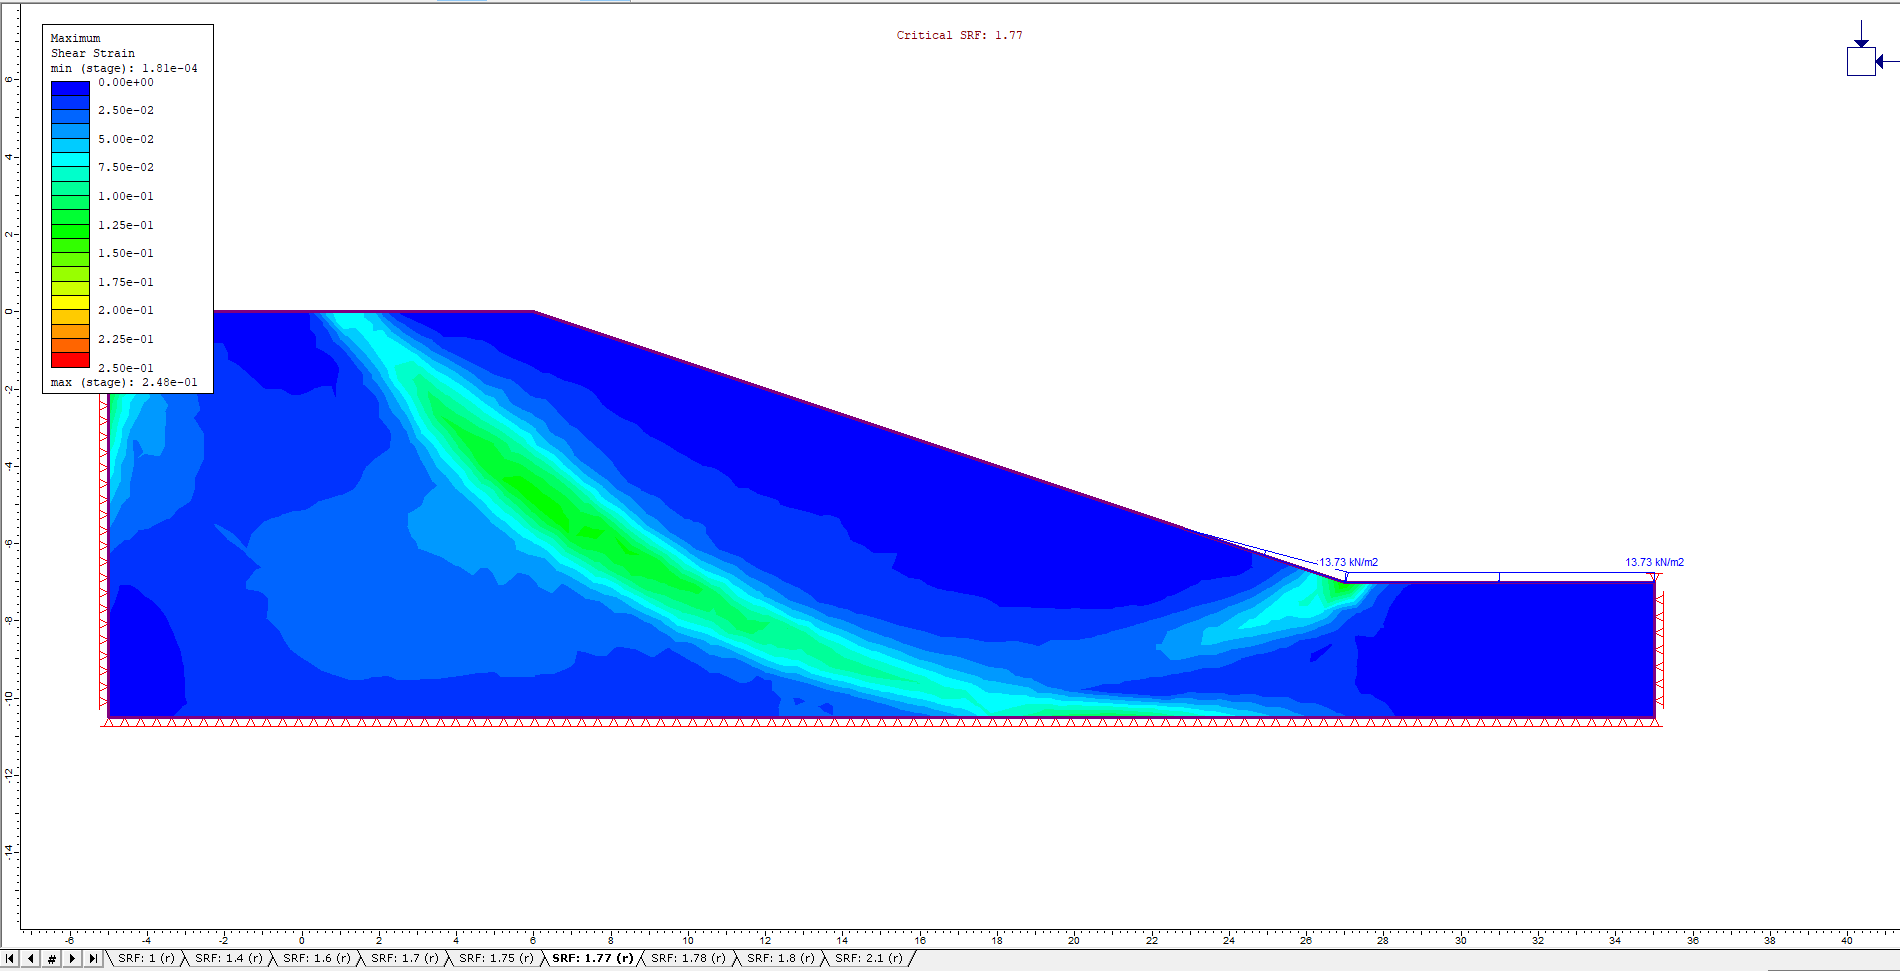
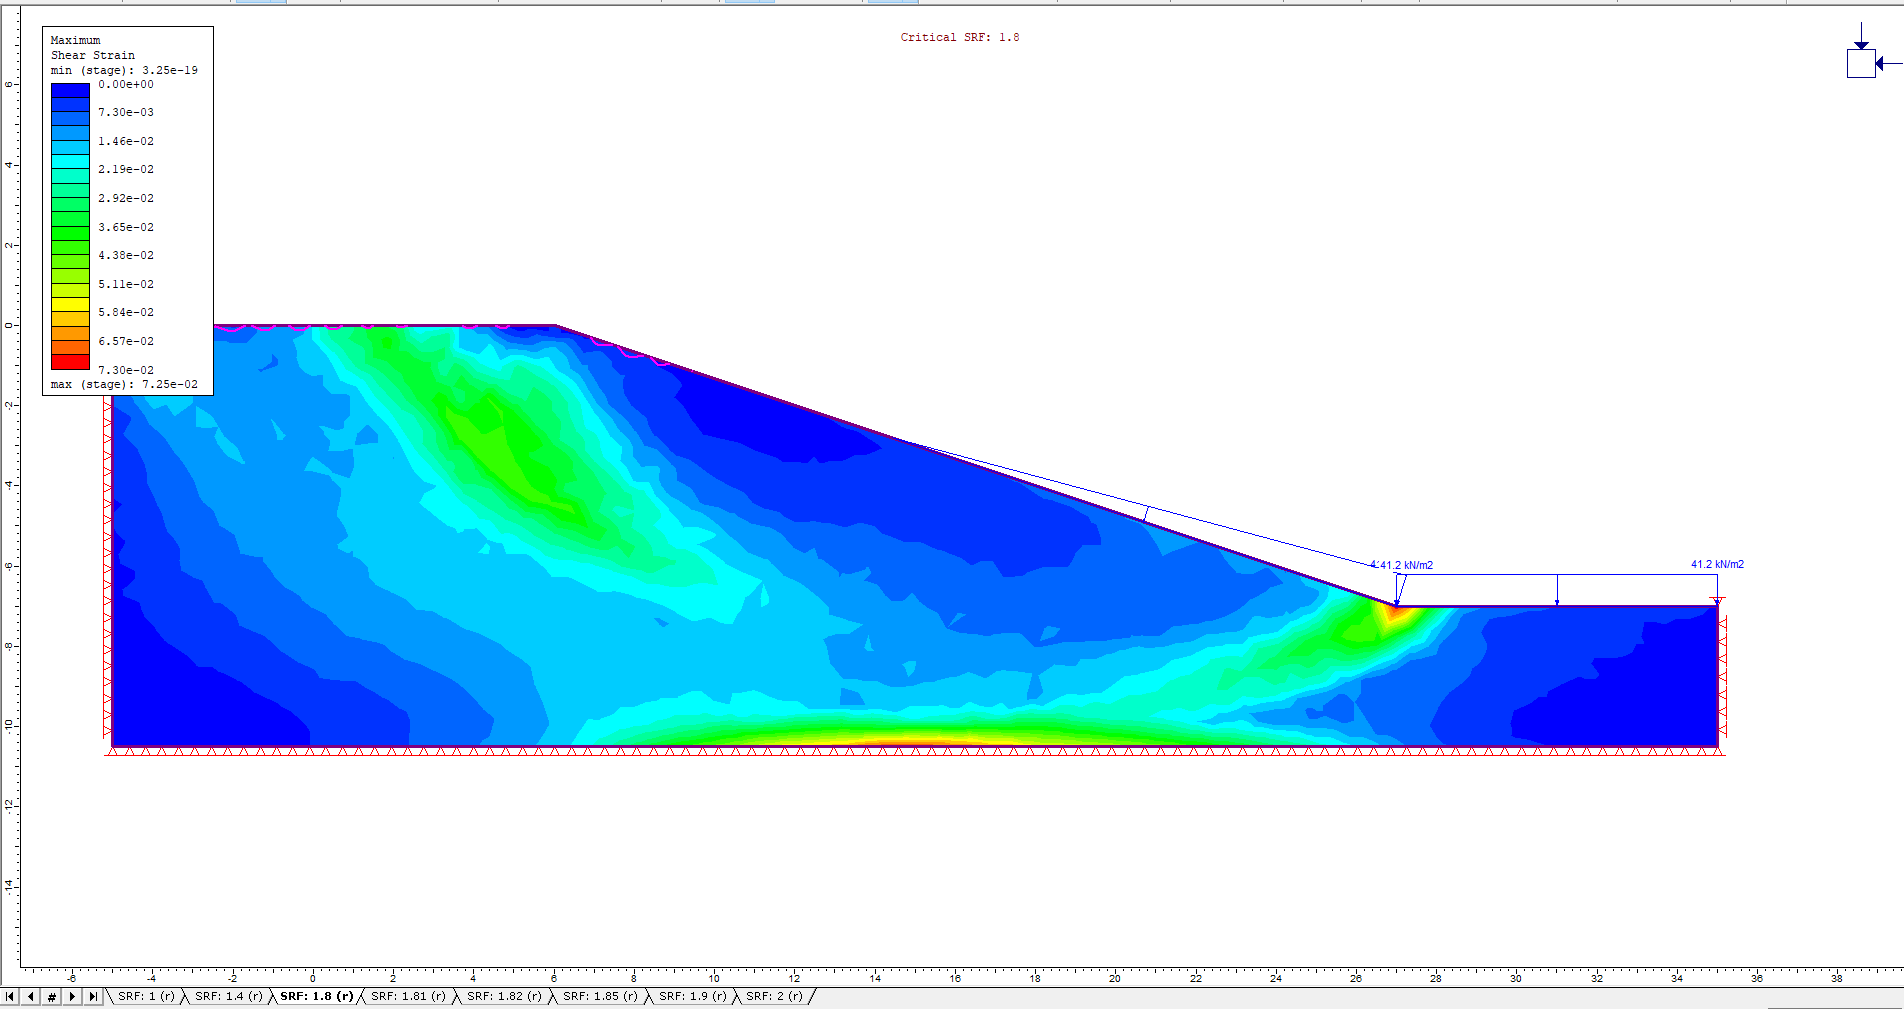
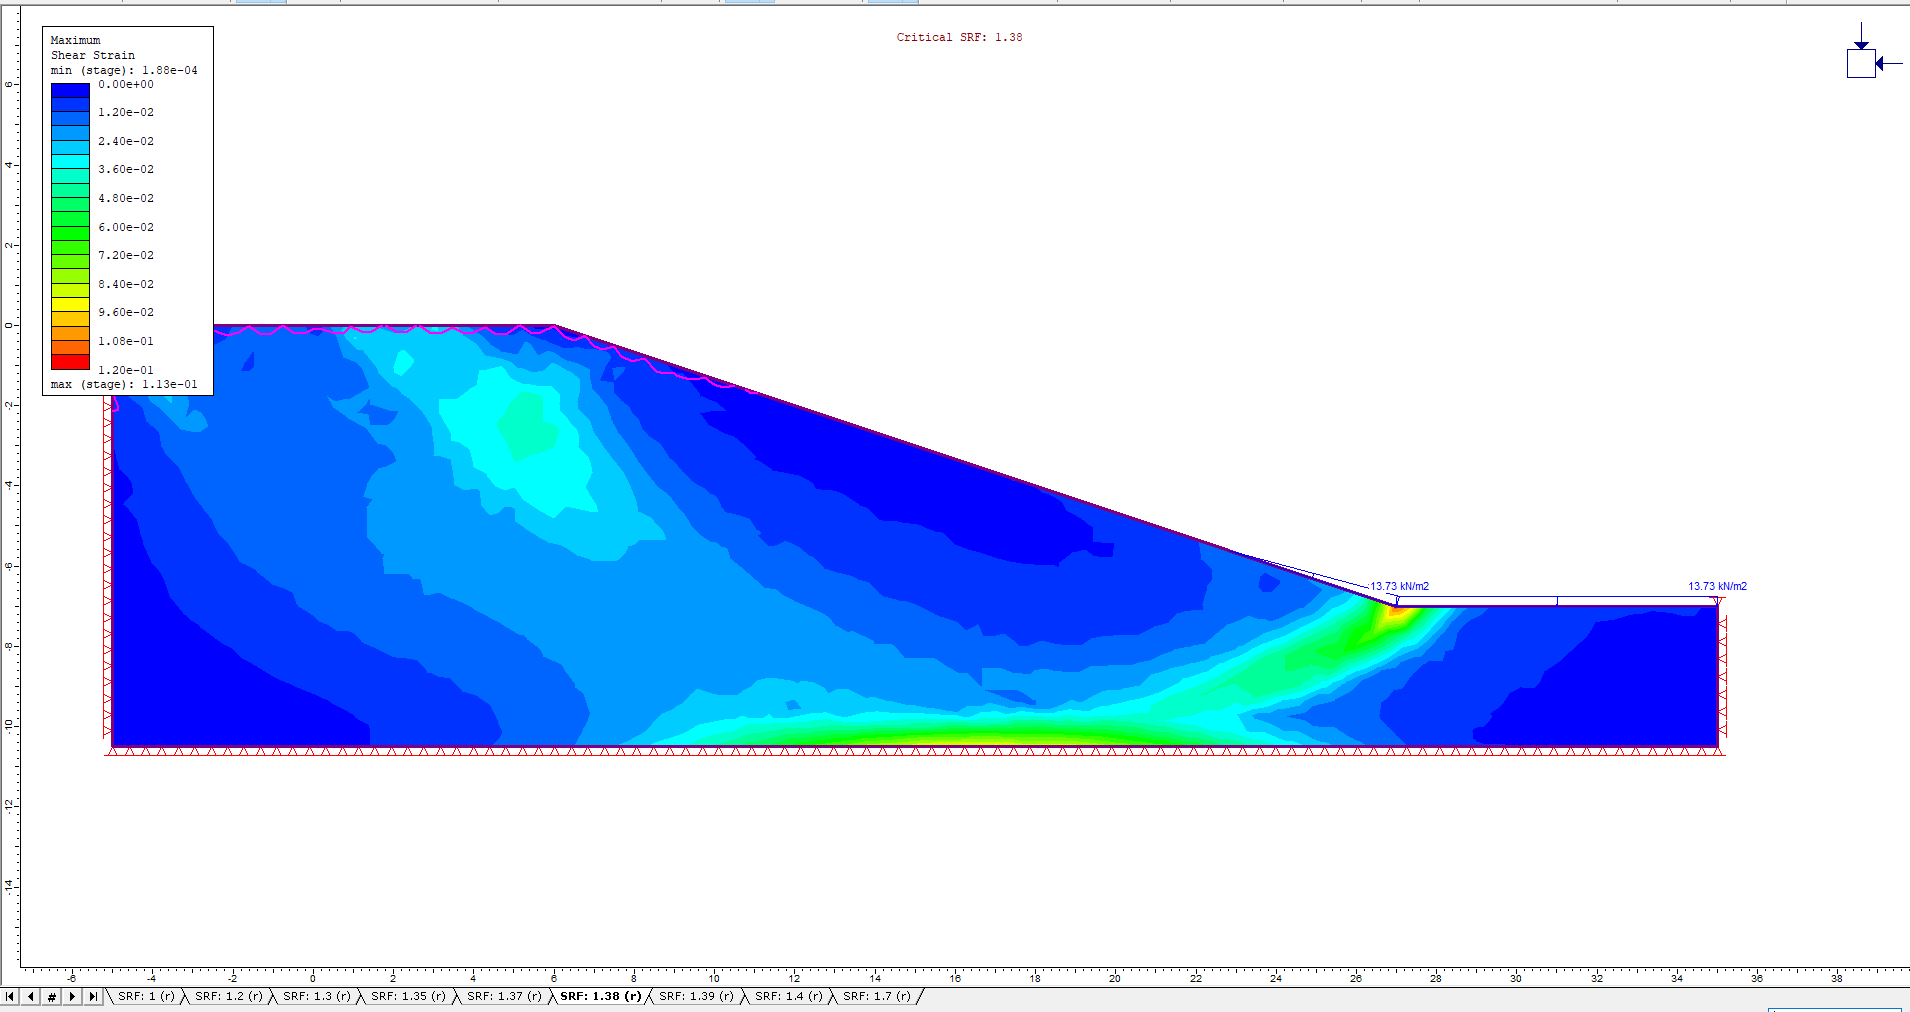
Additionally, the Undrained Maximum Shear Strain contours and Critical SRF values for the different drawdown ratios are shown in the figures below:
L/H = 0.2
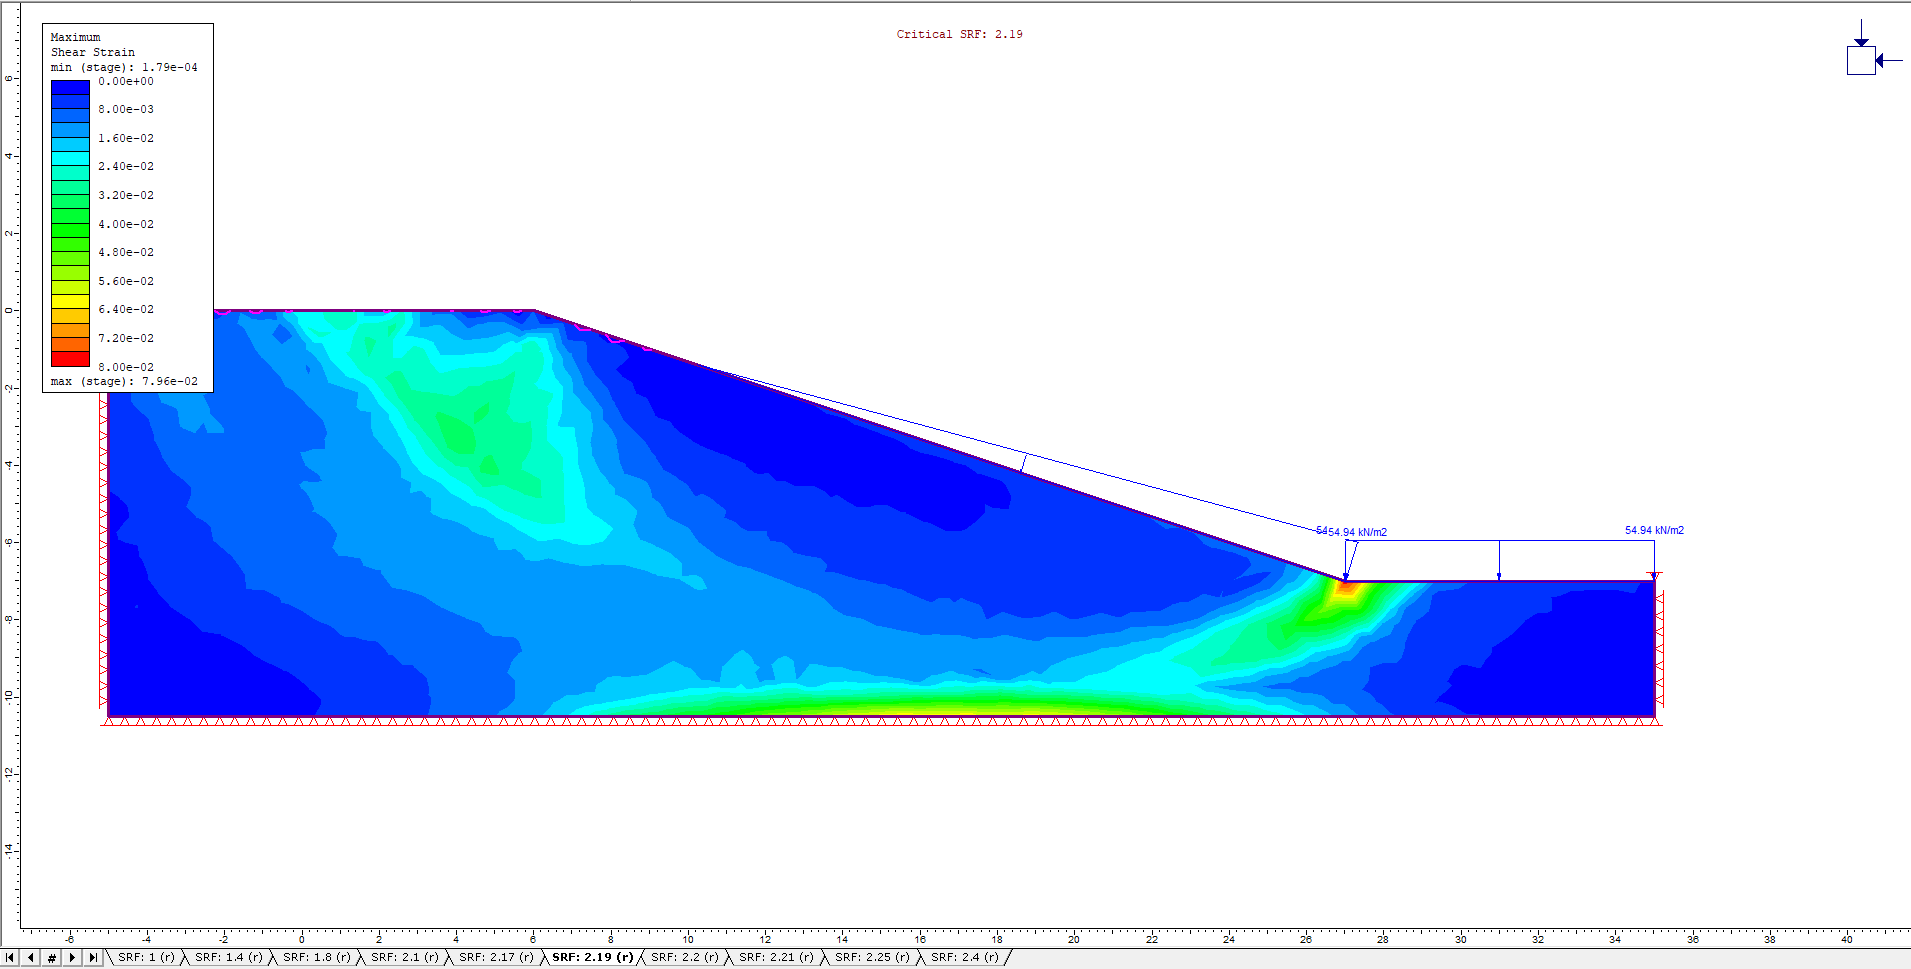
L/H = 0.4
L/H = 0.6

L/H = 0.8
L/H = 1.0
4.2 Strength Reduction Factor
To analyze the change in Strength Reduction Factor due to drawdown, the following graph was developed based on model results for the three different drainage cases:
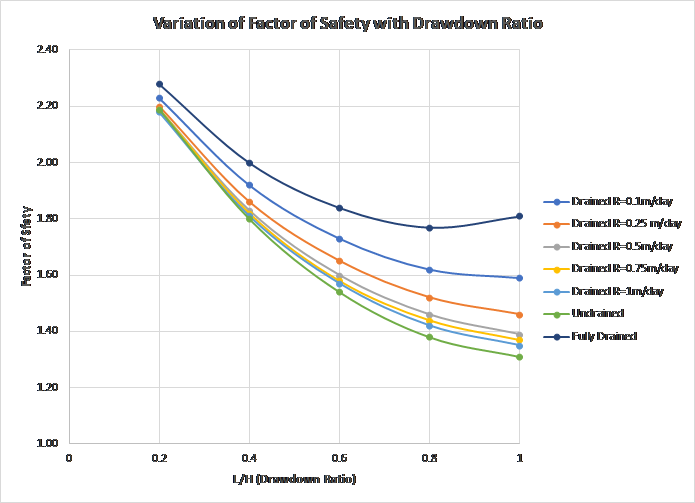
The factor of safety values for the Fully Drained model are higher than the other two drainage conditions due to the slow drawdown. The undrained model has the lowest factor of safety values, as this boundary condition simulates rapid drawdown causing a decrease in slope stability, as outlined at the beginning of this tutorial.
Finally, it can be seen the factor of safety values for the Drained models for the different drawdown rates are all within the envelope of the two extreme drainage conditions - Fully Drained and Undrained. The factor of safety values decreases closer to that of the Undrained example as the drawdown rate increases, concluding that the more rapid the drawdown rate along a slope, the less stable the slope becomes.
This concludes the Coupled Drawdown Analysis Tutorial.