Shear Strength Reduction (SSR)
1.0 Introduction
In this tutorial, RS2 is used to determine the safety factor of a simple homogeneous slope using the shear strength reduction (SSR) method. The tutorial focuses on interpreting data after an SSR analysis has been performed. The model file for this tutorial has an external boundary, mesh, boundary conditions, and field stress defined. To run an SSR analysis, "Determine Strength Reduction Factor" was turned on in the Strength Reduction tab of Project Settings.
For additional information about how to build a model for SSR analysis, see the SSR analysis help topic.
2.0 Compute the Model
- Select: File > Recent Folders > Tutorial Folder
- Open the Shear Strength Reduction Analysis starting file.
- Select Analysis > Compute
 to compute the model.
3.0 Results and Discussion
- Select: Analysis > Interpret

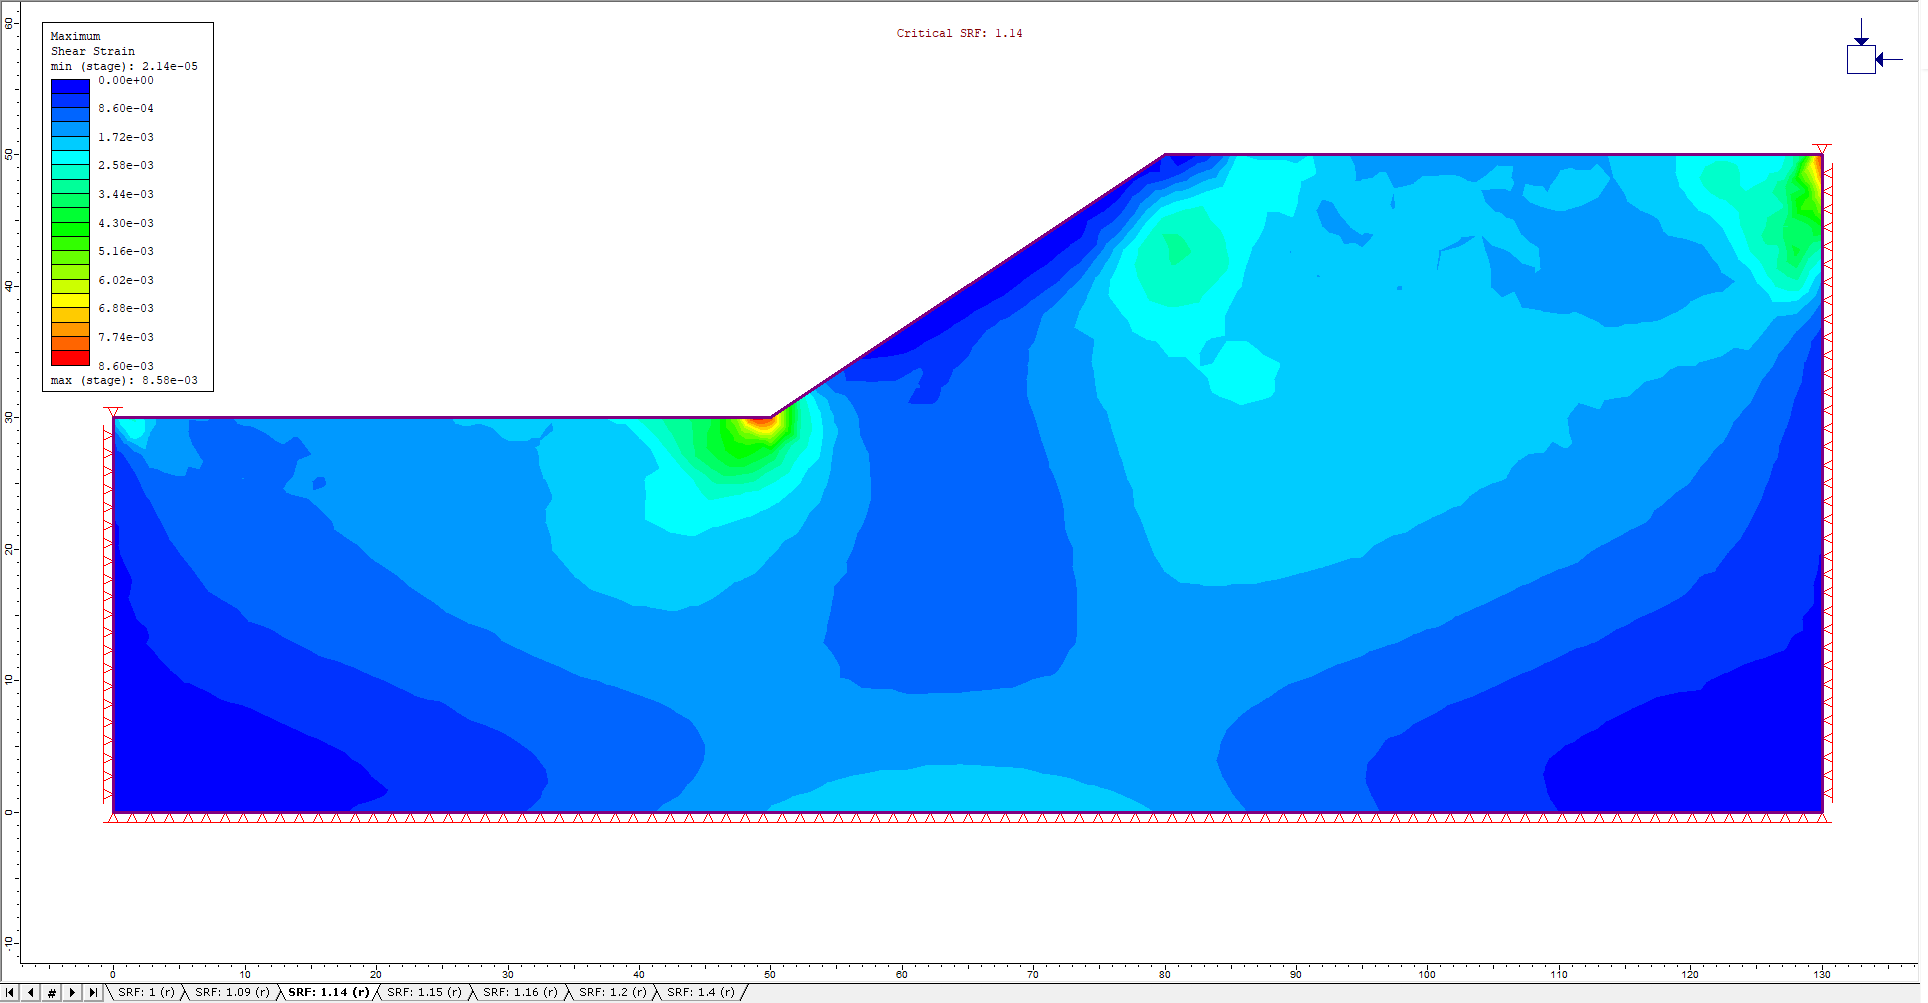
Note the different values of SRF in the tabs along the bottom of the screen. The tab that is selected by default is the critical SRF. By default, the maximum shear strain dataset is selected and contoured. Maximum shear strain gives a good indication of where slip is occurring, especially when viewing higher SRF values.
Cycling through the various SRF tabs gives a good indication of the progression of failure through the slope as the shear strength is reduced.
Now switch to SRF: 1. Another useful feature is the ability to animate the progression of failure.
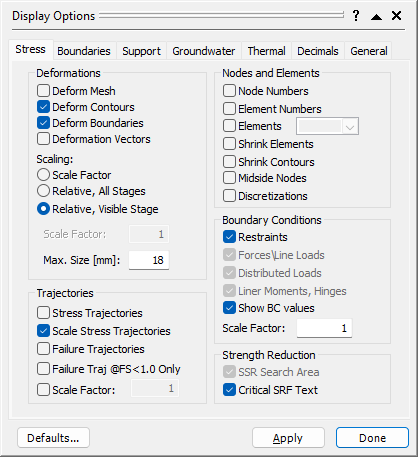
- Select: View > Display Option
- Choose the Stress tab. Turn on the Deform Contours and Deform Boundaries options.
- Select Scale Factor and enter Scale Factor = 1.
- Select Done to save and exit the dialog.
Display Options Dialog - Select: Data > Animate Tabs
- Pressing Esc will stop the animation.
The timing of the Animation can be specified in the Stage Settings dialog in the Data menu. - Pressing Esc will stop the animation.
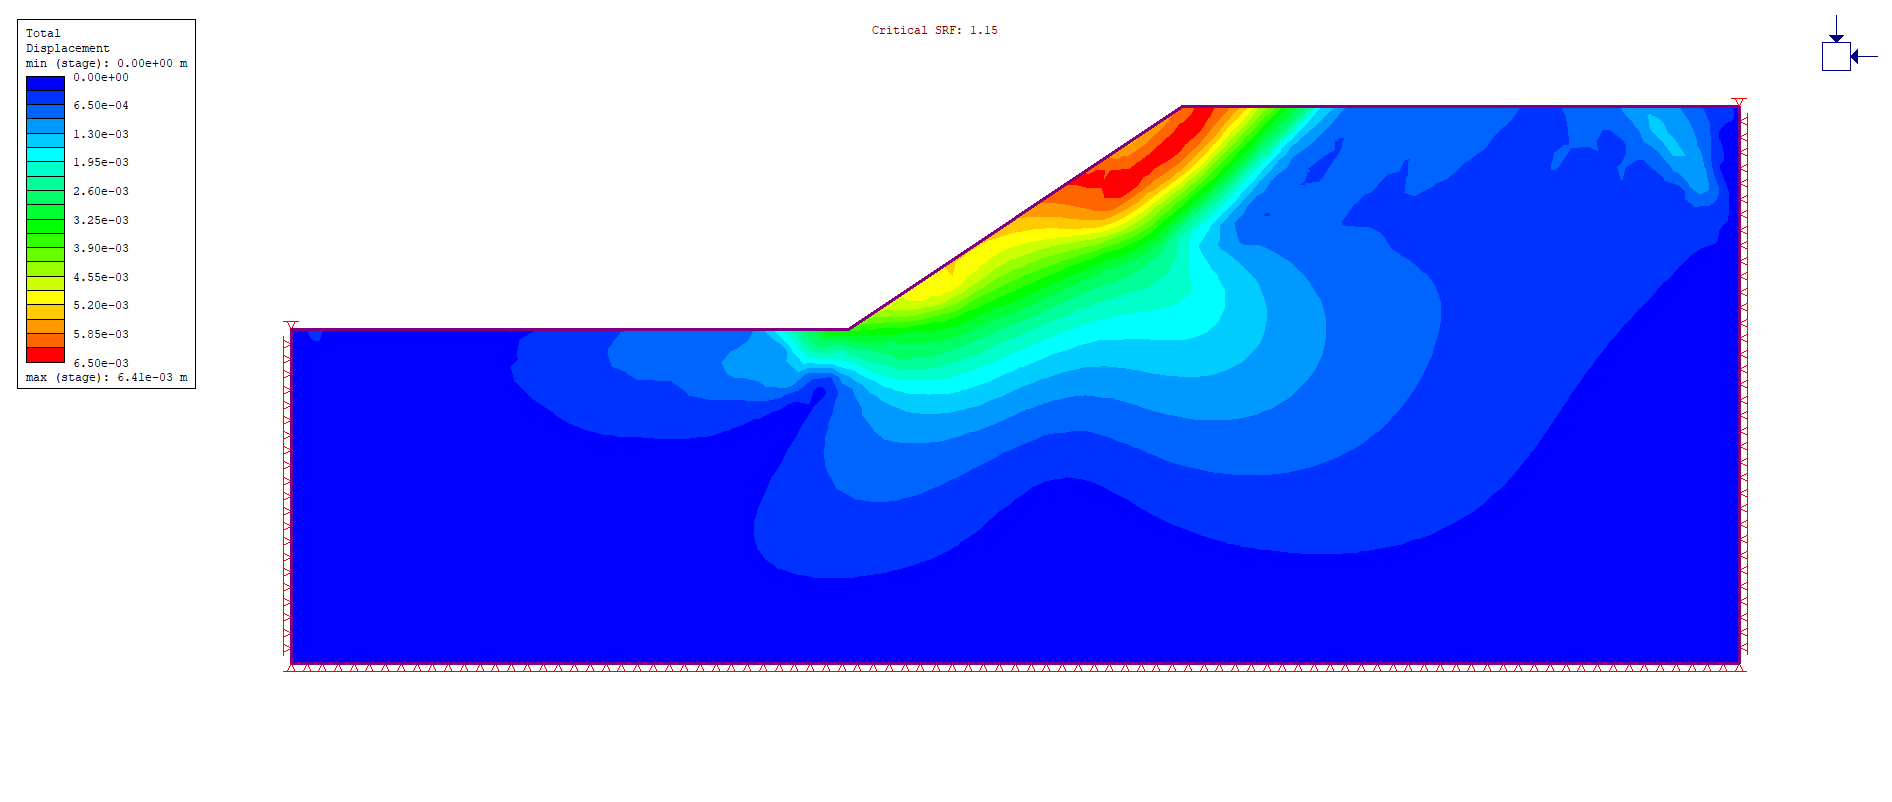
- Turn off deformed contours and boundaries and select the critical SRF tab. Another dataset of interest is Total Displacement.
- In the data selection dropdown menu, select Solid Displacements > Total Displacement.
- The displacement contours clearly highlight the zone of failure:
- The displacement contours clearly highlight the zone of failure:
Another important feature when doing an SSR analysis is the ability to plot maximum deformation versus SRF. As the SRF is increased, the strength properties are decreased. As the strength decreases the maximum displacement increases. At some point, the slope will fail, deformations will increase rapidly, and the finite-element analysis will not converge. It is this point of non-convergence that defines the critical SRF.
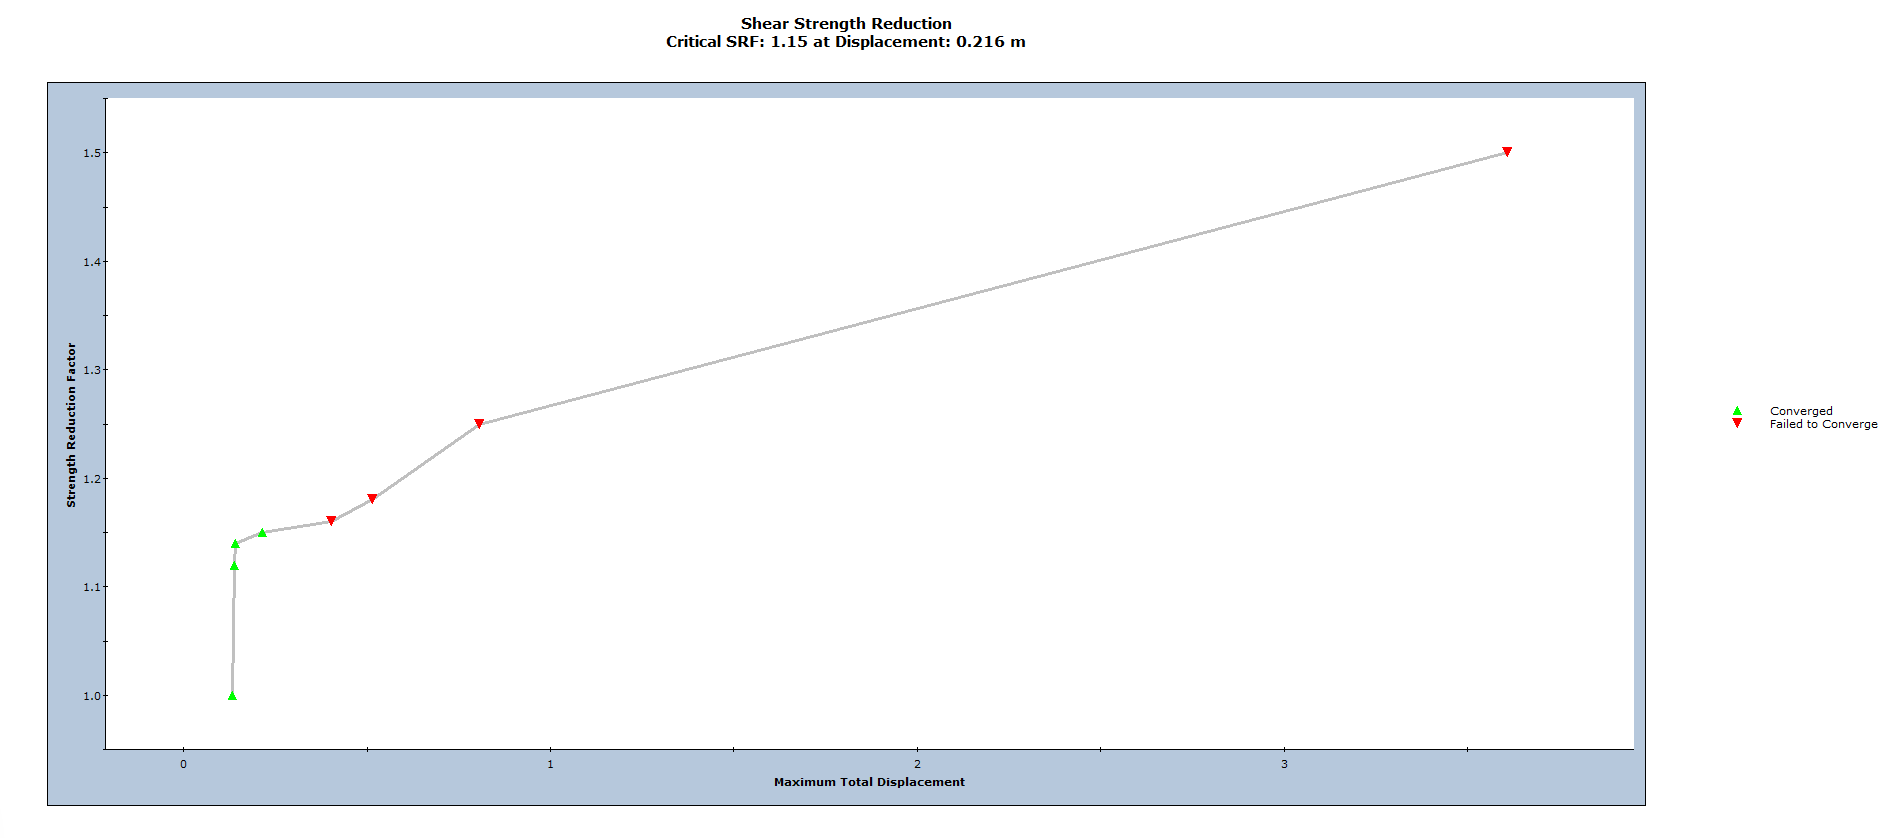
Notice the inflection in the displacements and the point where the solution does not converge.
- Close the graph.
The stress analysis results of Stage 1 are not available to look at; only the data for the different SRF values are available. It is possible to view the results from the stage or stages prior to the SSR analysis. To view the results from these stages:
- Select: Data > Stage Settings
- Move the Reference Stage slider all the way to the left so that it reads “Not Used”.
- Select OK.
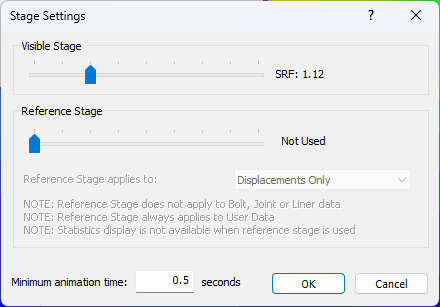
Stage Settings Dialog
A Stage 1 tab now exists along with the SRF tabs at the bottom of the view. The results of Stage 1 are now visible when the Stage 1 tab is selected.
SRF: 1 was used as a reference stage for displacements. To factor out the elastic displacements due to rebound and stress redistribution (initial stresses and body forces are rarely in equilibrium to start with), the displacements at the minimum SRF stage are factored out. Thus, all SRF displacements are relative to the displacements that occur at the minimum SRF stage.
- It is possible to edit the tolerance and number of iterations used in the SSR analysis in the advanced options of the Strength Reduction page in the Project Settings dialog of the RS2 modeller.
- It is possible to edit the tolerance and number of iterations used for stages prior to the SSR analysis (in this case Stage 1) under the Stress Analysis page in Project Settings.
This concludes the Shear Strength Reduction Analysis tutorial.