Probabilistic Slope Stability Analysis
1.0 Introduction
This tutorial will demonstrate how to carry out a probabilistic finite element slope stability analysis with RS2 using the SSR (shear strength reduction) method in combination with the point estimate method of probabilistic analysis. Interpretation of results will be discussed and a comparison with Slide limit equilibrium slope stability results will be carried out.
The results of two different models will be analyzed in this tutorial:
- A simple homogeneous slope with two random variables
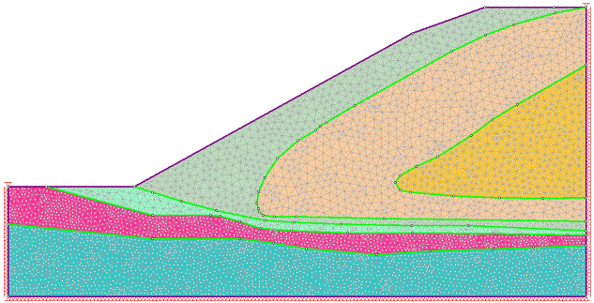
- A complex multi-material slope with six random variables
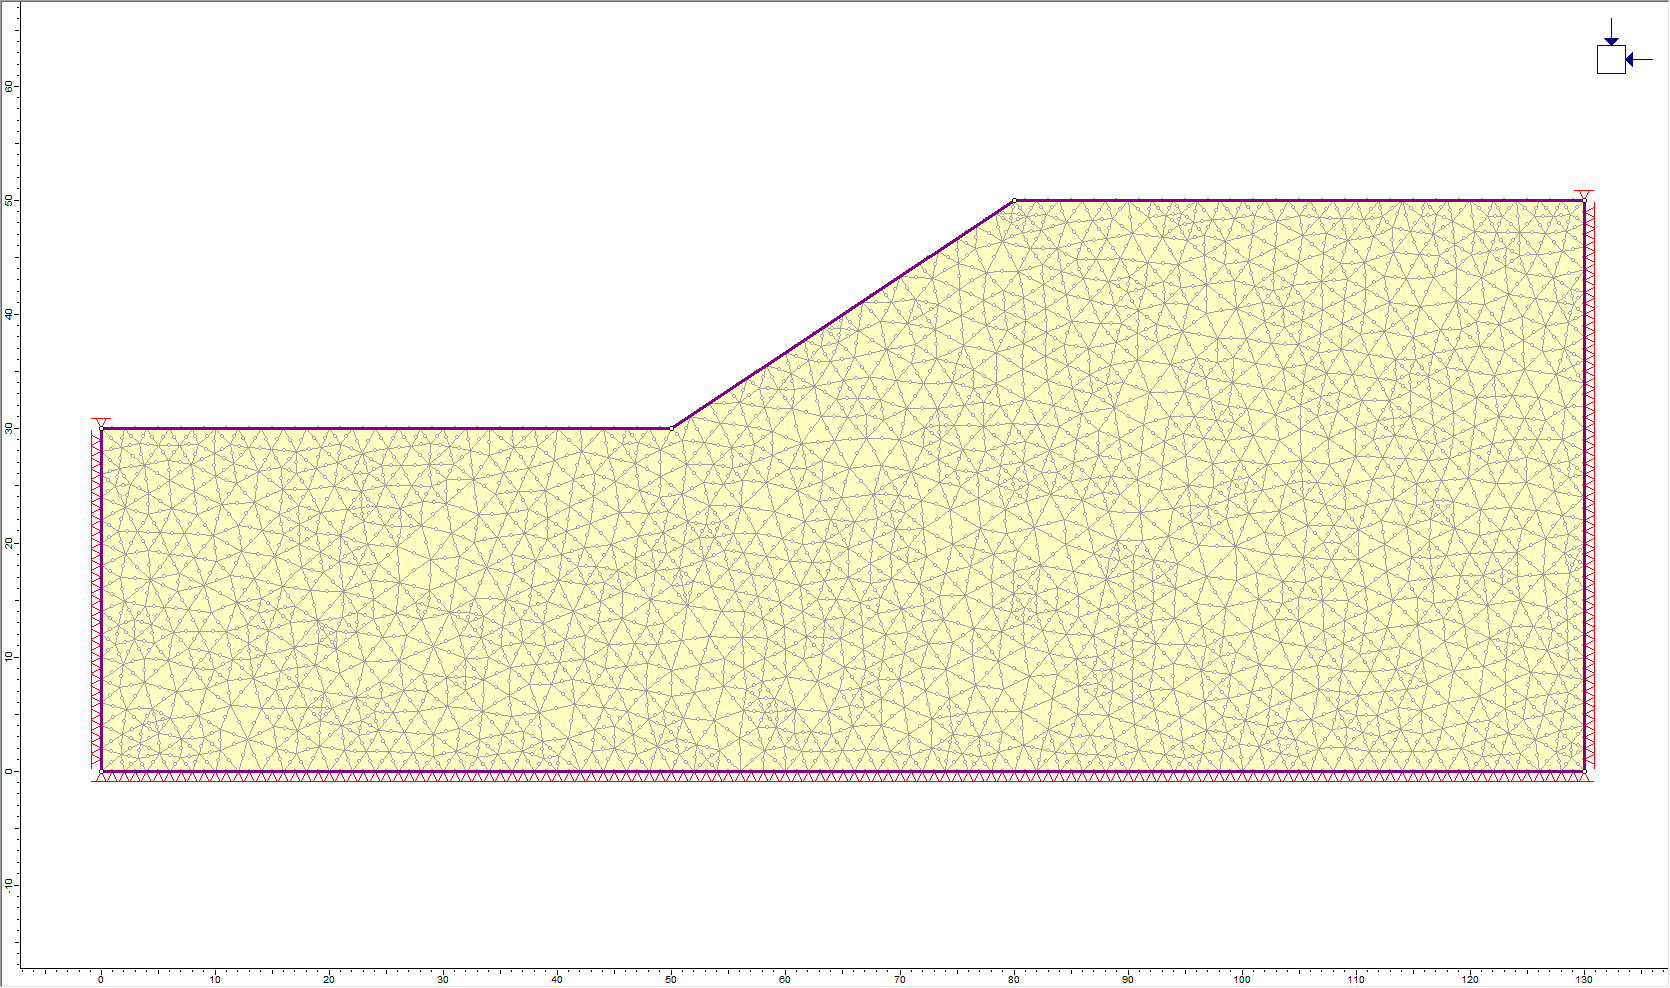
2.0 Simple Homogenous Slope
First, let’s run a probabilistic slope stability analysis on a simple homogeneous slope model.
- Select: File > Recent Folders > Tutorial Folder > Probabilistic Analysis
- Open the Probabilistic Slope Stability Part 1 file
2.1 Project Settings
Let’s have a look at the Project Settings.
- Select: Analysis > Project Settings

- Select the Statistics page in the Project Settings dialog. Notice that the Probabilistic Analysis check box is selected.
- Select the Strength Reduction page. Notice that the Determine Strength Reduction Factor check box is selected.
When both checkboxes are selected, it allows the user to carry out a probabilistic slope stability analysis. - Select Cancel (do not change any project settings).
2.2 Material Property Statistics
For this model, two random variables have been defined: the cohesion and friction angle of the slope material. Random variables are defined using the options in the Statistics menu.
- Select: Statistics > Material Properties
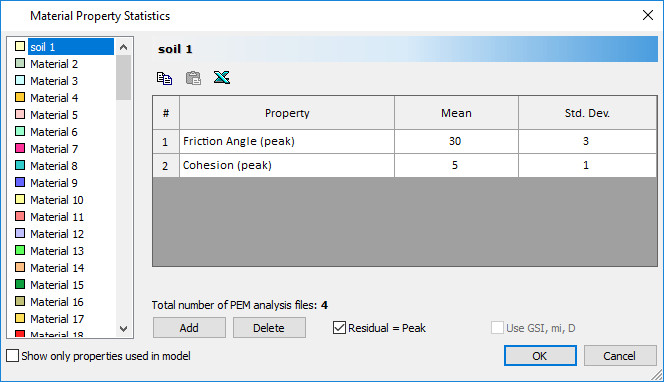
The Material Property Statistics dialog shows that the defined random variables are:
- Friction Angle (Mean = 30, Standard Deviation = 3)
- Cohesion (Mean = 5, Standard Deviation = 1)
The Residual = Peak check box is selected, indicating that the material is perfectly plastic (i.e. residual strength = peak strength), so it is not necessary to define residual strength parameters.
- Select Cancel in the dialog since the variables are already defined.
2.3 Compute
- Select: Analysis > Compute

Computing a probabilistic analysis model in RS2 causes the following to occur:
- First, the model is computed using the mean values of all variables. This is the same analysis that would be carried out when performing a standard deterministic analysis (i.e., not a probabilistic analysis)
- Then, the probabilistic analysis is computed. The point estimate method, consists of running the analysis for all possible combinations of random variable point estimates. Since two random variables were defined for this model, 4 separate analyses will be computed (2^2 = 4), i.e., the analysis will be run 4 times using the following combinations of cohesion and friction angle.
| Cohesion | Friction Angle |
| 4 | 27 |
| 4 | 33 |
| 6 | 27 |
| 6 | 33 |
Remember that the random variable point estimates are given by plus or minus one standard deviation from the mean value.
An SSR slope stability analysis is running in conjunction with a probabilistic analysis; therefore, each analysis run generated by the probabilistic analysis requires a complete SSR slope stability analysis, using a new set of random variable inputs.
2.4 Interpret
- Select: Analysis > Interpret

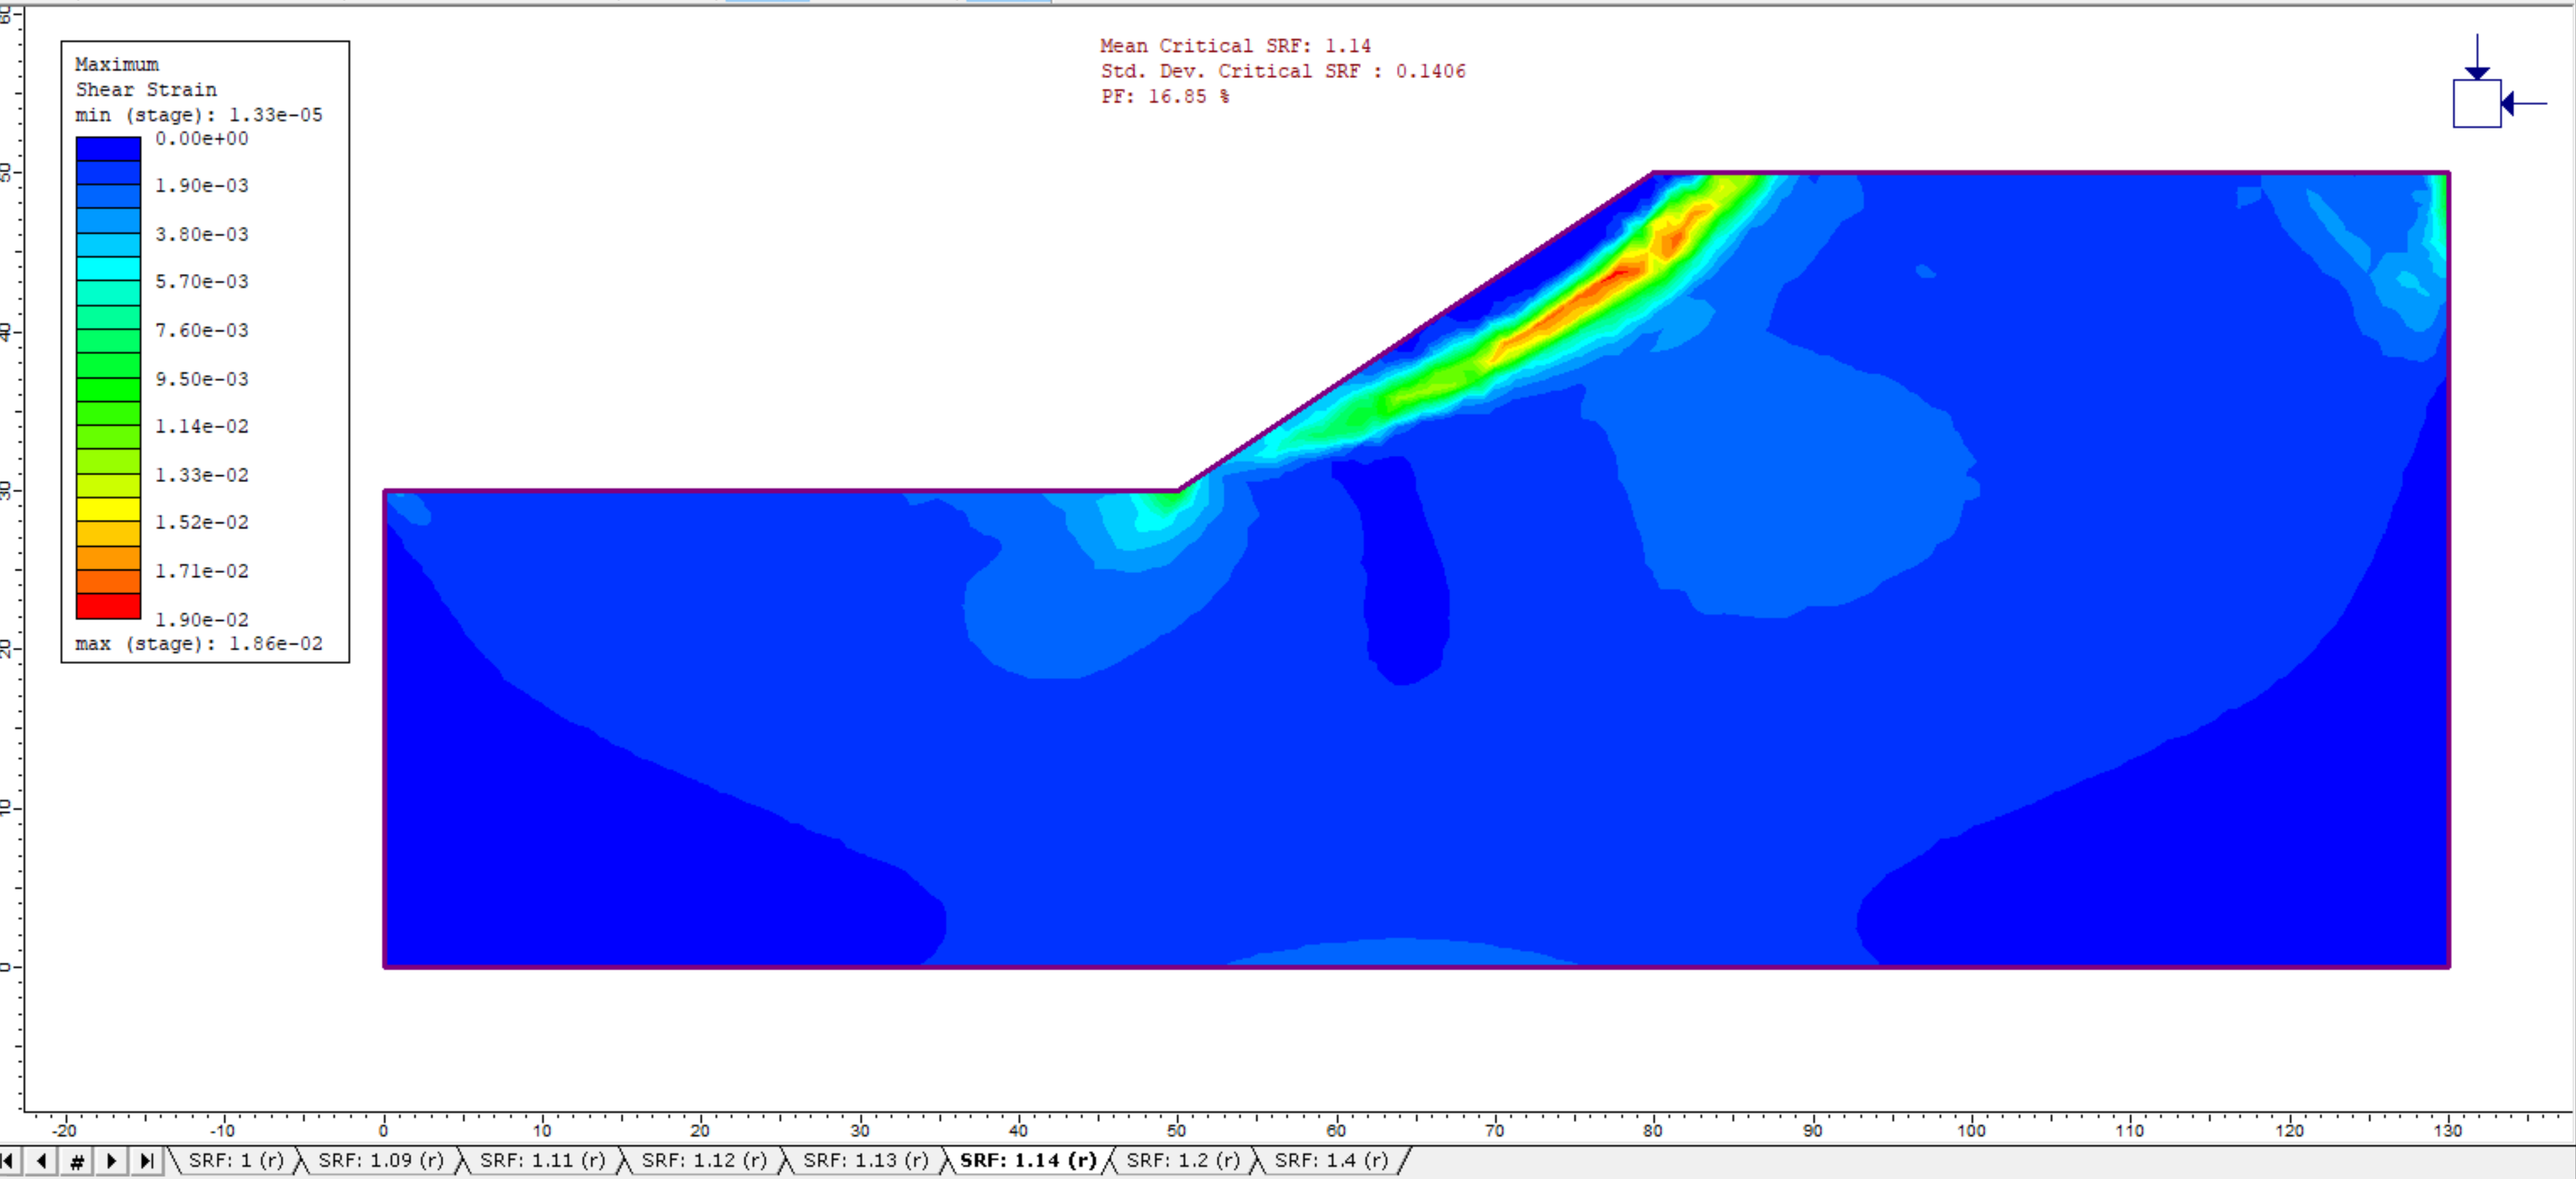
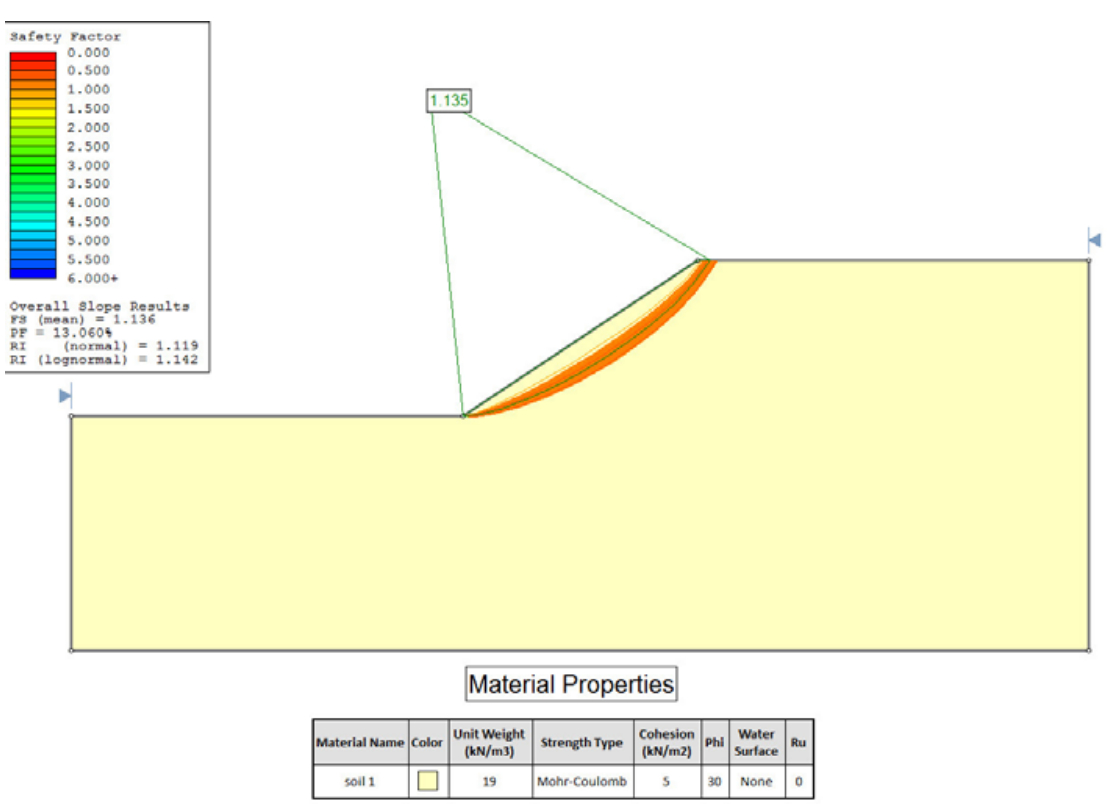
The primary results of the probabilistic SSR slope stability analysis are listed at the top center of the view:
- Mean Critical SRF
- Std. Dev. Critical SRF
- PF (probability of failure)
The Mean Critical SRF is the mean critical strength reduction factor (i.e. safety factor) obtained from the probabilistic analysis runs.
- Select: Analysis > Report Generator and scroll down to the Strength Reduction Factor Statistics section to see how this number is generated.
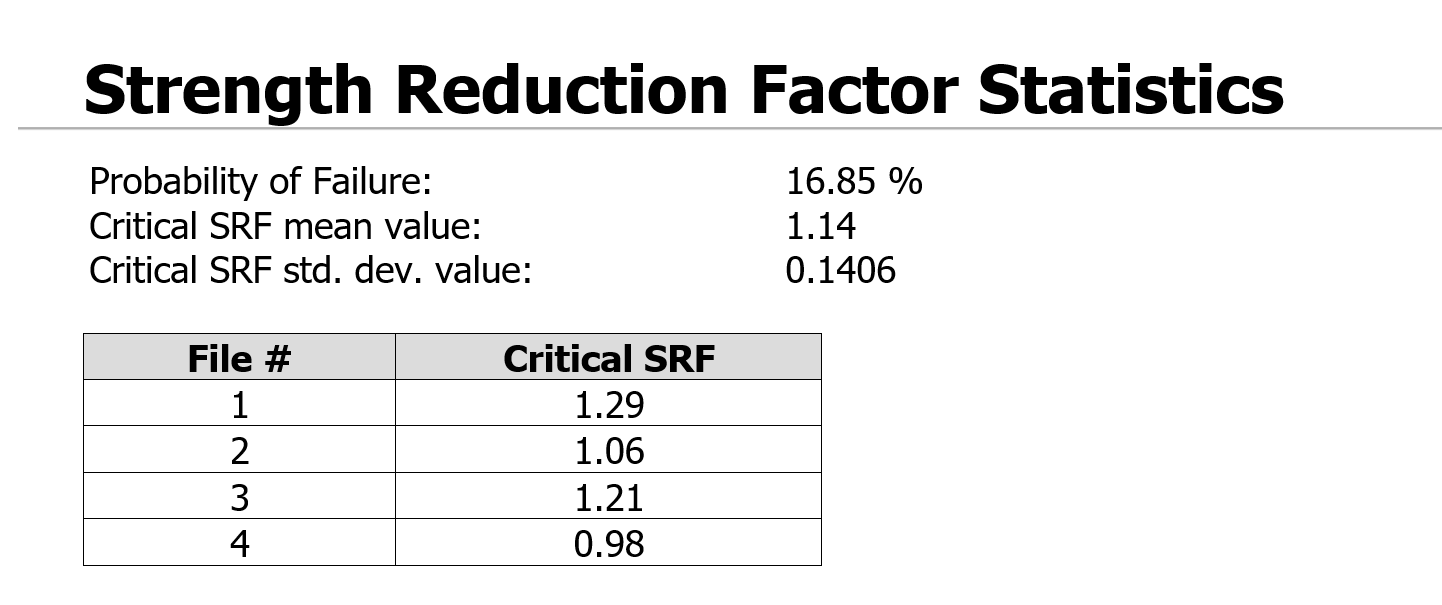
The Mean Critical SRF is the average of the values obtained from the four SSR analysis runs generated by the probabilistic analysis (i.e. (1.29+1.06+1.21+0.98) / 4 = 1.14).
The standard deviation of the critical SRF is the standard deviation of these four values. The probability of failure is computed by assuming a normal distribution for all input and output random variables and calculating the probability of the critical SRF being less than 1.
- Close the Report Generator view.
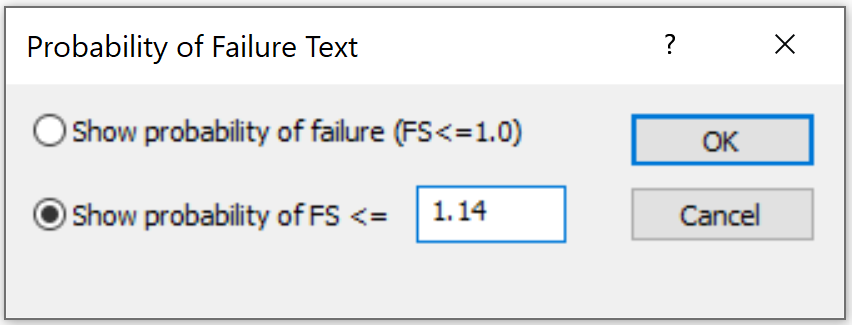
By default, a value of critical SRF = 1 is used to calculate the probability of failure. It is also possible to define a value other than SRF = 1 as the definition of “failure”.
- Select Statistics > Probability of Failure and enter a value. Changing this value will give a different probability of failure, as displayed in the text at the top of the view.
2.5 Comparison with Slide2 Results
For purposes of comparison, this model was exported to the limit equilibrium slope stability program Slide2. A probabilistic analysis was run using the Overall Slope method of probabilistic analysis. The results are summarized below.
| Program Name | Probability of Failure | Mean Factor of Safety | Standard Deviation F.S |
| RS2 9.0 | 16.85 | 1.14 | 0.14 |
| Slide 6.0 | 13.1 | 1.14 | 0.12 |
These results show that both RS2 and Slide2 give nearly identical results for a probabilistic slope stability analysis of this simple homogenous slope model.
Run the file Probabilistic Slope Stability 01.slim in Slide2 to verify these results. The file is located at: RS2 Examples > Tutorials folder.
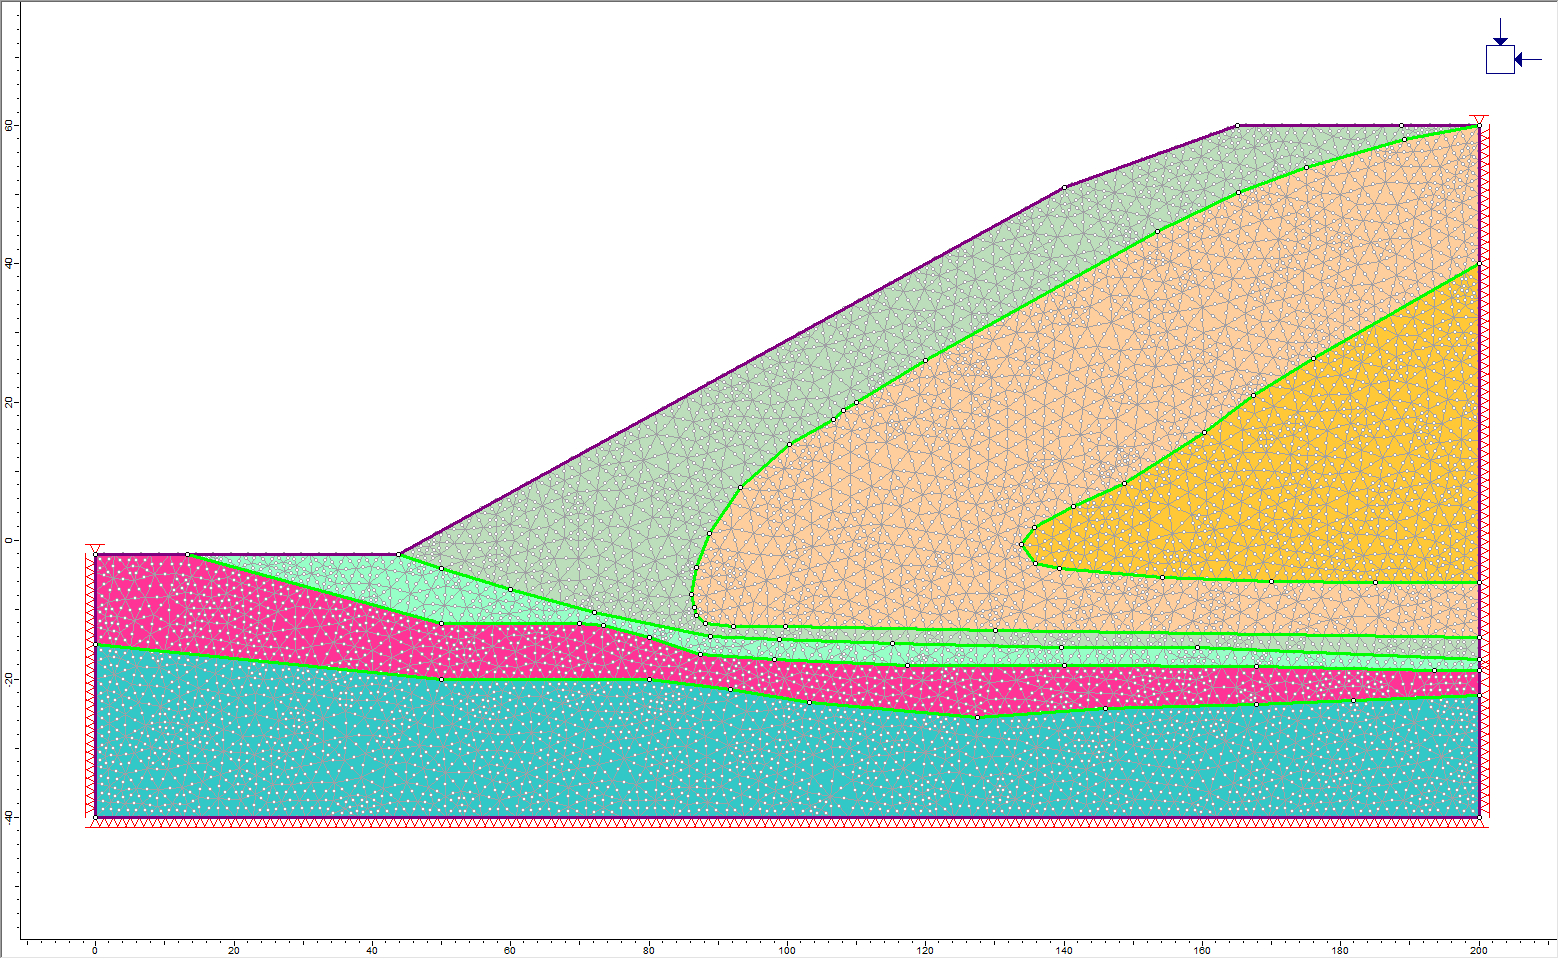
3.0 Complex Multi-Material Slope
Now let’s run a probabilistic slope stability analysis on a more complex slope model with six random variables.
- Select: File > Recent Folders > Tutorial Folder > Probabilistic Analysis
- Open the Probabilistic Slope Stability Part 2 file
3.1 Generate Component Files
Before computing the model, let’s generate the probabilistic component files.
- Select: File > Save

This may take some time; a progress bar will be visible at the bottom of the screen.
This step is necessary because this model has 6 random variables and therefore generates 64 component files. For this complex model, the 64 component files require over 20 MB of space, even without analysis results. In order to save space, these component files were not included with the RS2 installation, for this particular file.
3.2 Material Property Statistics
Now, look at the material property random variables that have been defined.
- Select: Statistics > Material Properties
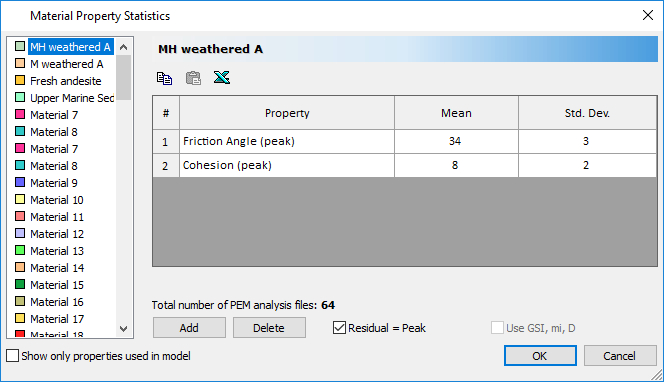
- Selecting the first four materials from the list at the left of the dialog shows that six random variables have been defined (i.e. friction angle and cohesion for three of the four materials).
Six random variables will require 2^6 = 64 separate analyses using the point estimate method of probabilistic analysis.
- Select Cancel in the dialog.
3.3 Compute
Because this probabilistic analysis will require 64 separate analysis runs, and each run is an SSR finite element slope stability analysis of a relatively complex model, this analysis will take a significant amount of computation time.
With a relatively fast computer, it may take about 3 hours. With a slower machine, the analysis may need to be run overnight.
3.4 Interpret
Once the probabilistic analysis has been computed, the following results should be visible in Interpret.
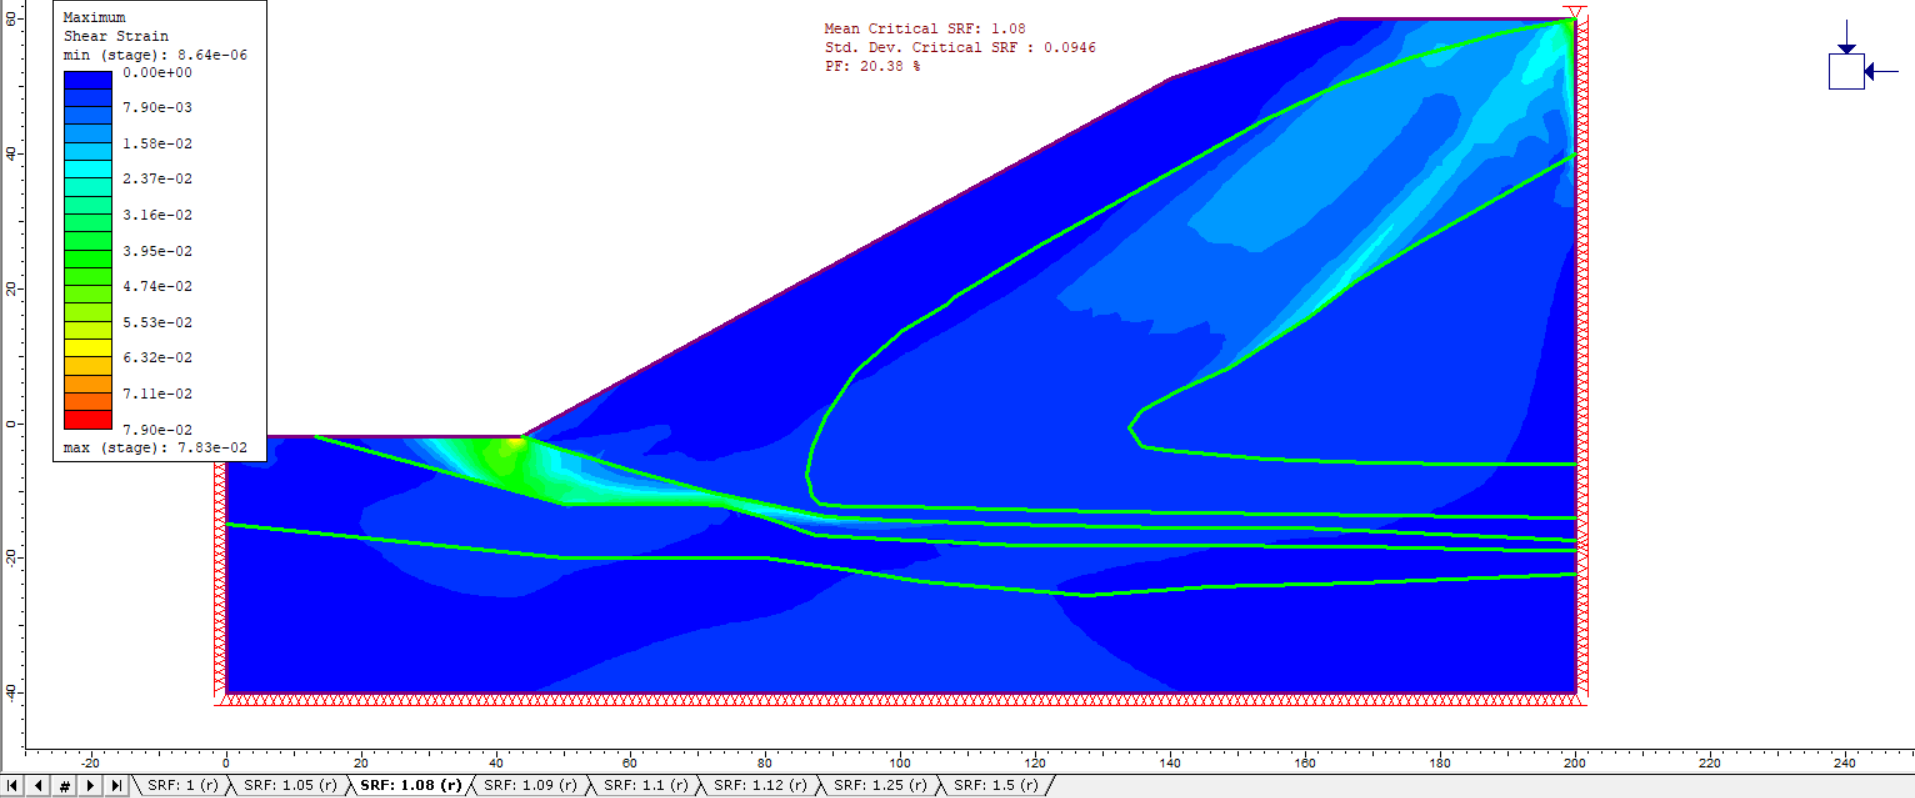
The primary results of the probabilistic SSR slope stability analysis are listed at the top center of the view:
- Mean Critical SRF
- Std. Dev. Critical SRF
- PF (probability of failure)
The definitions of these are discussed in the previous example.
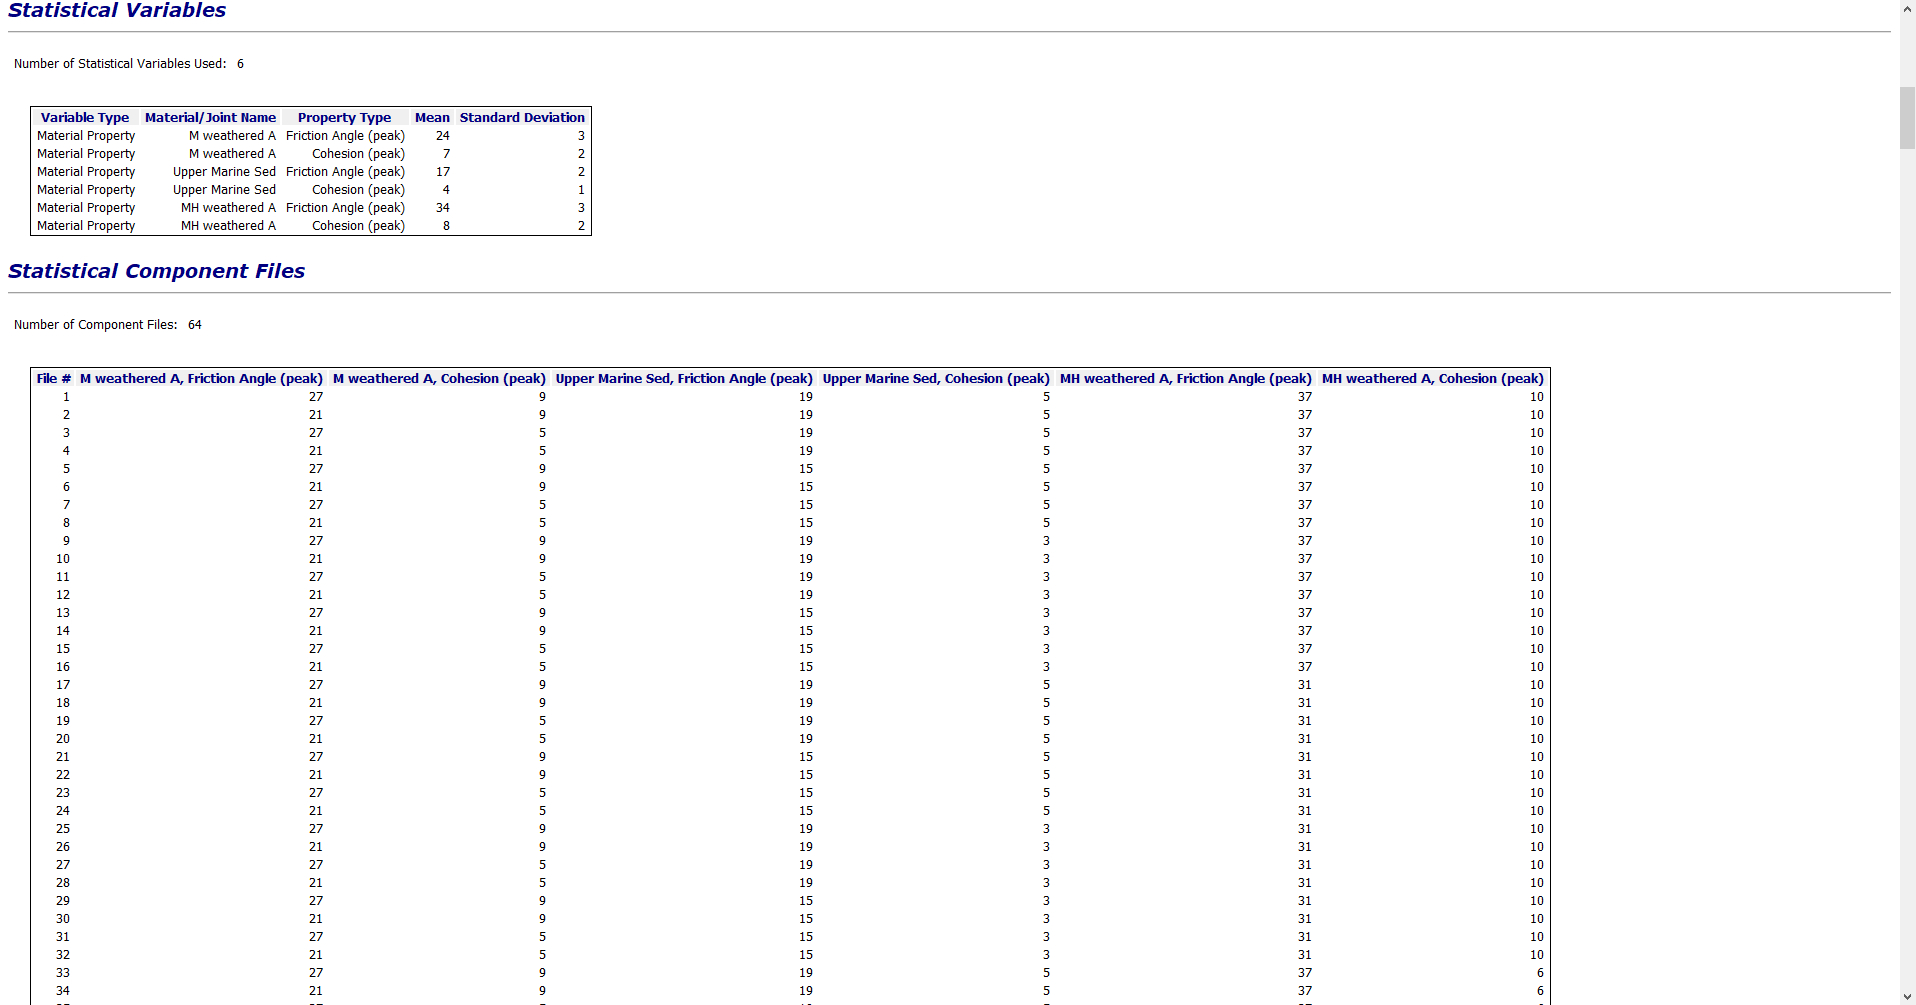
- Open the Report Generator and examine the summary of statistical input and output data for this model. The input and output for the 64 component files of the probabilistic analysis are presented.
- Close the Report Generator.
Probabilistic slope stability analysis can be easily carried out using the point estimate method of probabilistic analysis and the shear strength reduction (SSR) slope stability analysis available in the finite element program RS2. The results computed by RS2 (mean safety factor and probability of failure) have been compared to limit equilibrium slope stability analysis results computed by Slide2 and found to be in good agreement.
This concludes the Probabilistic Slope Stability Analysis.