7 - Curved Borehole Oriented Core
1.0 Introduction
This tutorial demonstrates how to enter and process data for non-linear oriented core type boreholes, using the Curved Borehole Oriented Core option in DIPS.
Topics Covered in this Tutorial:
- Curved Borehole Oriented Core Traverse
- Survey Data
Finished Product:
The finished product of this tutorial can be found in the Tutorial 07 Curved Borehole Oriented Core.dips9 file, located in the Examples > Tutorials folder in your DIPS installation folder.
2.0 Model
If you have not already done so, run DIPS by double-clicking on the DIPS icon in your installation folder. Or from the Start menu, select Programs > Rocscience > DIPS > DIPS.
If the DIPS application window is not already maximized, maximize it now, so that the full screen is available for viewing the model.
DIPS comes with several example files installed with the program. These example files can be accessed by selecting File > Recent > Examples Folder from the File menu (or File > Open from the Home ribbon). This tutorial will use the Curved Borehole.dips9 file to demonstrate the basic plotting features of DIPS.
- Select File > Recent > Example Folder
 from the menu.
 - Open the Curved Borehole.dips9 file. Since we will be using the Curved Borehole.dips9 file in other tutorials, save this example file with a new file name without overwriting the original file.
- Select File > Save As
 from the menu.
 - Enter the file name Tutorial 07 Curved Borehole Oriented Core and Save the file.
3.0 Pole Data Grid
If the Pole Data Grid is not already the active view:
- Select the Pole Data Grid
 view tab.
You should see the Pole Data Grid view shown in the following figure.
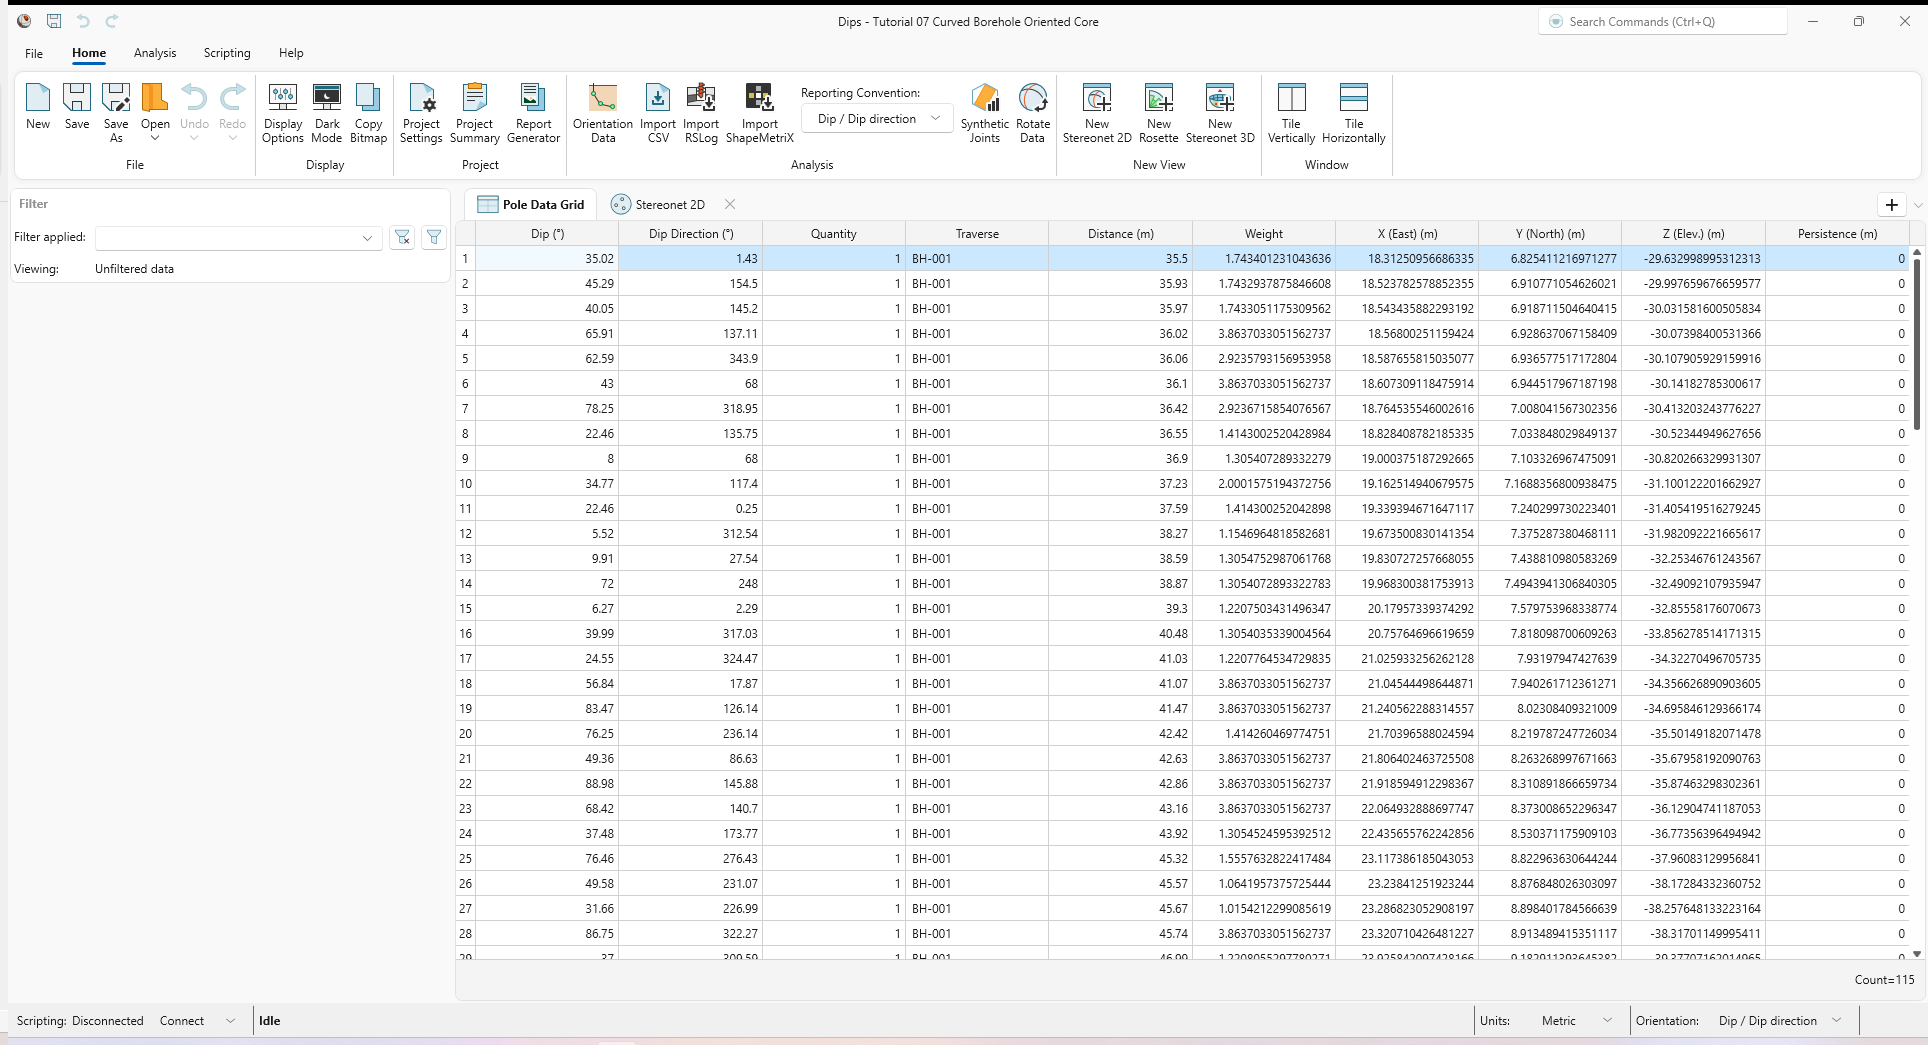
The Pole Data Grid shows all processed orientation data entered in the Orientation Data dialog. Note that there are 115 rows of data (i.e., Count=115) and the following columns:
- Dip and Dip Direction columns showing the processed orientations in the selected Reporting Orientation.
- Quantity column
- Traverse column
- Distance column
- Weight column
- X (East) column
- Y (North) column
- Z (Elev.) column
- Persistence column
4.0 Stereonet 2D
Now look at the Stereonet 2D view:
- Select the Stereonet 2D
 view tab.
You should see the Stereonet 2D view shown in the following figure.

This file contains data from a single Curved Borehole Oriented Core Traverse. Notice that the Traverse orientation is displayed on the stereonet as a green circle with the Traverse ID = BH-001. For a Curved Borehole Traverse, this point is the FIRST point in the Survey Data.
5.0 Curved Borehole Oriented Core Traverse
A Curved Borehole Oriented Core Traverse in DIPS, is a non-linear borehole, where the borehole path is defined by a survey file with orientation versus depth (distance) measurements.
There are two different types of Curved Borehole Traverses, which can be defined in DIPS:
For the Curved Borehole Oriented Core option, the joint measurements are Alpha / Beta angles measured from oriented core. See the Borehole Oriented Core topic for more information about the Alpha / Beta convention.
For the Curved Borehole Televiewer option, the joint measurements are already processed into true Trend / Plunge (i.e., pole) or Dip / Dip Direction or Strike / Dip from televiewer or other processing method.
The file you have just opened uses the Curved Borehole Oriented Core option. This has been defined in the Orientation Data dialog.
5.1 Orientation Data
The Orientation Data dialog is the primary data input for DIPS orientation data. To review the raw, unprocessed input data:
- Select Home > Analysis > Orientation Data
 from the ribbon.
 - The Orientation Data
dialog appears.
- Note that there is one dataset (or traverse).
- For dataset BH-001.
- The Name = BH-001 acts as its unique identifier and is used for traverse associations in the Traverse column of the Pole Data Grid.
- The Type = Curved Borehole Oriented Core. See the Traverse Types topic for more information.
- In the Traverse tab:

Dataset BH-001 Traverse tab in the Orientation Data dialog - Declination = 0 degrees. See the Declination topic for more information.
- Orient 1 = 180 degrees. Orient 1 defines the position of the reference line relative to the top of the core. Orient 1 = 180 indicates a reference line scribed along the bottom of the core.
- Local Coordinates X, Y, Z = 0, 0, 0.: The Local Coordinates act as the Collar for the borehole and are used to calculate the locations (X, Y, Z) of the Discontinuities at the specified Distance along the borehole.
- In the Survey Data tab:
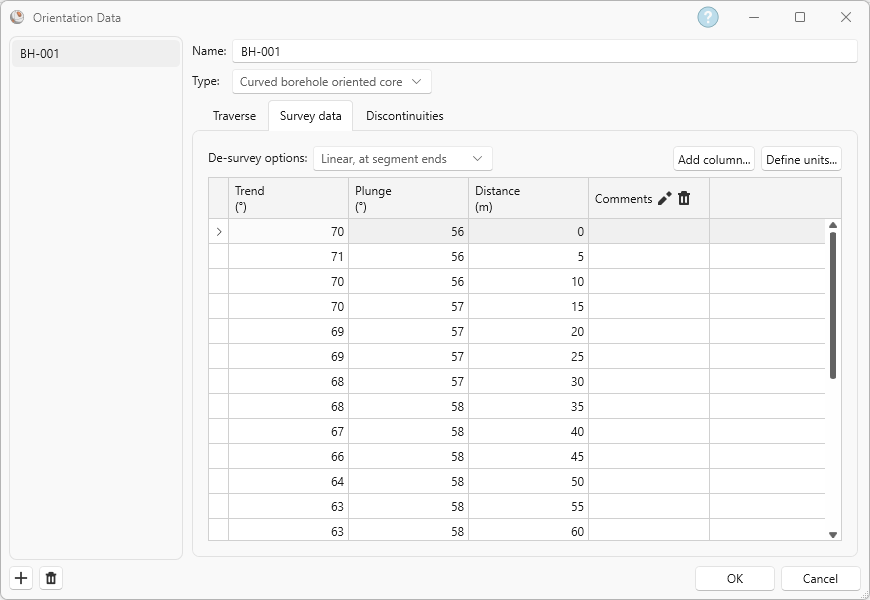
Dataset BH-001 Survey Data tab in the Orientation Data dialog - De-survey Options = Linear, at segment ends. See the Survey Data topic for more information.
- There are 25 rows of survey data which define the orientation in Trend and Plunge and the (curvilinear) Distance, measured from the Collar.The Plunge convention is positive in the downward direction. The Distance column is unit-sensitive and in units of Length in m.
- In the Discontinuities tab:

Dataset BH-001 Discontinuities tab in the Orientation Data dialog - Data Orientation Convention = Alpha / Beta. This dictates the orientation format of the first two columns.For Borehole Oriented Core Traverse Type, the Data Orientation Convention is always Alpha / Beta (i.e. local angles measured relative to the oriented core).
- There are 115 rows of discontinuity data.: The Distance column is mandatory for Borehole traverses.
- Data Orientation Convention = Alpha / Beta. This dictates the orientation format of the first two columns.
- Select Cancel to close the dialog.
See the Orientation Data topic for more information.
6.0 Traverse Properties
Traverses can be displayed in the Stereonet 2D view by turning on the Traverses group Visibility in the Visibility pane.
Individual Traverse visibility can also be managed in the Visibility pane by toggling on/off the individual Visibility buttons under the Traverses group.
A Traverse point is displayed as a green circle labelled with the Traverse Name (in this case, BH-001). By default, curved traverses are represented by the orientation of the first Survey Data point only.
To show all points in the Survey Data:
- Select BH-001 from the Traverses group in the Visibility tree.
- Select the Show All Points checkbox from the Properties pane.
You will see the Survey Data points for Traverse BH-001 plotted as a series of overlapping green circles.
If the borehole deviation is small, then the survey points will overlap in a cluster. If there is a significant deviation from a lengthy borehole, the survey points will show the path of the borehole on the stereonet.
To show the blind zone:
- Select BH-001 from the Traverses group in the Visibility tree.
- Select the Show Blind Zone checkbox from the Properties pane.
A cone with its center at the Traverse orientation and a cone angle of 90 – Minimum Bias Angle (see the Weighting Options topic for more information) is drawn. Discontinuities plotted outside of this cone represent parallel or sub-parallel planes to the Traverse orientation, and the chance of observation rapidly drops to near zero. As such, the planes in this zone are either insufficiently sampled (i.e., highly biased) or (erroneously) unobserved. See the Terzaghi Weighting topic for more information.

7.0 Processing Curved Borehole Data
For a Curved Borehole Oriented Core Traverse, the data is processed as follows:
- The Alpha / Beta angles measured on the oriented core, and entered in the Discontinuities tab of the Orientation Data dialog, are processed and plotted as true joint plane orientations on the stereonet, using the Traverse and Survey Data information entered in the Orientation Data dialog.The Pole Data Grid shows the processed orientations in the first two columns according to the selected Orientation Reporting Convention.
- The Terzaghi Weighting can also be applied, since each measurement entered in the Discontinuities tab of the Orientation Data dialog corresponds to a Survey Data Distance along the borehole. The borehole orientation can be determined for each joint measurement, and the weighting factor applied.
The processing of data for Curved Borehole Oriented Core traverses is essentially the same as for Linear Borehole Oriented Core traverses, except the Traverse orientation is variable and determined from the Survey Data rather than being constant as for a Linear Borehole Oriented Core.
Once you have set up the Orientation Data for a Curved Borehole Oriented Core, the plotting and analysis of data is no different from other Traverse Types defined in DIPS. You may combine any number of different Traverse Types within the same DIPS file.
This concludes the tutorial. You are now ready for the next tutorial, Tutorial 08 – Jointing Analysis.