2 - Curved Set Windows
1.0 Introduction
This tutorial covers the creation of Sets via the Add Curved Set Window method.
Topics Covered in this Tutorial:
- Add Curved Set Window
- Terzaghi Weighting
- Major Planes Plot
Finished Product:
The finished product of this tutorial can be found in the Tutorial 02 Curved Set Windows.dips9 file, located in the Examples > Tutorials folder in your DIPS installation folder.
2.0 Model
If you have not already done so, run DIPS by double-clicking on the DIPS icon in your installation folder. Or from the Start menu, select Programs > Rocscience > DIPS > DIPS.
If the DIPS application window is not already maximized, maximize it now, so that the full screen is available for viewing the model.
DIPS comes with several example files installed with the program. These example files can be accessed by selecting File > Recent > Examples Folder from the File menu (or File > Open > Examples Folder from the Home ribbon). This tutorial will use the Example.dips9 file to demonstrate the basic plotting features of DIPS.
- Select File > Recent > Example Folder
 from the menu.
 - Open the Example.dips9 file. Since we will be using the Example.dips9 file in other tutorials, save this example file with a new file name without overwriting the original file.
- Select File > Save As
 from the menu.
 - Enter the file name Tutorial 02 Curved Set Windows and Save the file.
3.0 Pole Data Grid
If the Pole Data Grid is not already the active view:
- Select the Pole Data Grid
 view tab.
You should see the Pole Data Grid view shown in the following figure.
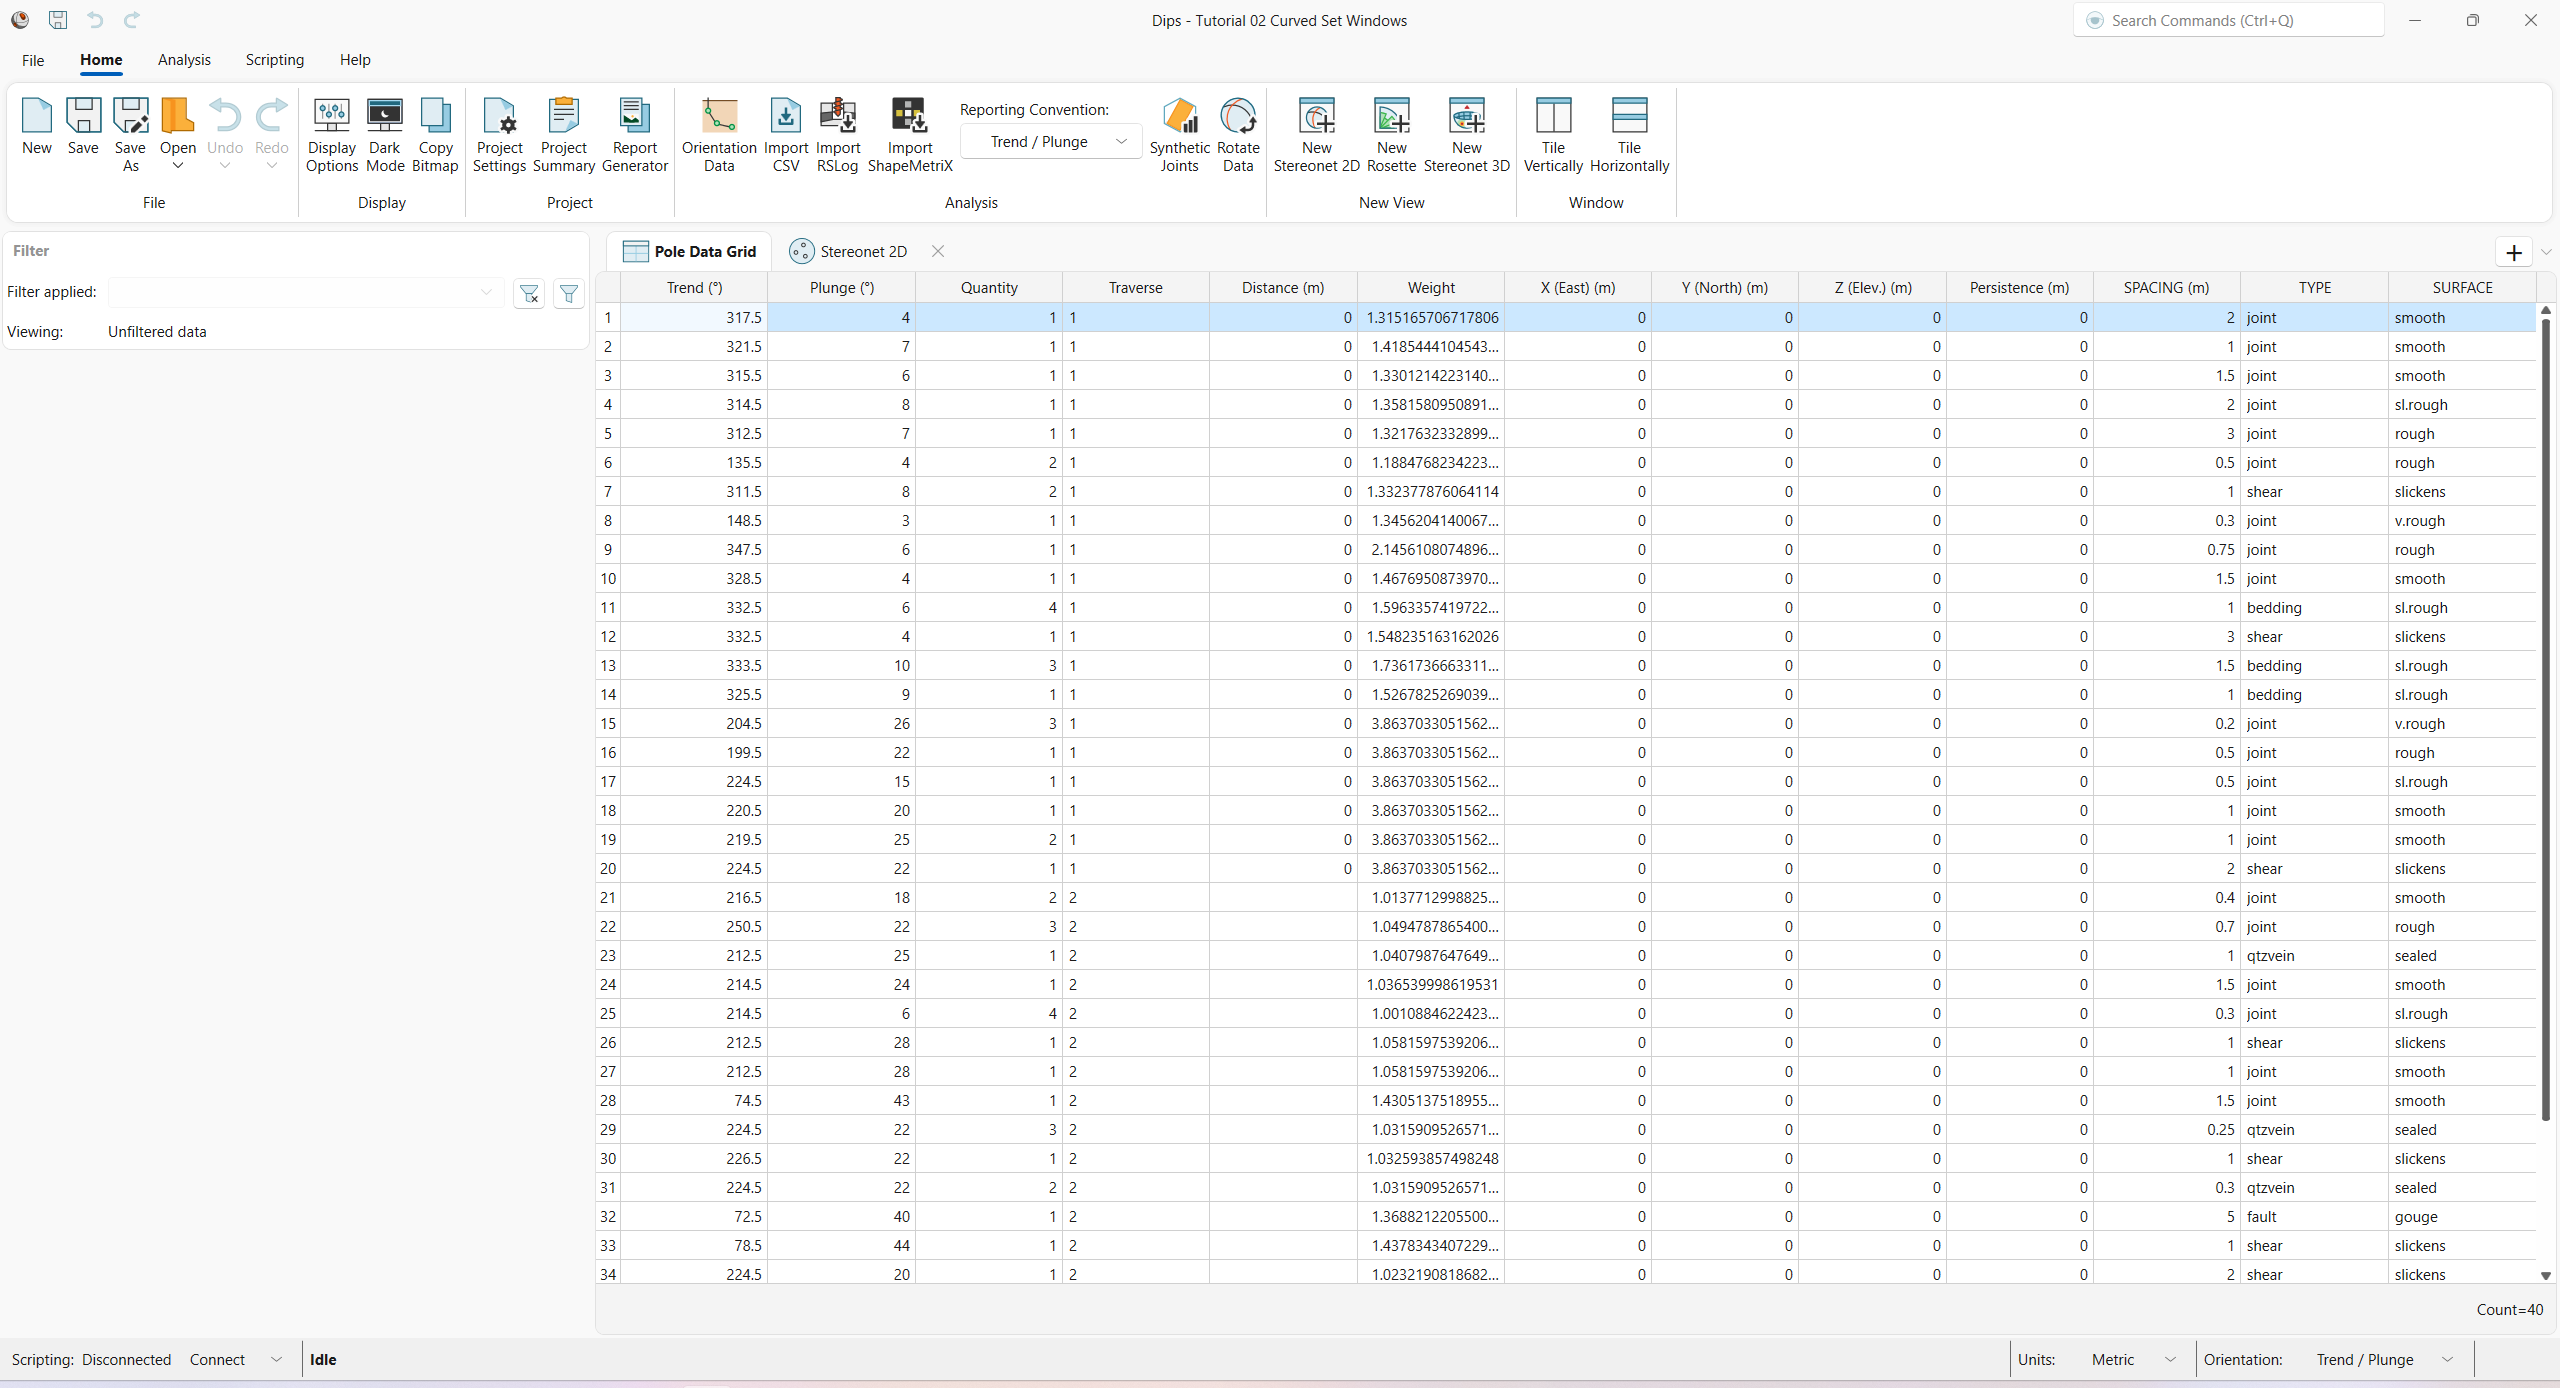
The Pole Data Grid shows all processed orientation data entered in the Orientation Data dialog. Note that there are 40 rows of data (i.e., Count=40).
4.0 Stereonet 2D
Now look at the Stereonet 2D view:
- Select the Stereonet 2D
 view tab.
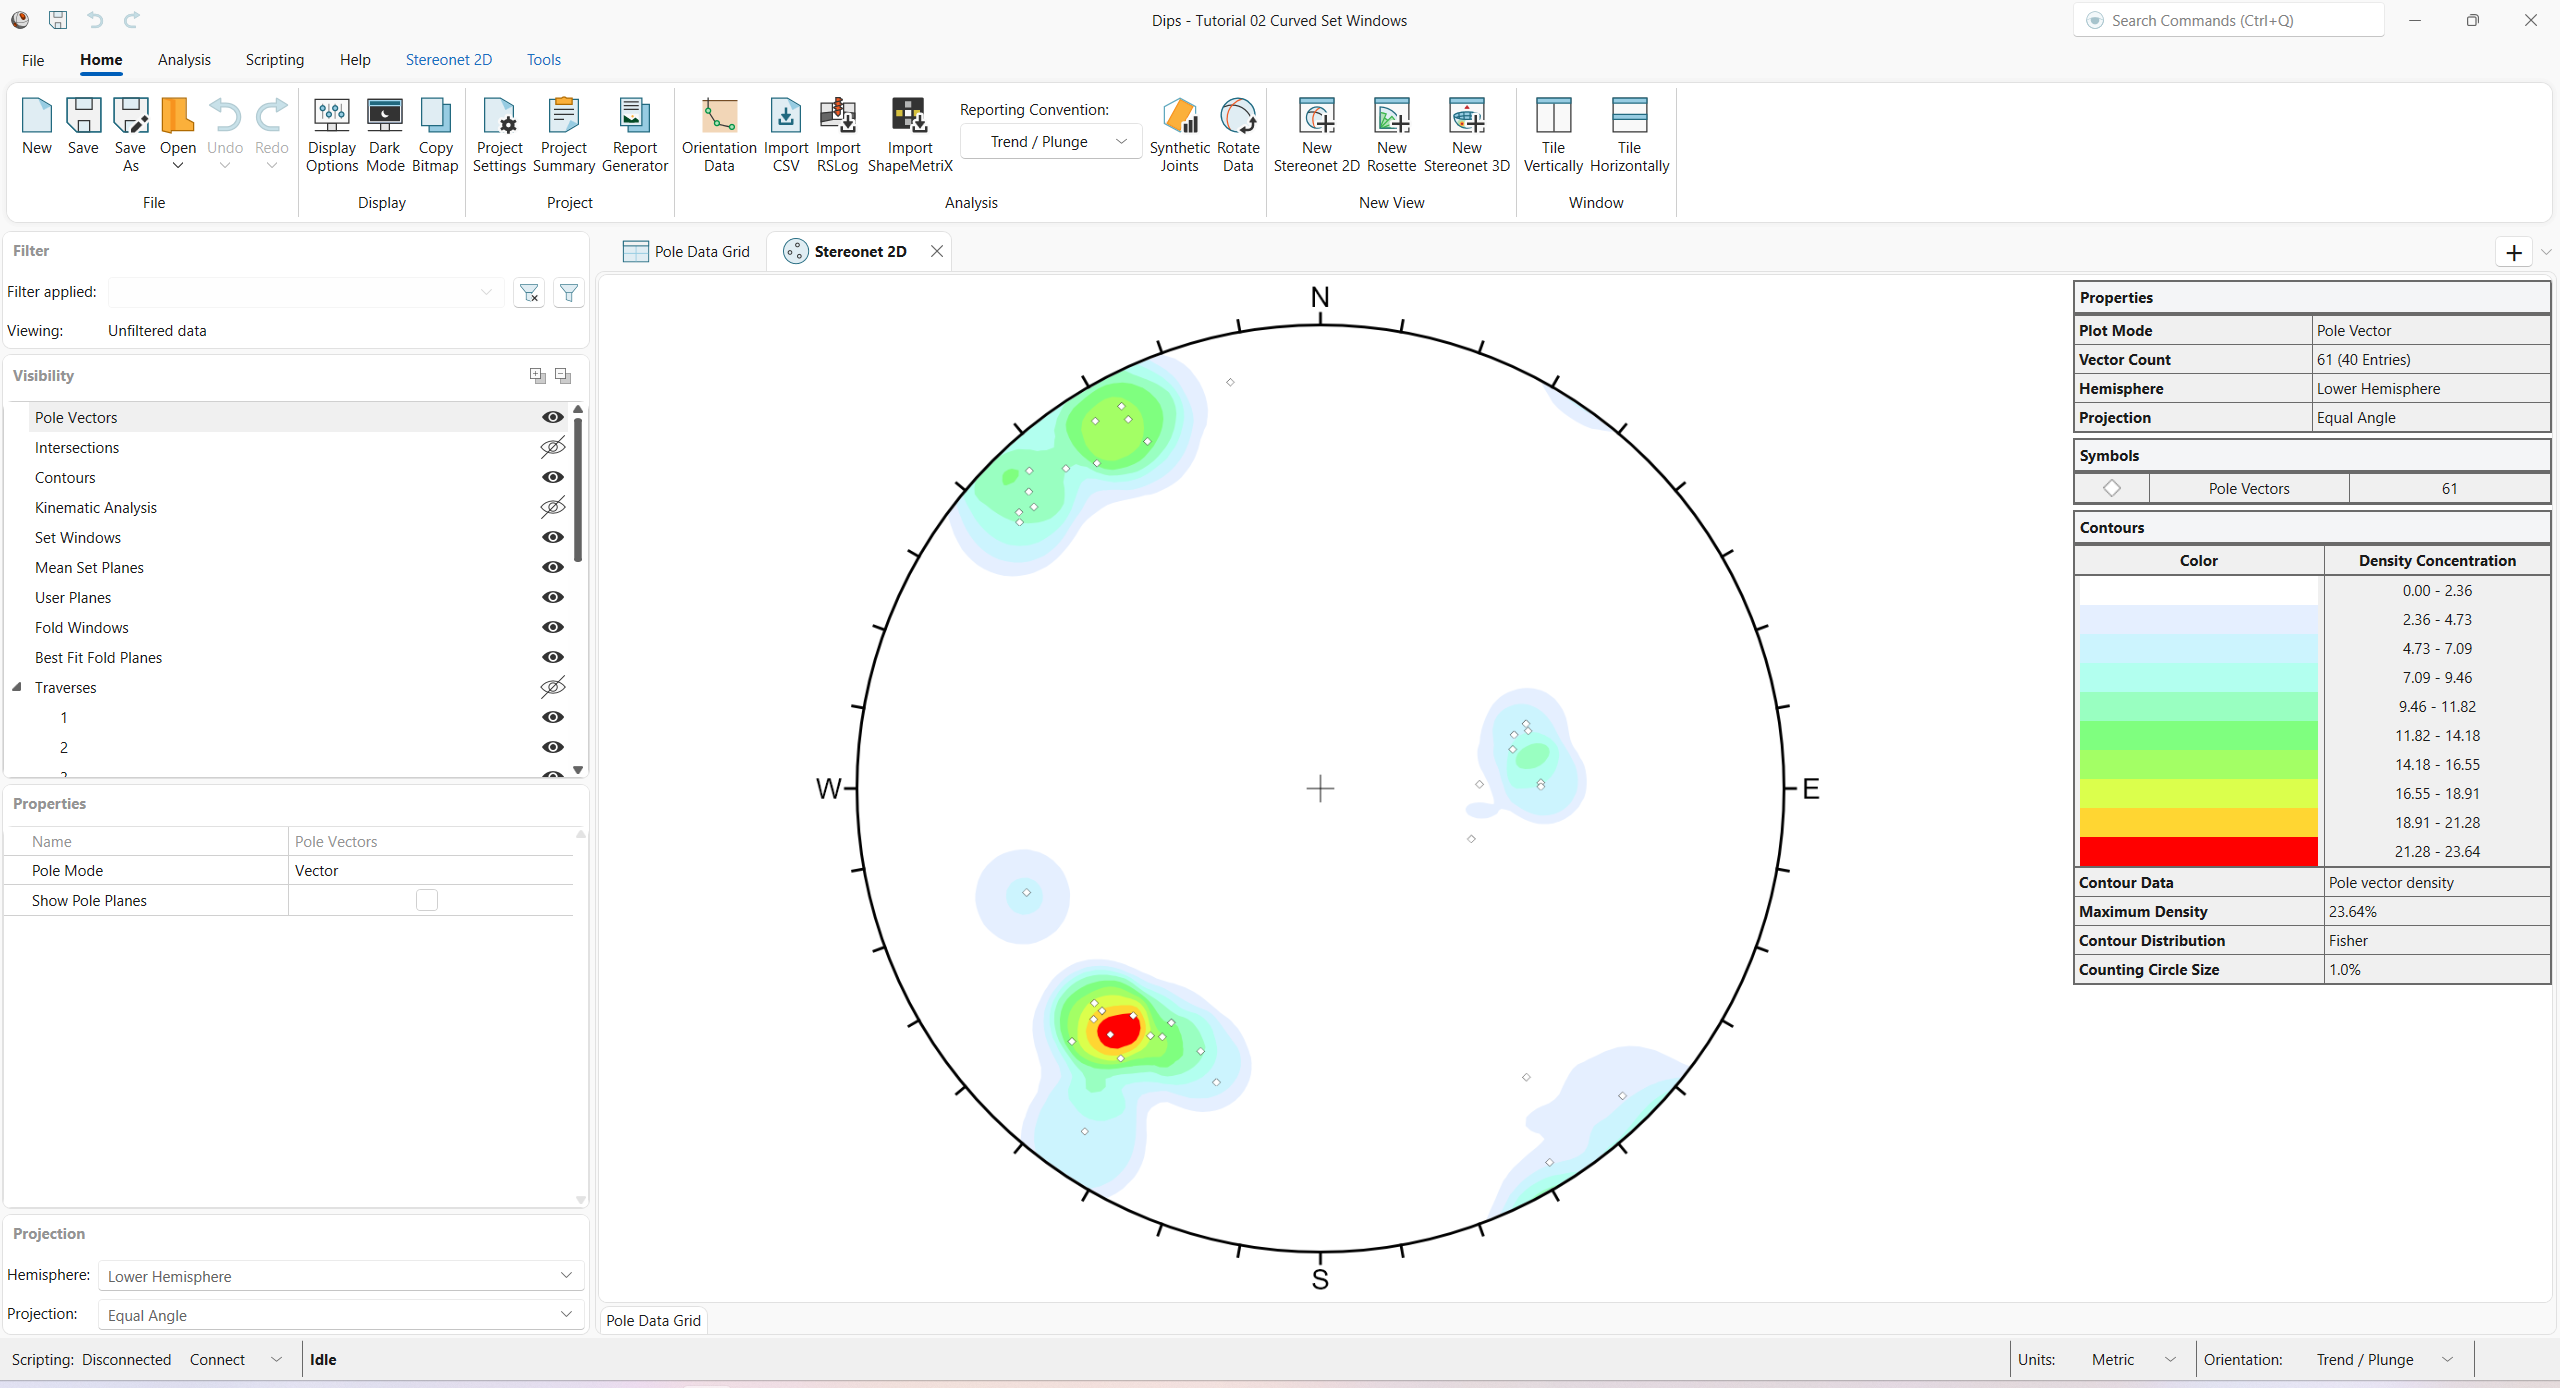
You should see the Stereonet 2D view shown in the following figure.
5.0 Add Set Window
A Set, as defined in DIPS, is a grouping of poles created with one of the following options:
Sets are created for the purpose of obtaining Mean Set Plane orientations and Set Statistics of orientation data clusters.
In this tutorial, we will focus on creating Sets with the Add Curved Set Window option
5.1 Add Curved Set Window
The Add Curved Set Window option allows you to draw windows around data clusters on the stereonet. The windows created with the Add Curved Set Window option are curvilinear four-sided windows, defined by Trend and Plunge values at opposite corners.
Let’s create our first Set with the small data cluster at the right side of the stereonet.
- Select Stereonet 2D > Sets > Add Curved Set
 from the ribbon.
 - Locate the cursor at approximately Trend/Plunge = 60 / 50, and left-click the mouse button. Remember that the cursor coordinates are displayed in the lower-right corner of the Status Bar. If necessary, switch to Orientation = Trend/Plunge reporting convention in the drop down in the Status Bar.
- Move the mouse in a clockwise direction, and you will see a curvilinear, four-sided Curved Set Window opening up.
- Locate the cursor to approximately Trend/Plunge = 100 / 30, and left-click the mouse button. The Edit Curved Set Window dialog appears.
- Leave the default Name = Set 1. The Name acts as a unique Set identifier, which is also used for set associations, listed under the Set column in the Pole Data Grid.
- Edit the First Corner
and Second Corner coordinates if the window does not enclose the desired data (either directly in the Edit Curved Set Window dialog or graphically by dragging the handles).

Edit Curved Set Window dialog - Click OK to close the dialog and finalize the Curved Set Window.
Set 1 will be created as shown below.
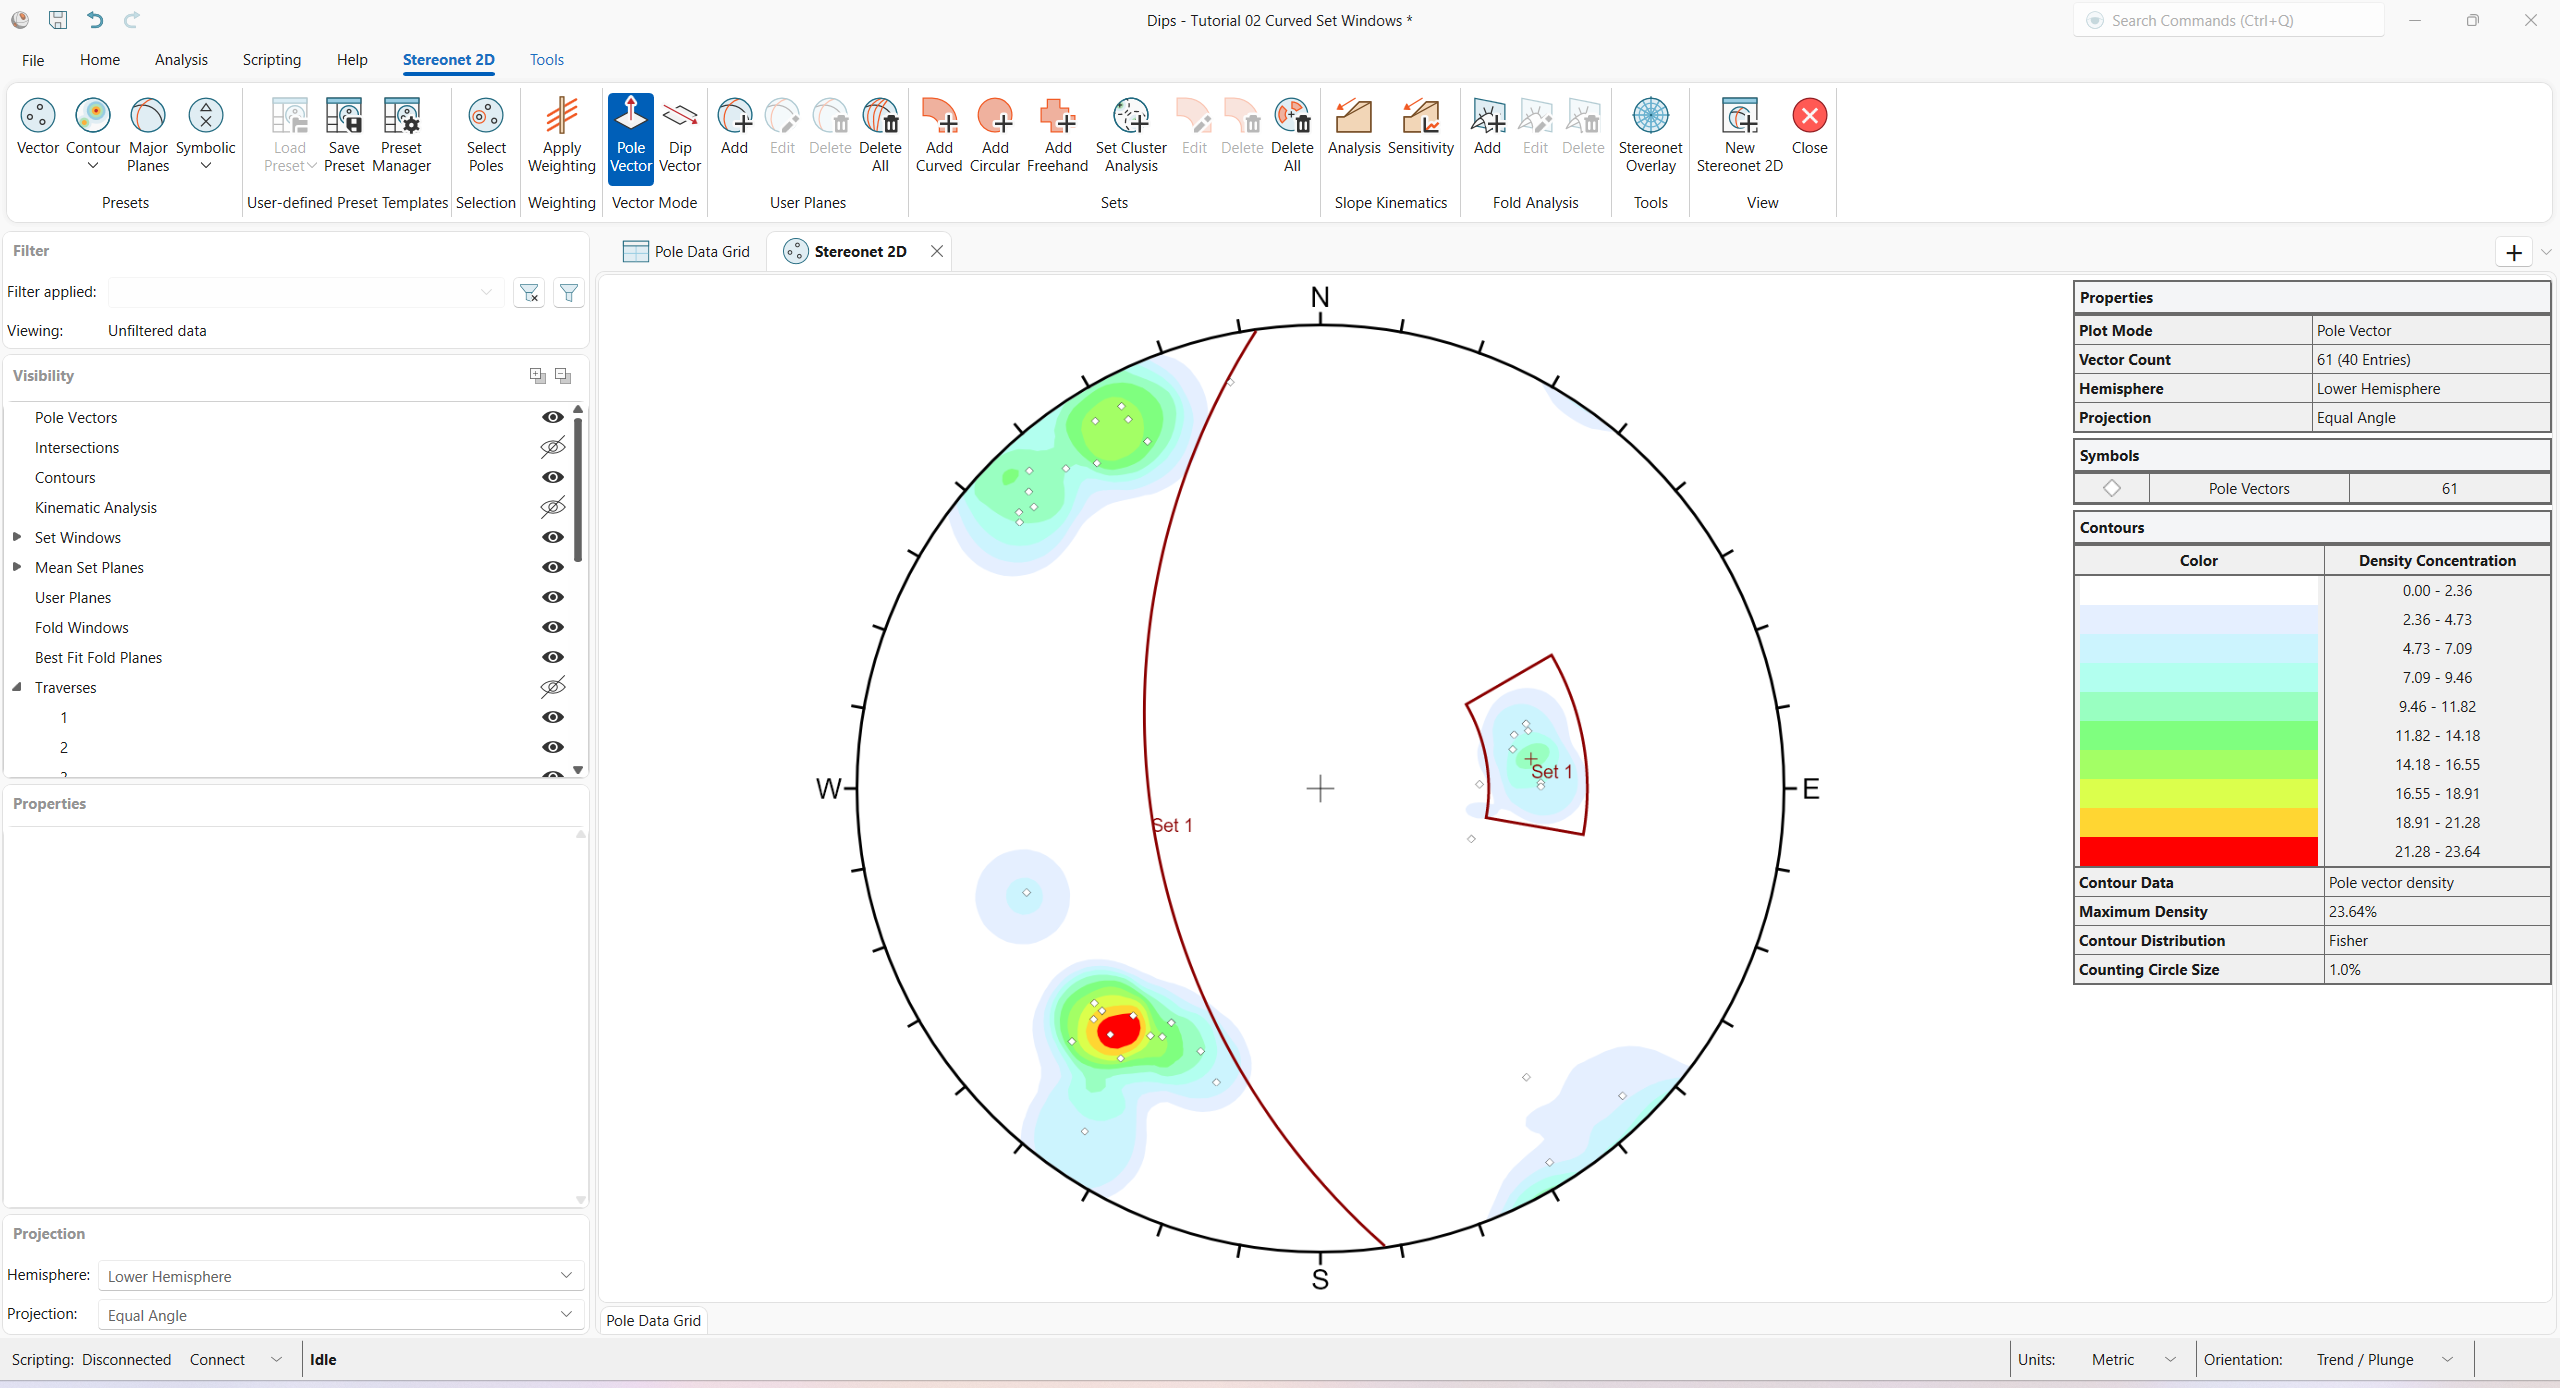
When the Set Window is created, you will notice the following, as shown in the above figure:
- The Set 1 Set Window and corresponding Set 1 Mean Set Plane are shown in the Stereonet 2D view.
- A Set 1 is added to the Set Windows group, and a corresponding Set 1 is added to the Mean Set Planes group in the Visibility tree.
5.2 Data Tips
If you hover the mouse over the Set Window, a pop-up data tip will display:
- Curved Set Window
- Name = Set 1
- Poles = 8
- Entries = 6
The “6 entries” refers to the number of rows of the Pole Data Grid within the Set. Since we have a Quantity column, each row can represent multiple data units (poles). In this case, the 6 rows represent 8 poles.
If you hover the mouse over the Mean Set Plane, a pop-up data tip will display:
- Mean Set Plane (Unweighted)
- Name = Set 1
- Trend = 81.99
- Plunge = 40.59
The display of unweighted or weighted Mean Set Plane(s) is determined by the selection of the Stereonet 2D > Weighting > Apply Weighting option in the ribbon. The orientation is reported according to the selected Orientation reporting convention.
5.3 Set Column
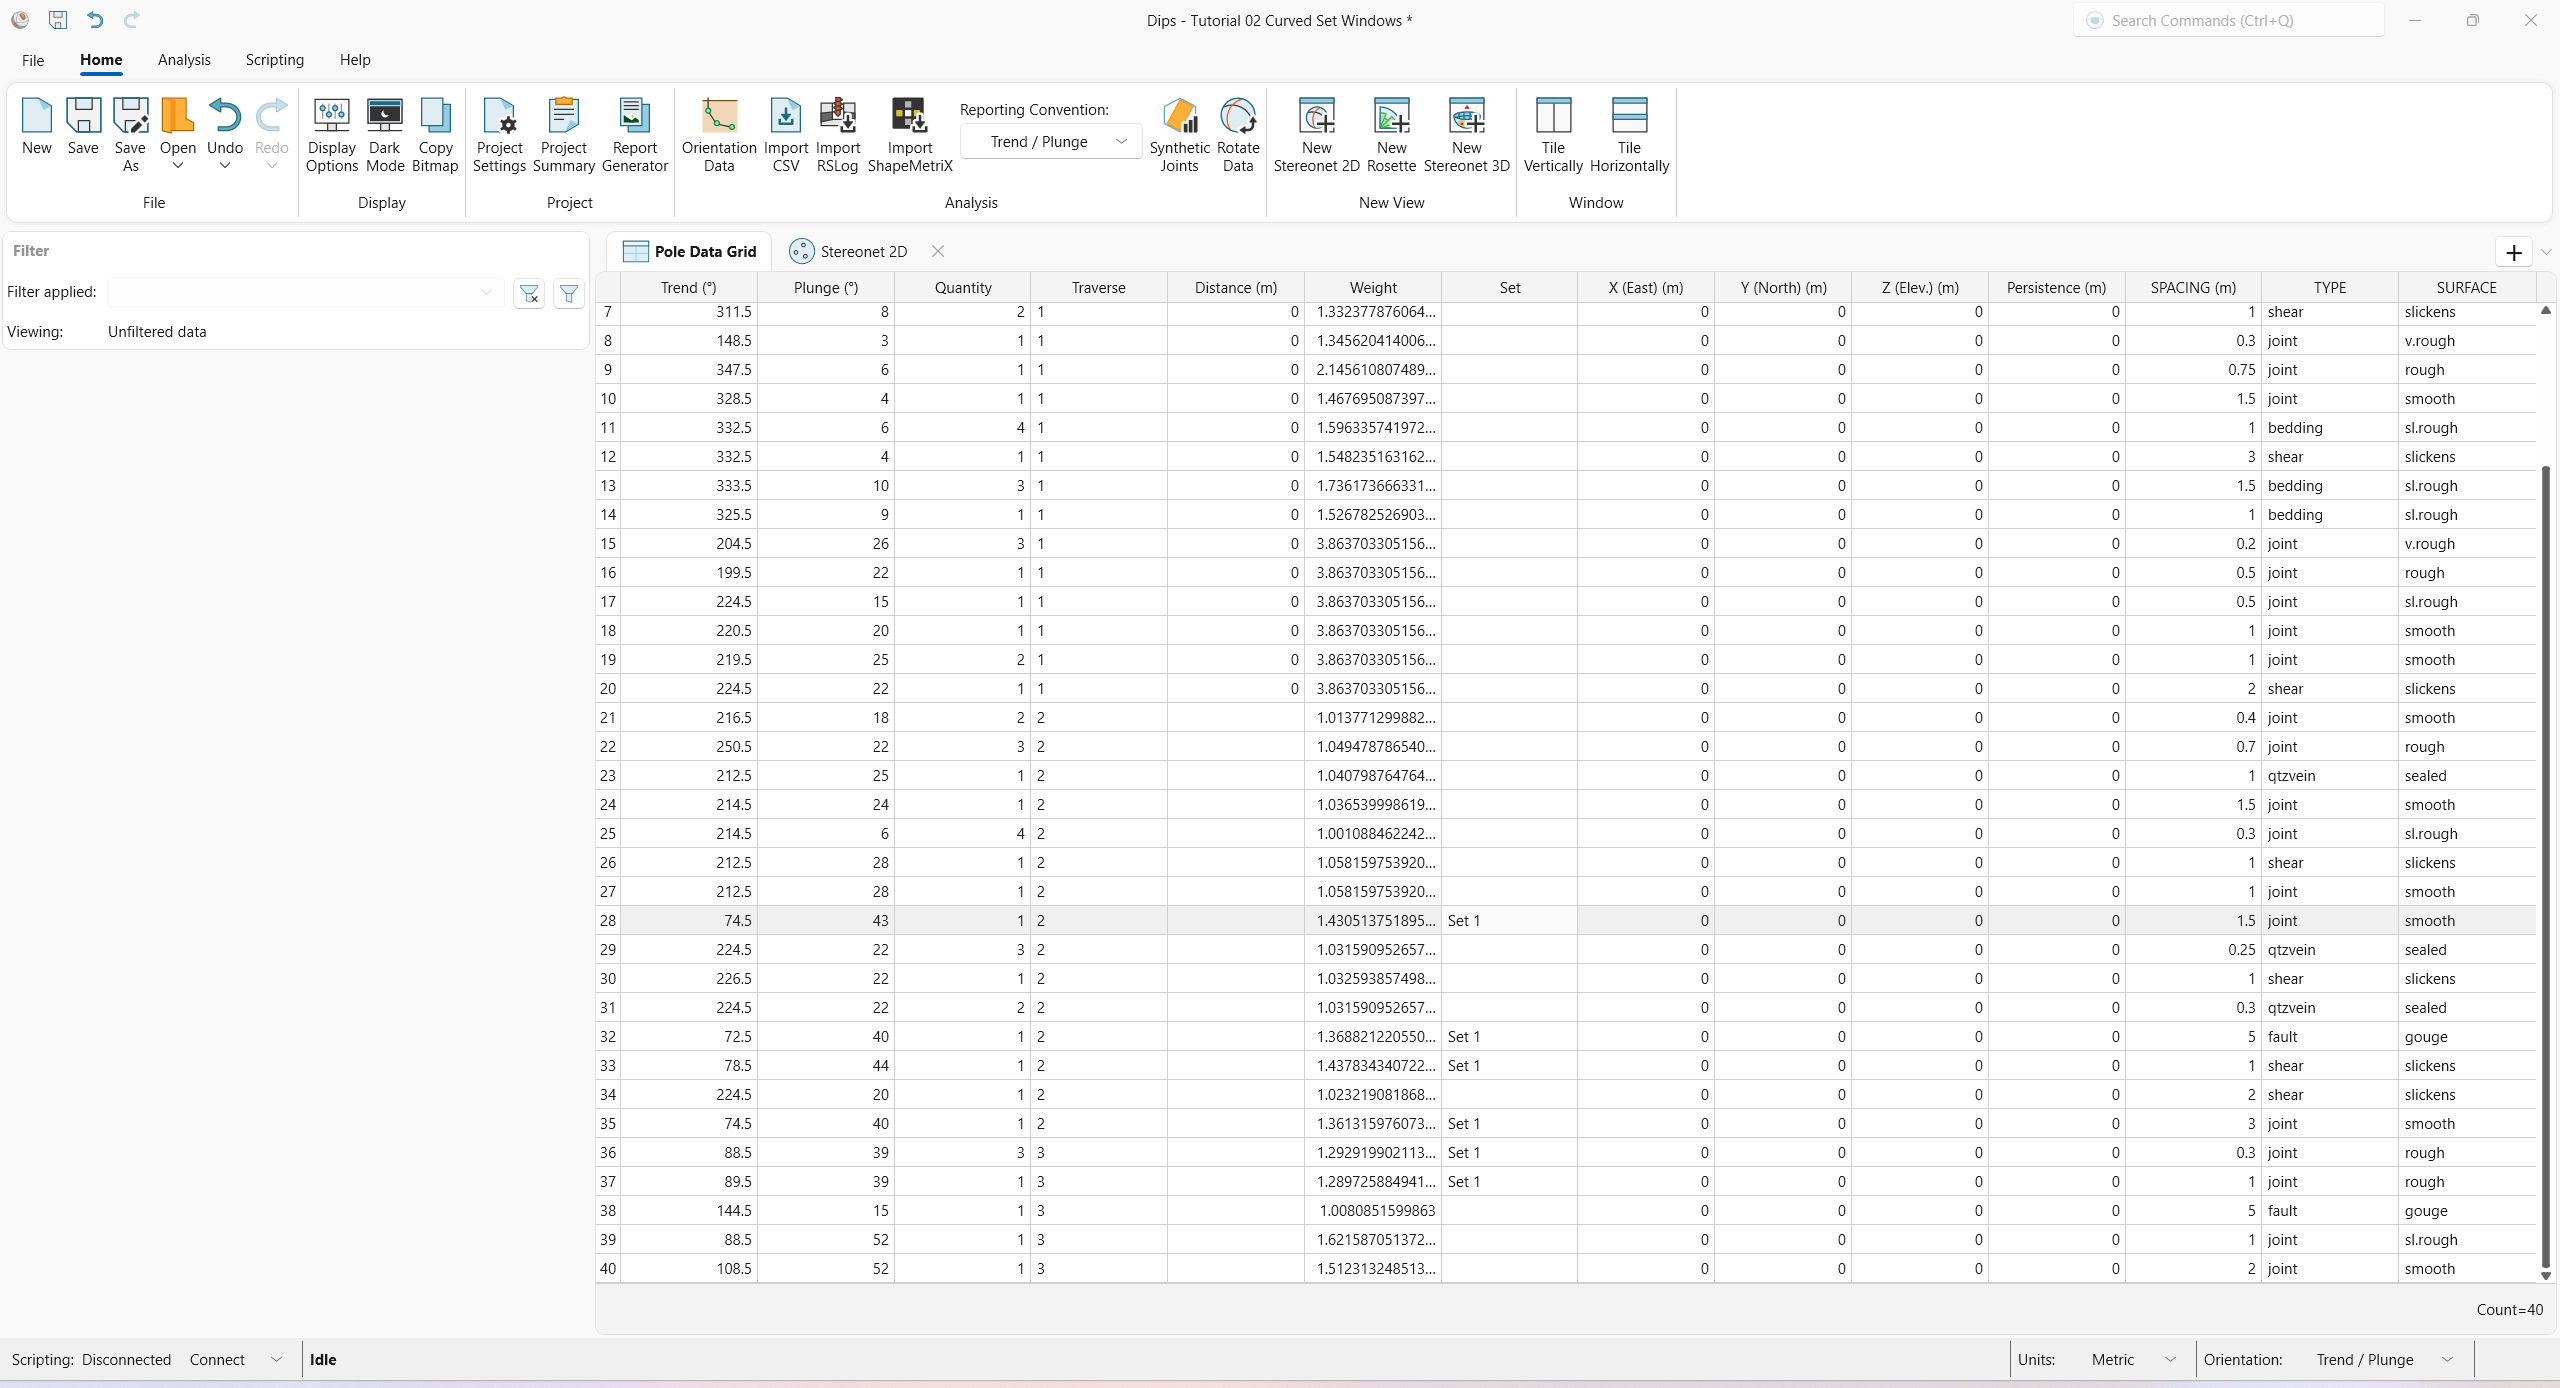
When the first Set is created, a Set column is automatically added to the Pole Data Grid view. The Set column records the Set Name of data belonging to Sets.
- Select the Pole Data Grid view tab.
- Notice the Set column.
- Notice the 6 data rows in the Set column, which are flagged with Set 1. These are the poles within the Set Window just created and correspond to the 6 entries listed in the data tip. The 8 poles are because one pole (row 36) has Quantity = 3 (all others in the Set have Quantity = 1).
- Select the Stereonet 2D view tab to switch back to the Stereonet 2D view.
6.0 Add Wrapped Set Window
We will create another Set, this time with a window which wraps around the perimeter of the stereonet. This allows data near the perimeter, on opposite sides of the stereonet, to be selected as a single Set.
This useful feature of DIPS automatically calculates the correct mean vector for Sets with poles plotting on opposite sides of the equator, since a mean orientation calculated from the Lower Hemisphere alone will be incorrect! The poles within a wrapped Set Window that plot on the opposite side of the stereonet are incorporated into the vector addition as negative poles (i.e., plunge = -plunge, trend = trend +180), so that the mean will be correctly calculated.
Let’s create a second Set using a wrapped Curved Set Window.
- Select Stereonet 2D > Sets > Add Curved Set from the ribbon.
- Locate the cursor at approximately Trend/Plunge = 300 / 20, and left-click the mouse button. Remember that the cursor coordinates are displayed in the lower-right corner of the Status Bar.
- Move the cursor to the stereonet perimeter, and you will see that the Set Window reappears on the opposite side of the stereonet.
- Move the cursor so that the wrapped Curved Set Window encloses the poles on the opposite side of the stereonet (Trend/Plunge = 165 / 12) and left-click the mouse button. The Edit Curved Set Window dialog appears.
- Leave the default Name = Set 2.
- Edit the First Corner
and Second Corner coordinates if the window does not enclose the desired data (either directly in the Edit Curved Set Window dialog or graphically by dragging the handles).The checkbox for Wrapped has been automatically selected to indicate that the window coordinates wrap across the stereonet.
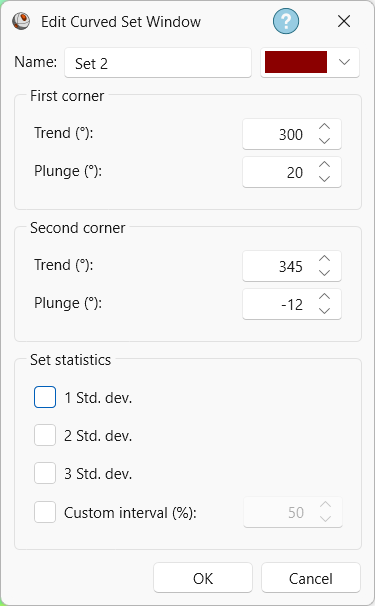
Edit Curved Set Window dialog - Click OK to close the dialog and finalize the Curved Set Window.
Set 2 will be created as shown below.
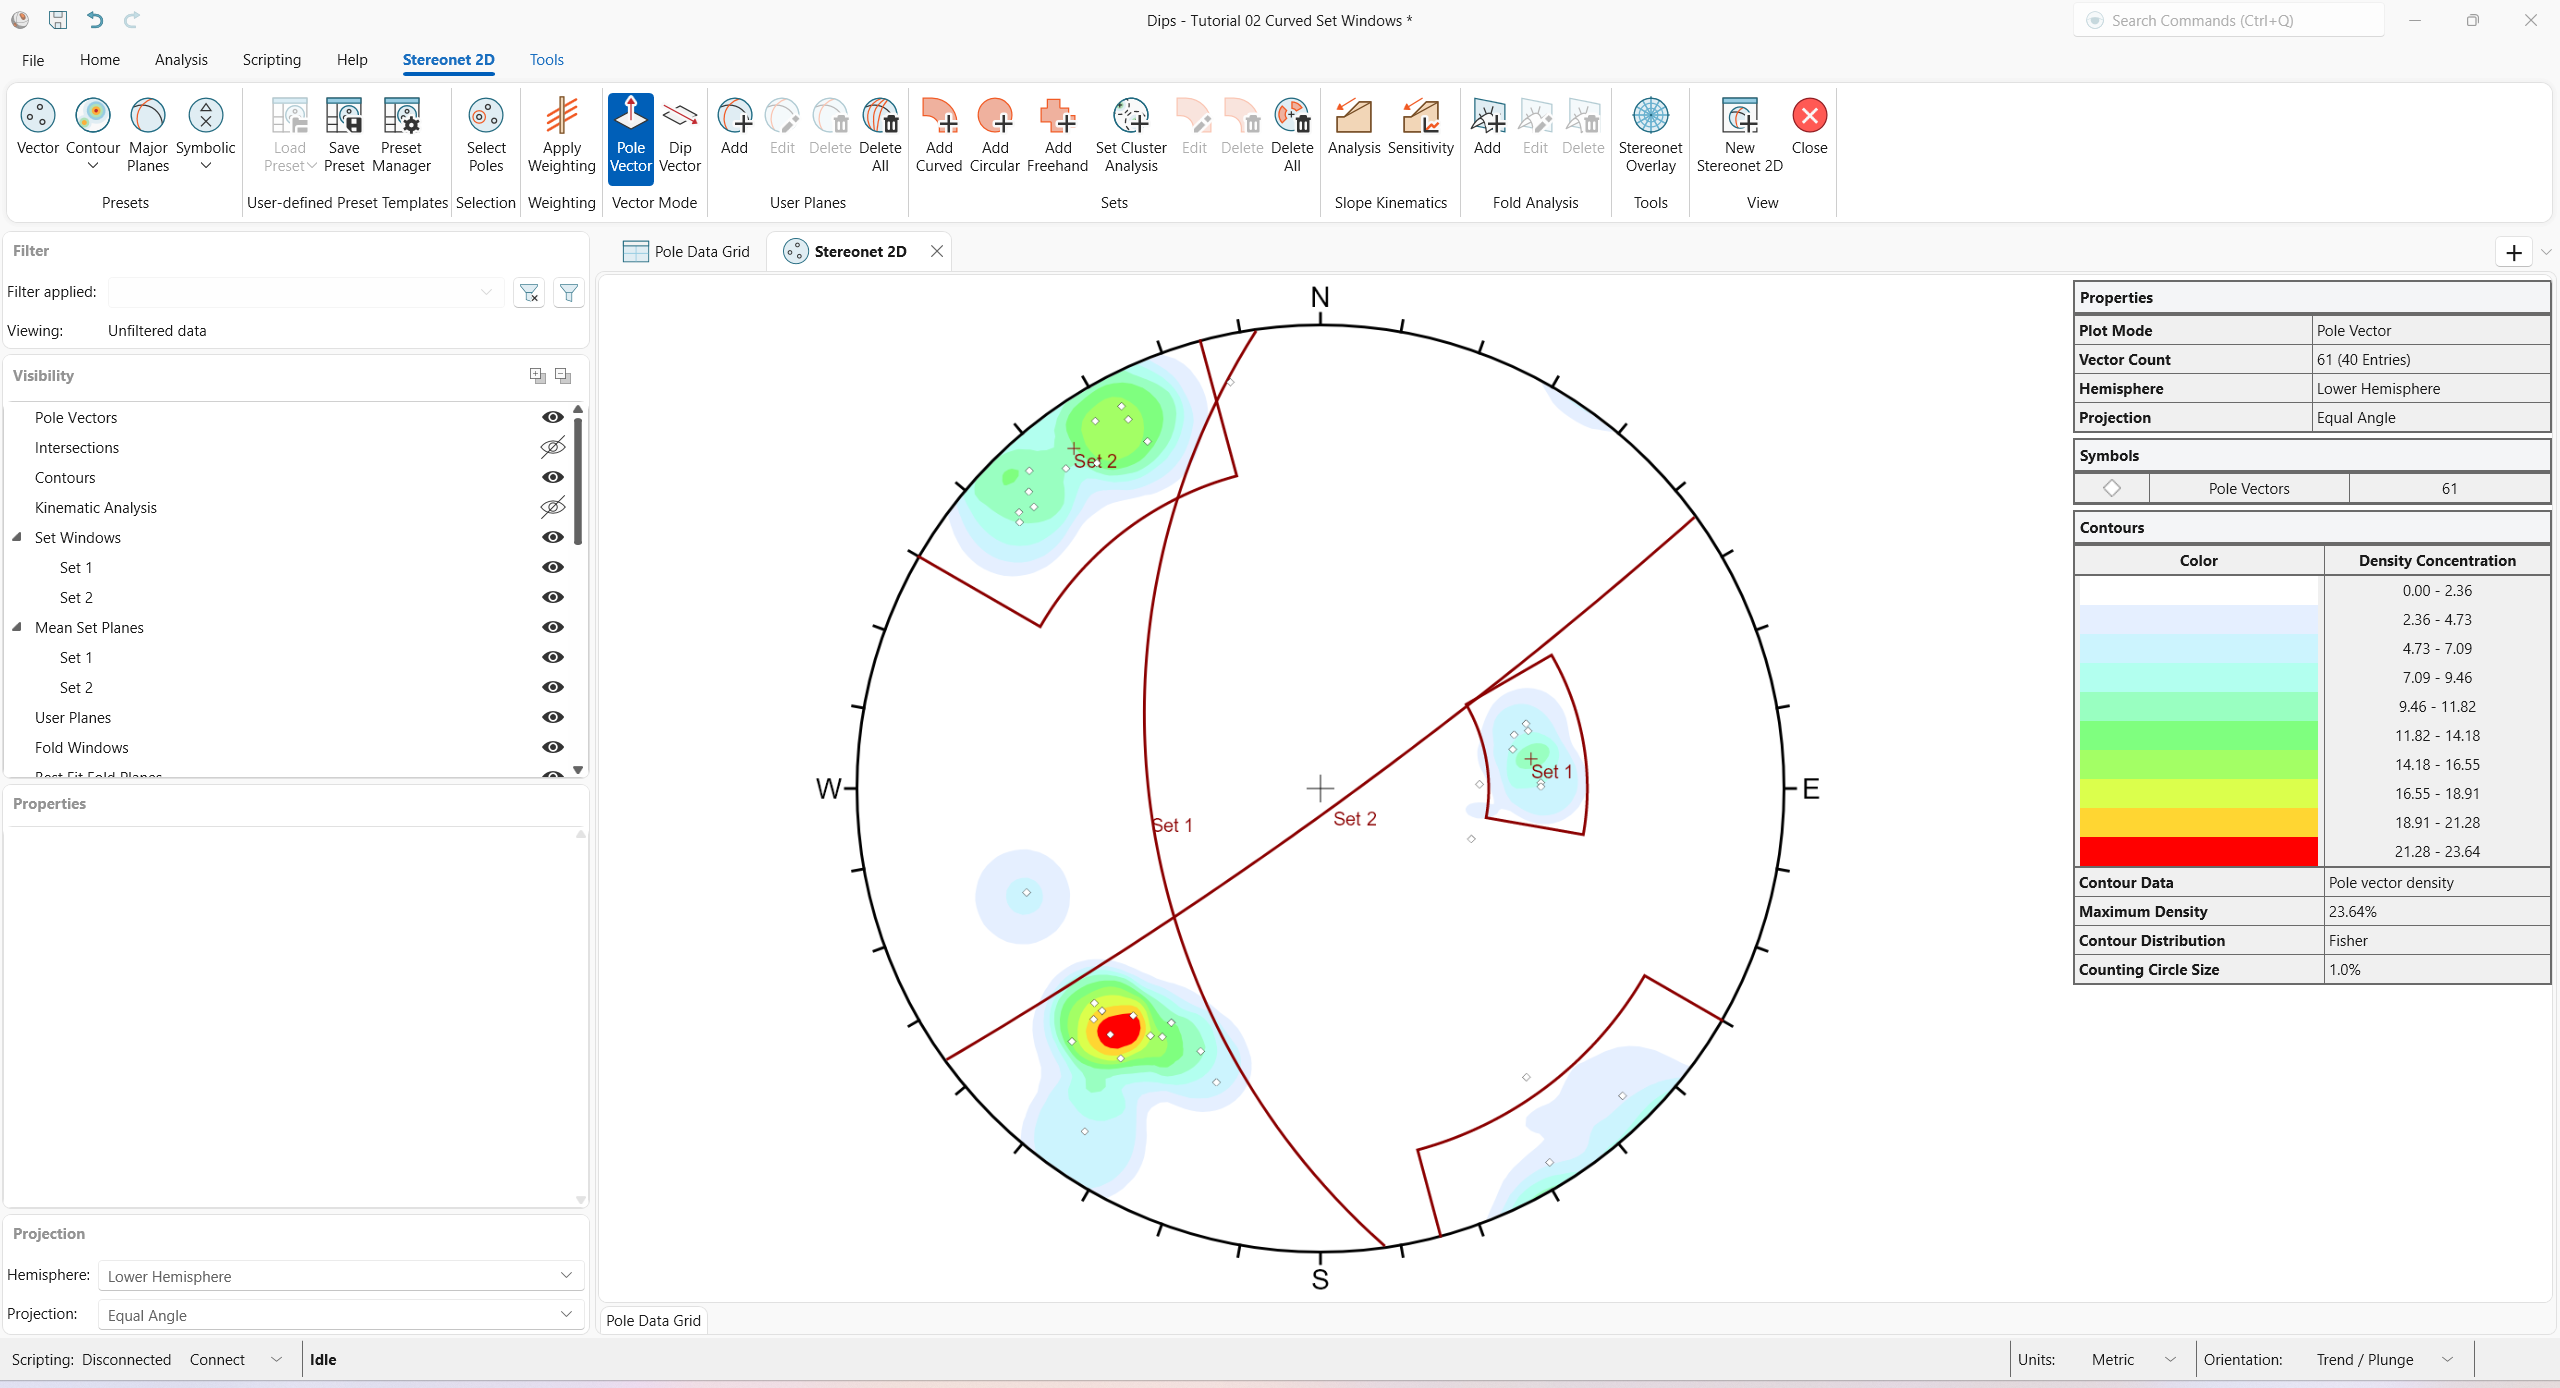
When the Set Window is created, you will notice the following, as shown in the above figure:
- The Set 2 Set Window and corresponding Set 2 Mean Set Plane are shown in the Stereonet 2D view.
- A Set 2 is added to the Set Windows group, and a corresponding Set 2 is added to the Mean Set Planes group in the Visibility tree.
If you hover the mouse over the Set 2 Set Window, a pop-up data tip will display:
- Curved Set Window
- Name = Set 2
- Poles = 20
- Entries = 13
If you hover the mouse over the Set 2 Mean Set Plane, a pop-up data tip will display:
- Mean Set Plane (Unweighted)
- Name = Set 2
- Trend = 324.05
- Plunge = 5.47
Note that the Set column in the Pole Data Grid view is updated to record the data in both Sets 1 and 2. Note also that data which does not currently belong to any Set has a BLANK entry in the Set column.
Now, create a third Curved Set Window around the remaining data concentration on the Contour Plot.
- Select Stereonet 2D > Sets > Add Curved Set from the ribbon.
- Locate the cursor at approximately Trend/Plunge = 190 / 40, and left-click the mouse button. Remember that the cursor coordinates are displayed in the lower-right corner of the Status Bar. If necessary, switch to Orientation = Trend/Plunge reporting convention in the dropdown in the Status Bar.
- Move the mouse in a clockwise direction, and you will see a curvilinear, four-sided Curved Set Window opening up.
- Locate the cursor to approximately Trend/Plunge = 235 / 3, and left-click the mouse button. The Edit Curved Set Window dialog appears.
- Leave the default Name = Set 3.
- Edit the First Corner
and Second Corner coordinates if the window does not enclose the desired data (either directly in the Edit Curved Set Window dialog or graphically by dragging the handles).
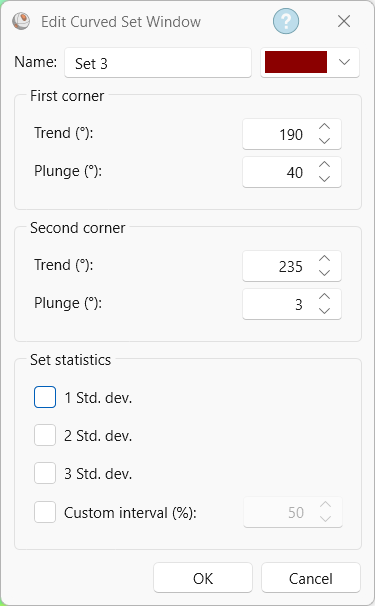
Edit Curved Set Window dialog - Click OK to close the dialog and finalize the Curved Set Window.
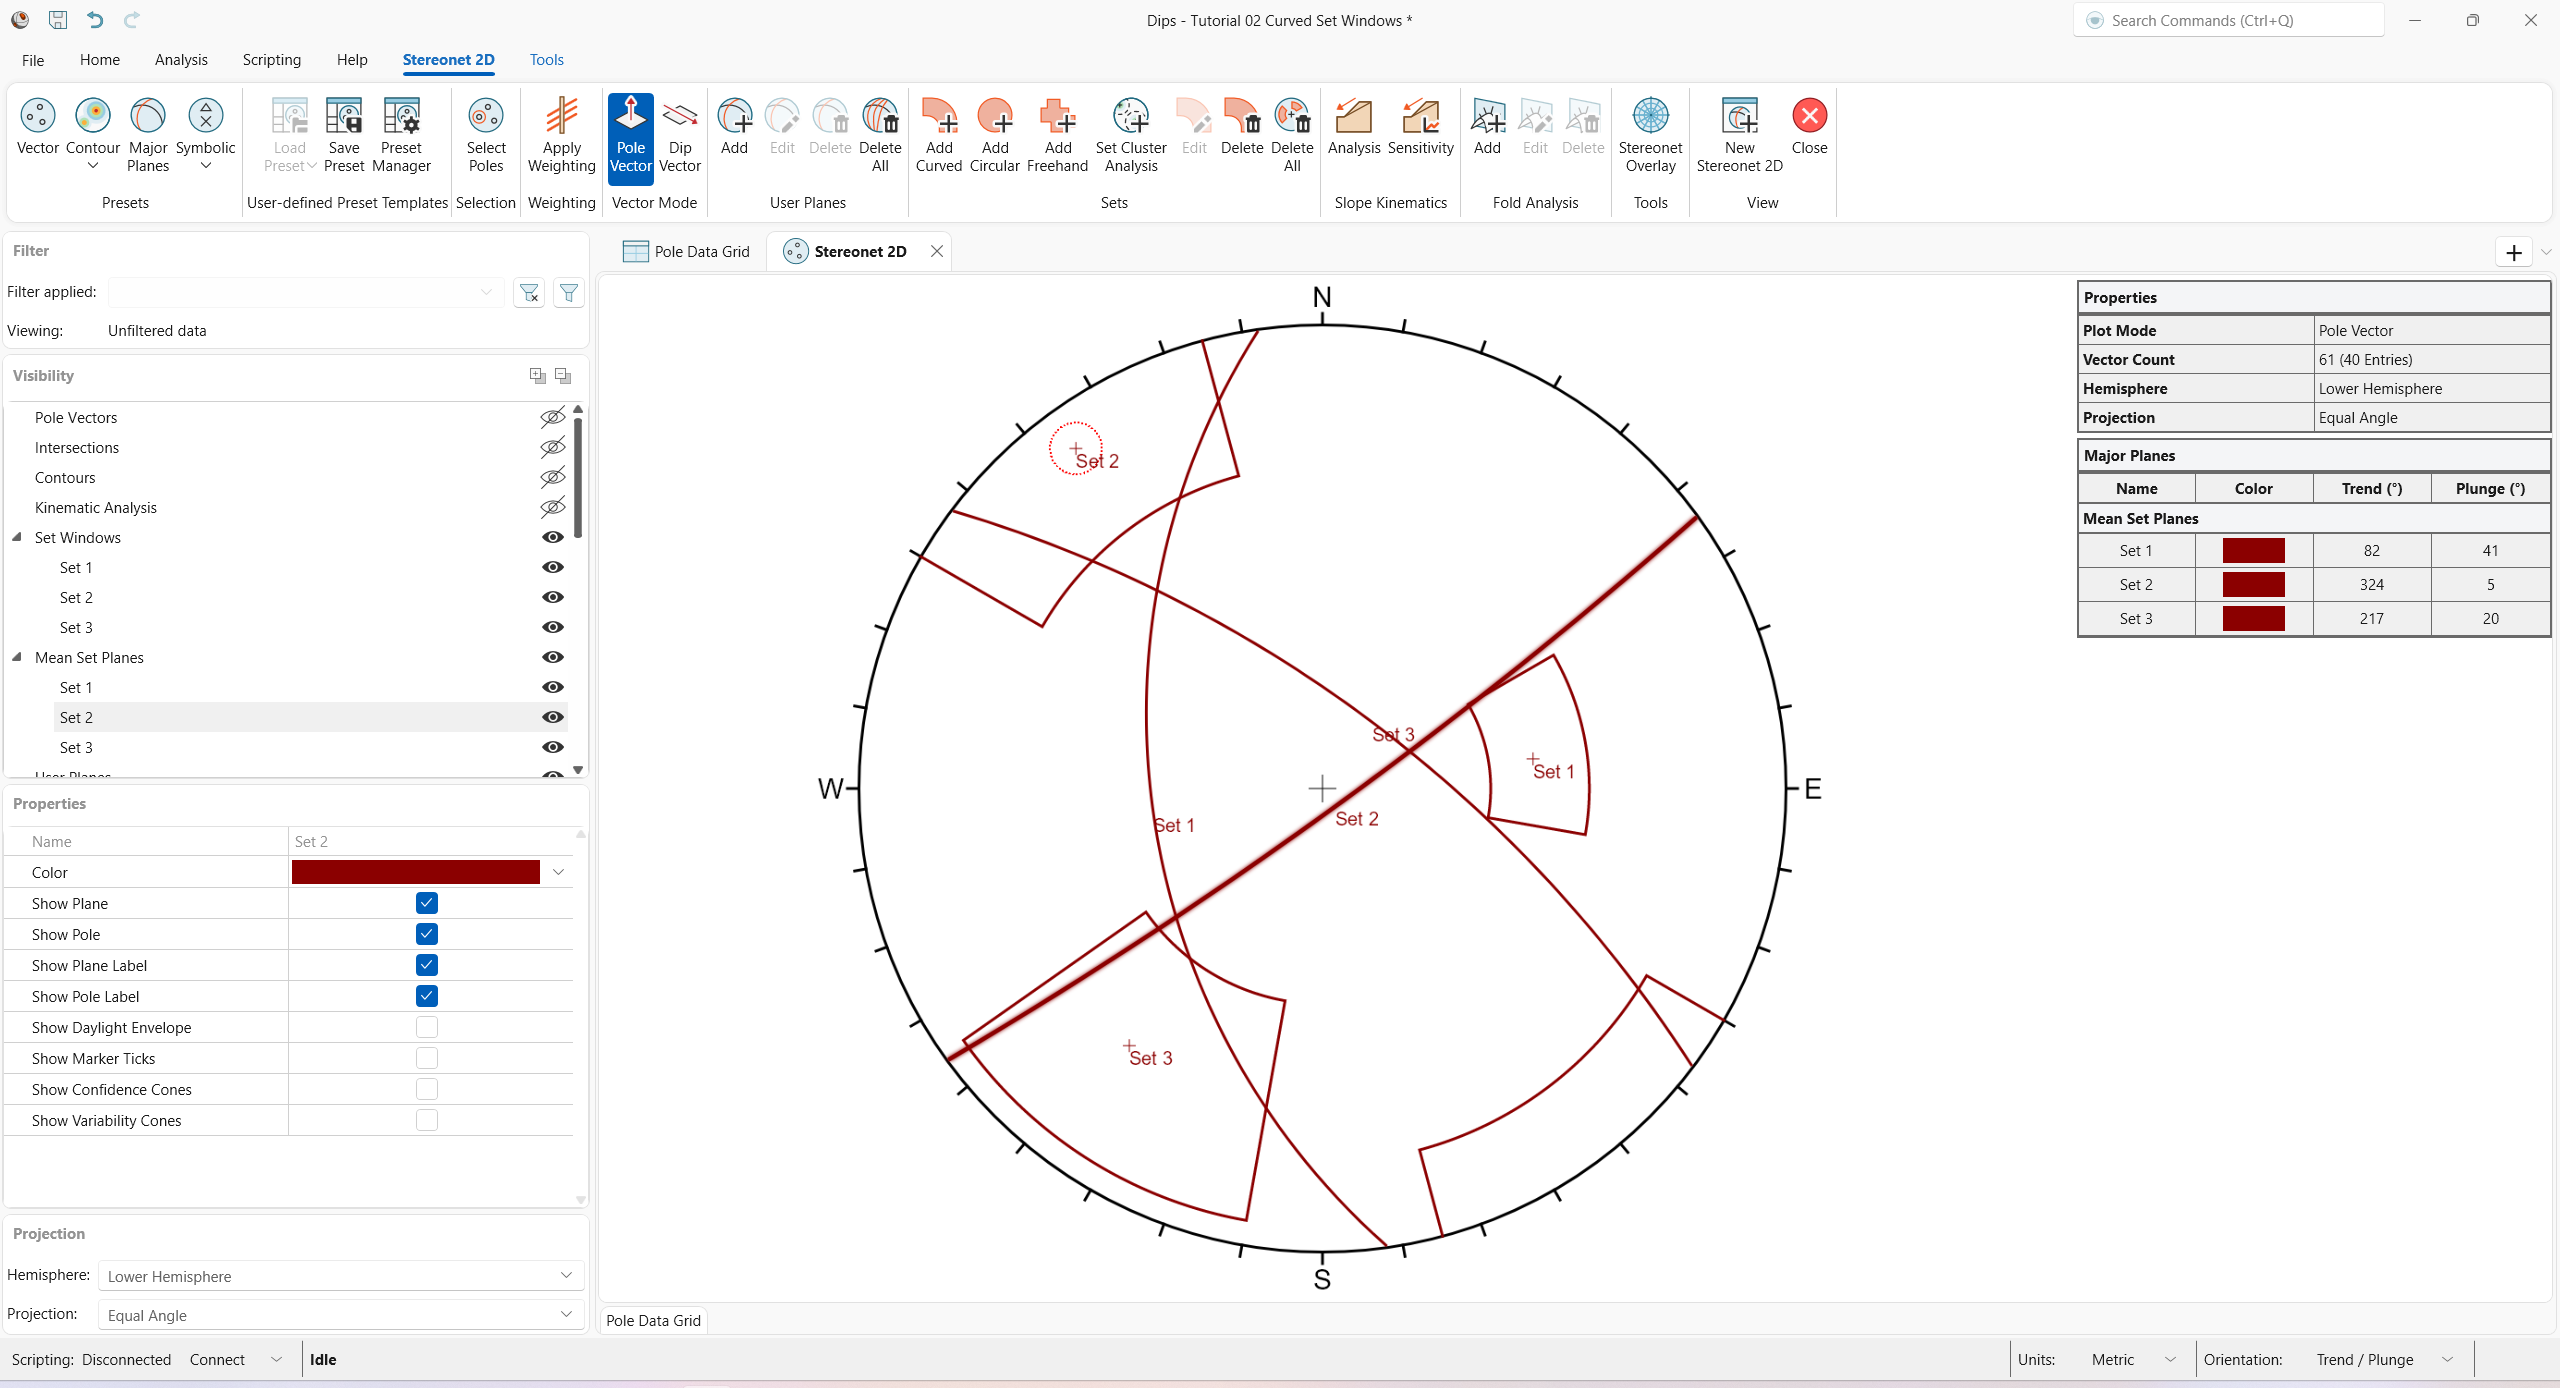
Set 3 will be created as shown below.
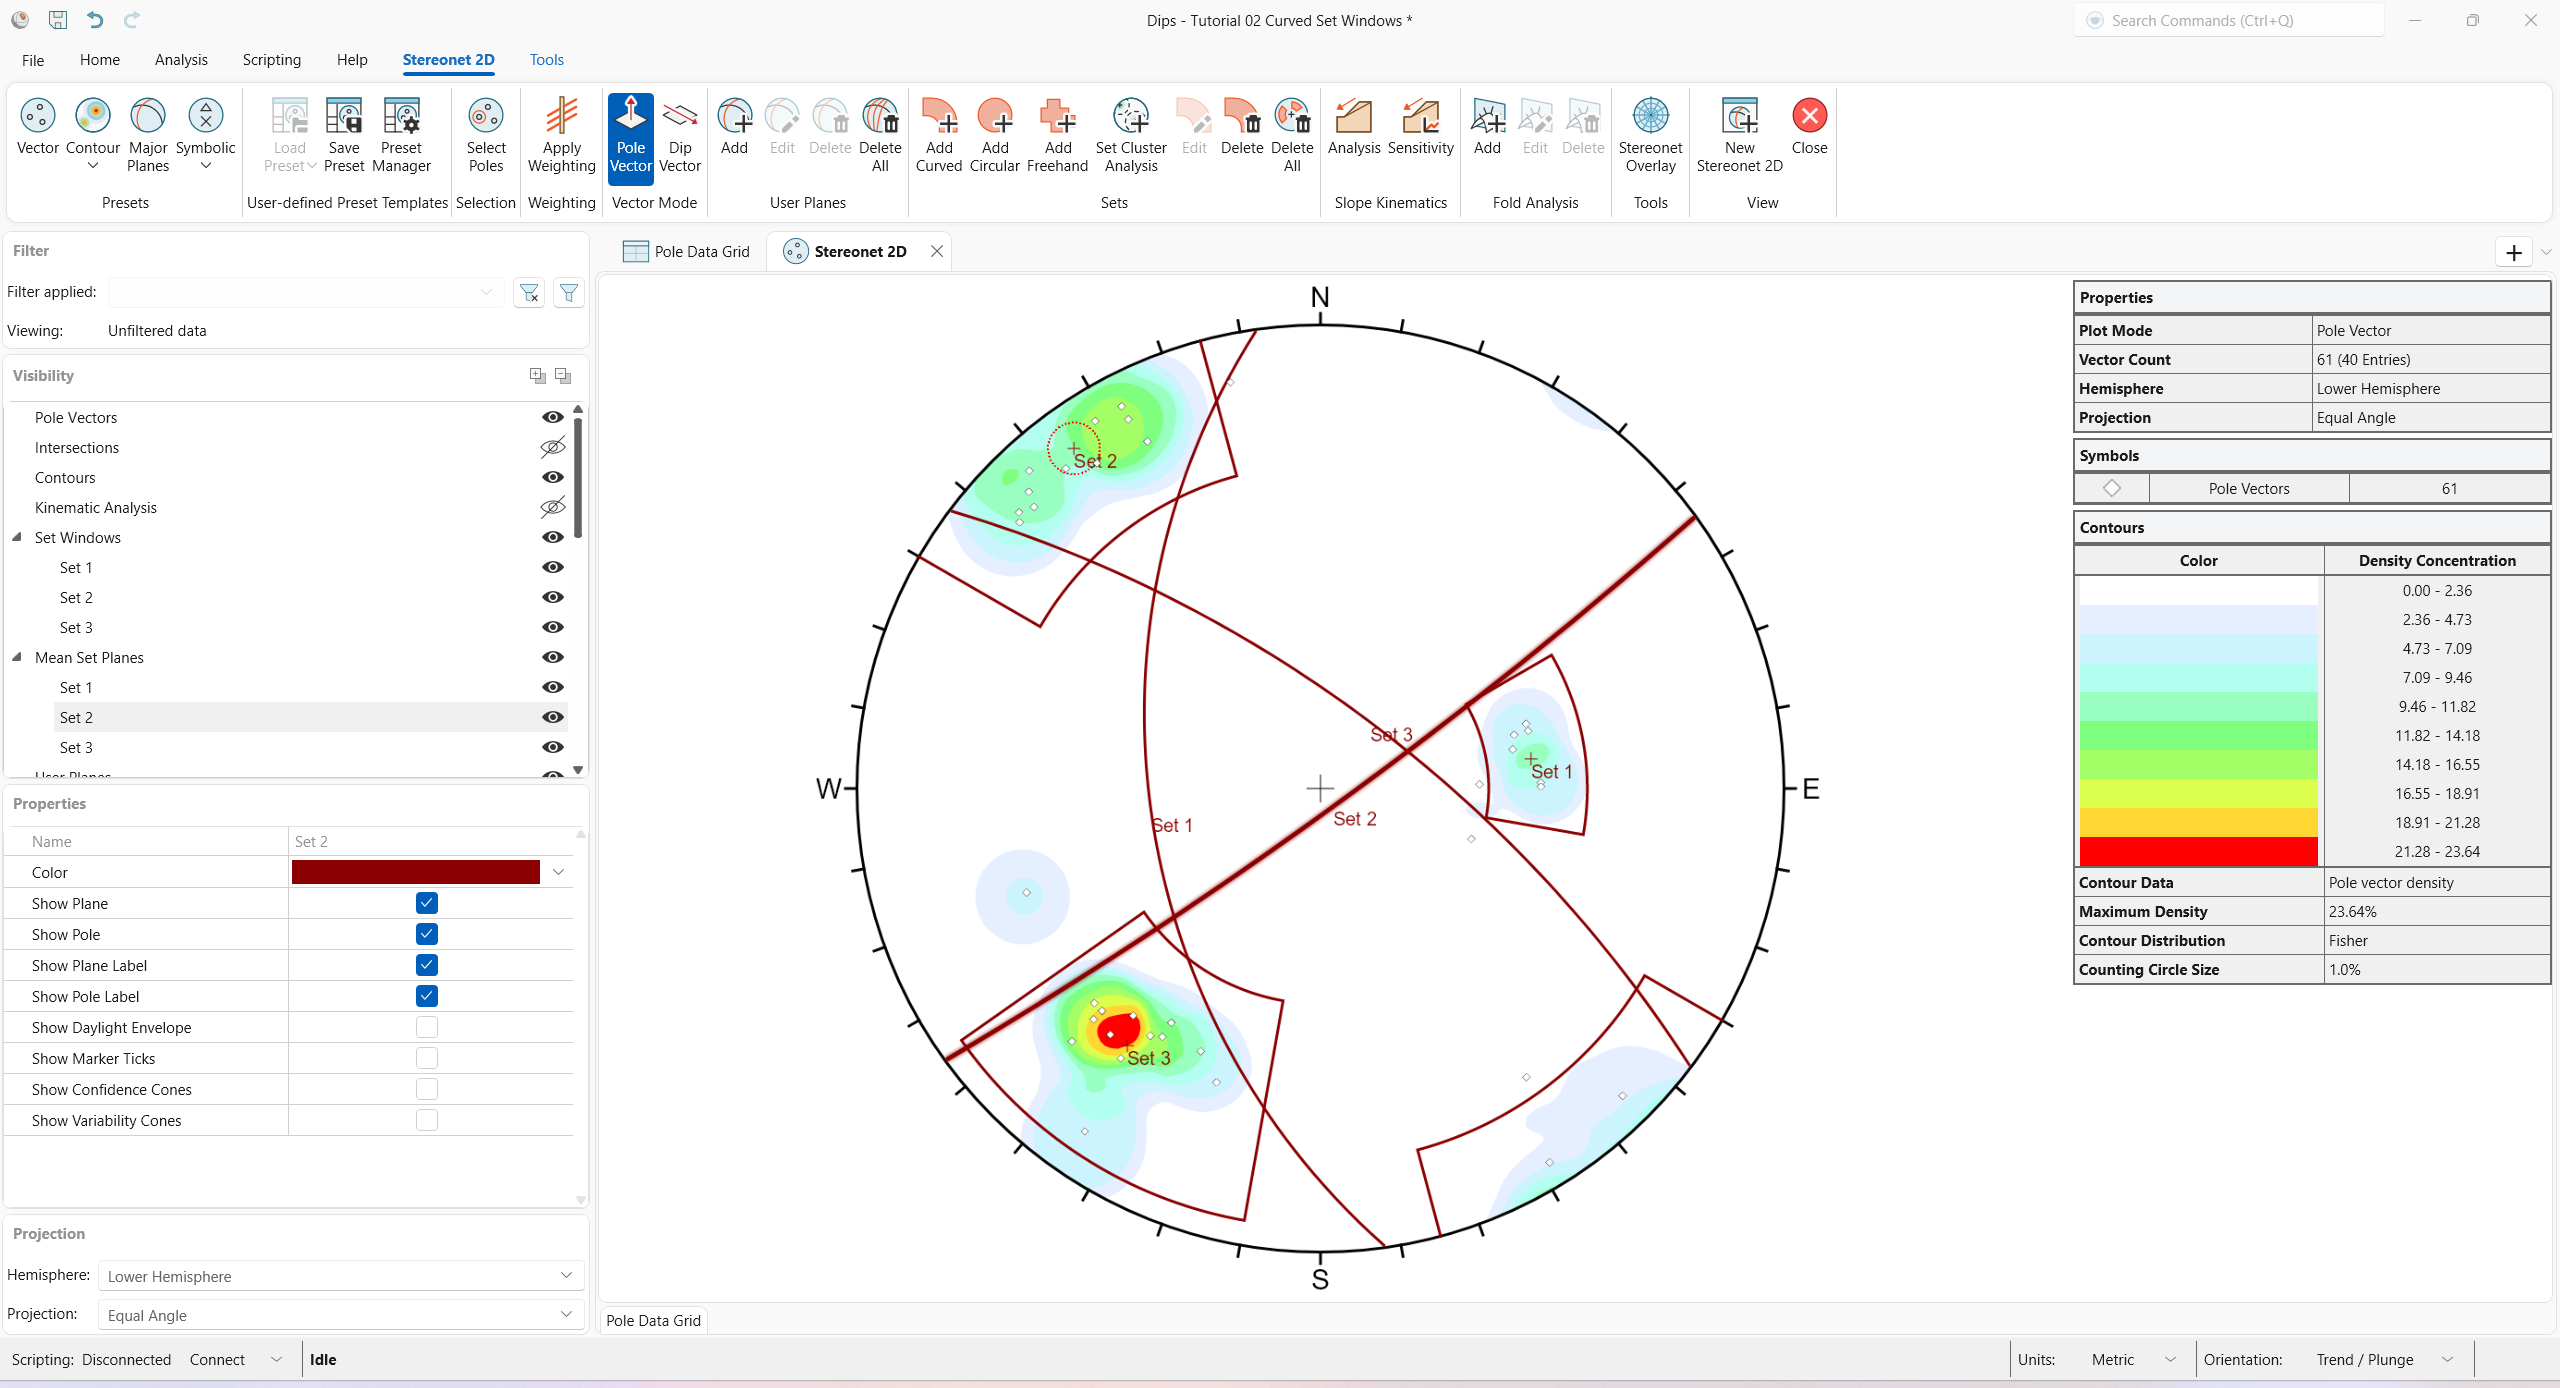
When the Set Window is created, you will notice the following, as shown in the above figure:
- The Set 3 Set Window and corresponding Set 3 Mean Set Plane are shown in the Stereonet 2D view.
- A Set 3 is added to the Set Windows group, and a corresponding Set 3 is added to the Mean Set Planes group in the Visibility tree.
6.1 Data Tips
If you hover the mouse over the Set Window, a pop-up data tip will display:
- Curved Set Window
- Name = Set 3
- Poles = 26
- Entries = 16
If you hover the mouse over the Mean Set Plane, a pop-up data tip will display:
- Mean Set Plane (Unweighted)
- Name = Set 3
- Trend = 216.91
- Plunge = 20.33
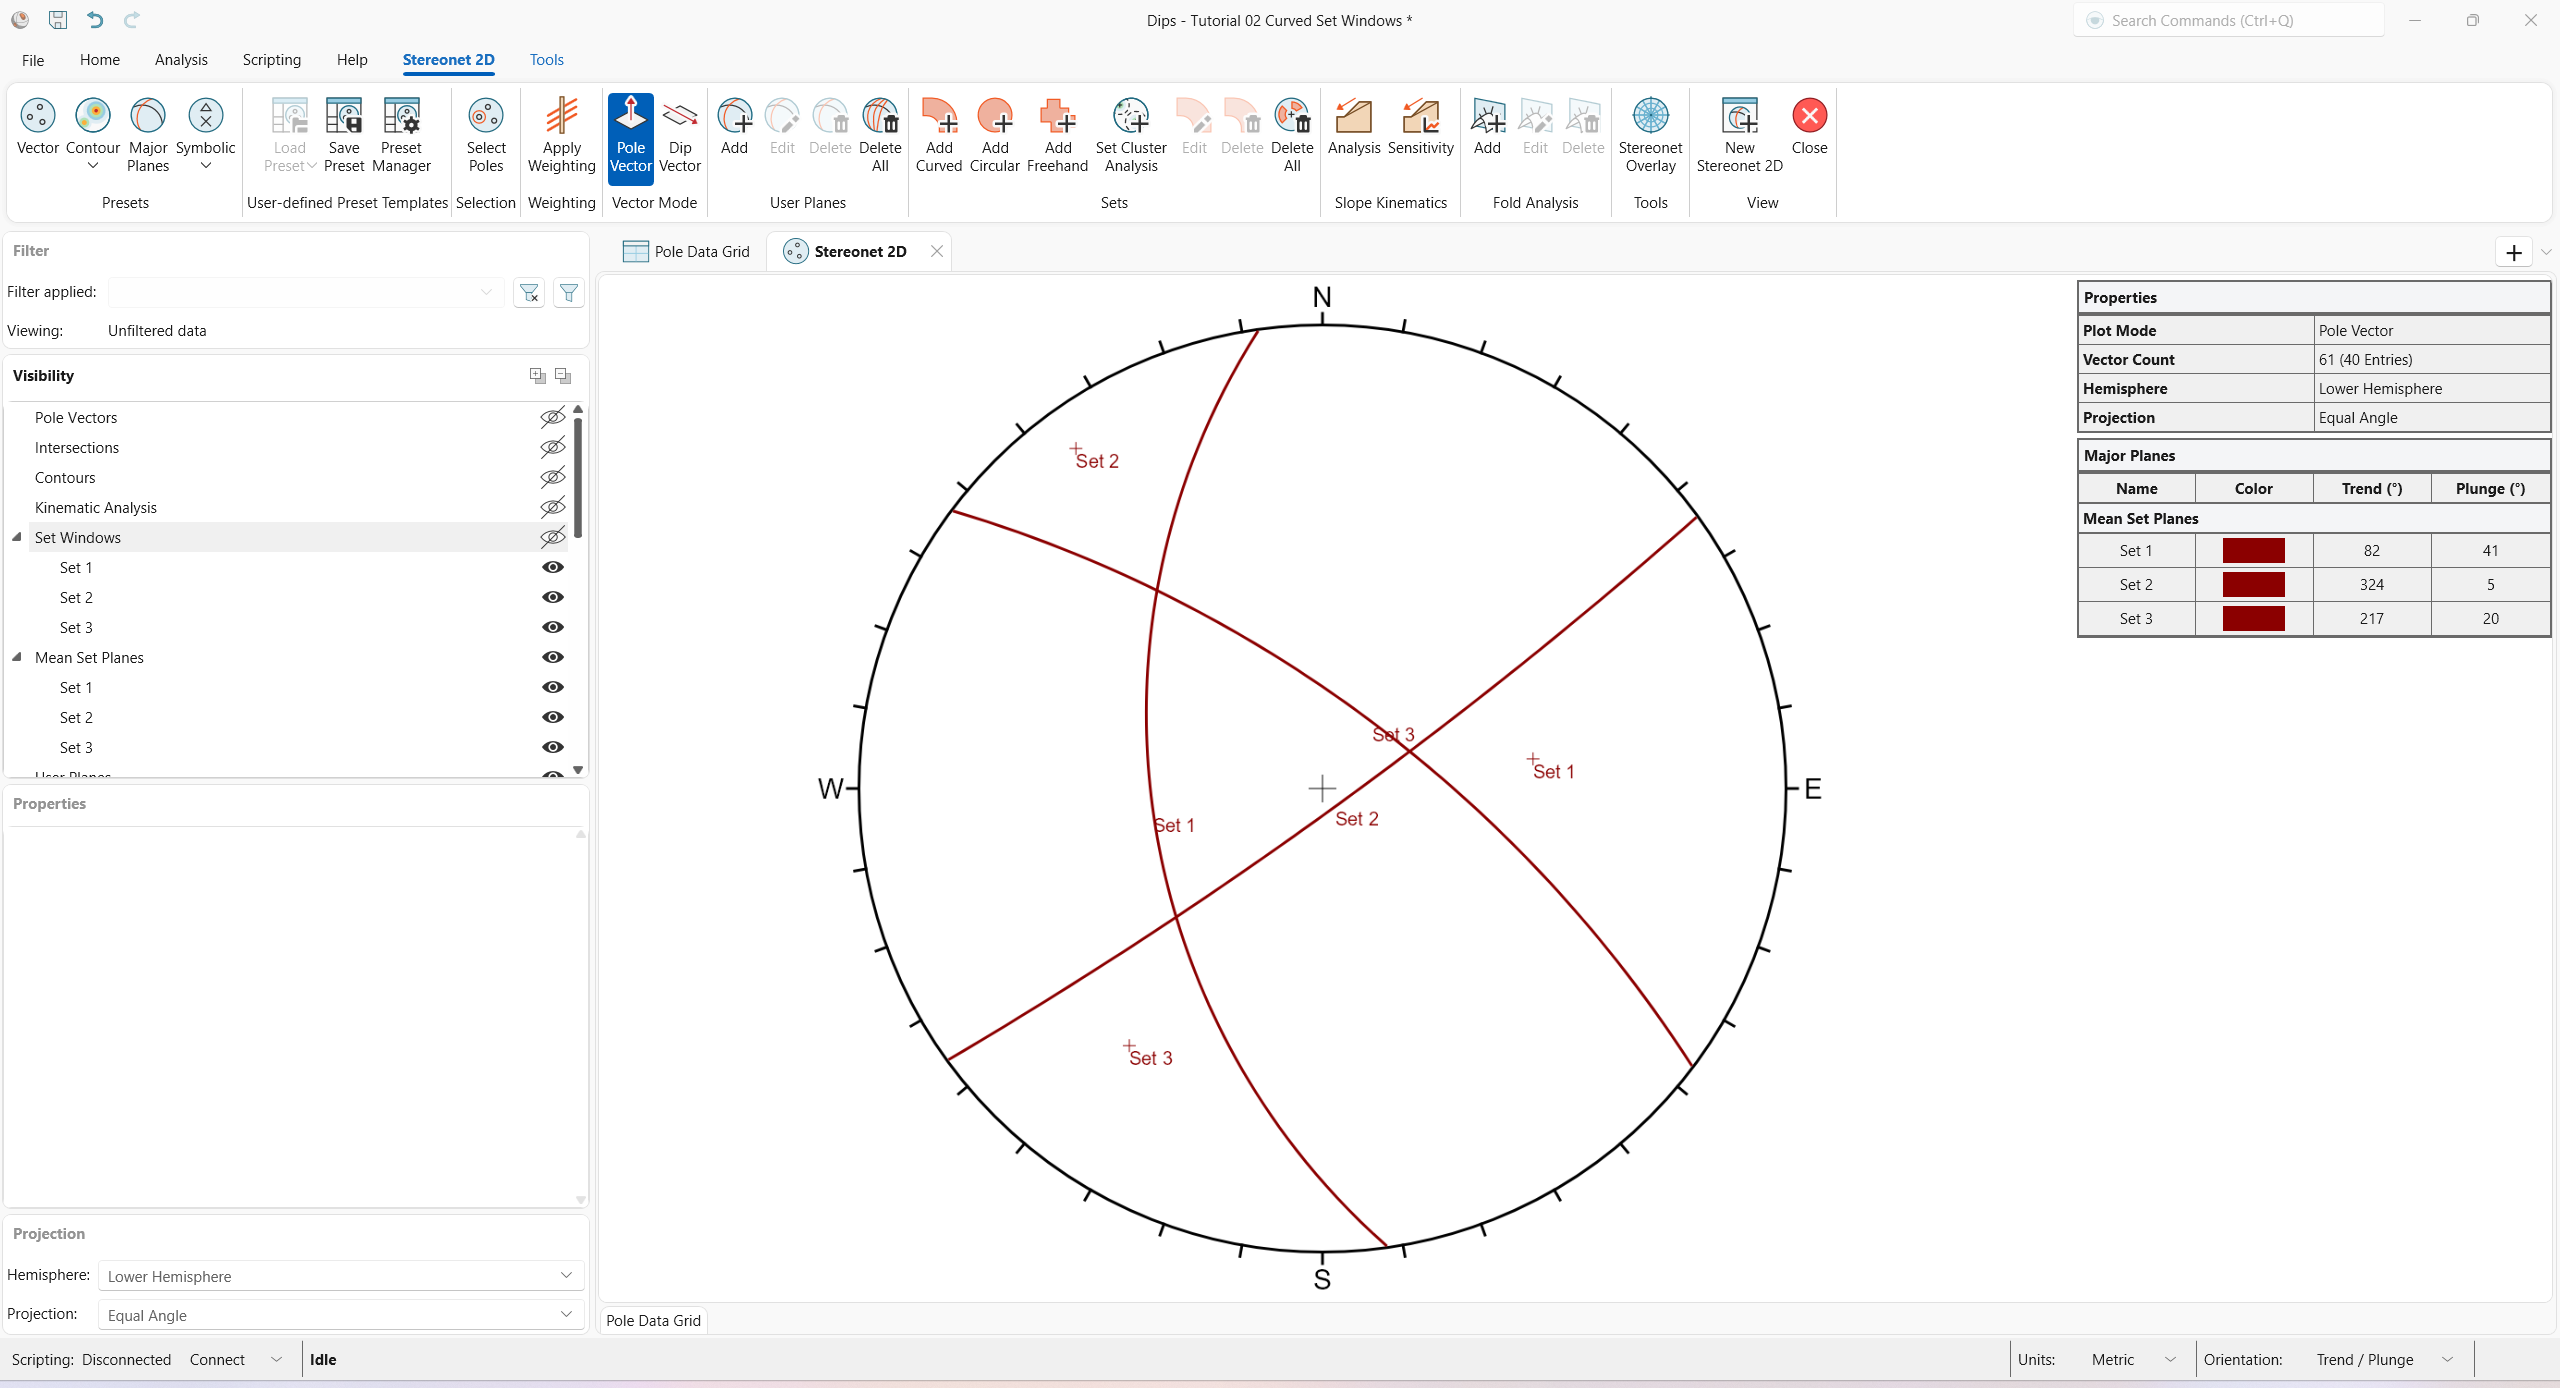
7.0 Major Planes Plot
The Major Planes Plot option in DIPS allows you to view User Planes and Set Windows only on a clean stereonet, without poles or contours. In addition, a listing of plane orientations is displayed in the Legend, in the format governed by the current Orientation reporting convention.
To view only Major Planes on the stereonet:
- Select Stereonet 2D > Presets > Major Planes
 from the ribbon.
The following planes are displayed on a Major Planes Plot:
- All User Planes created with the Add User Plane option, and
- All Mean Set Planes and Set Windows created with the Add Set Window options
Turn off the display of all Set Windows:
- Toggle off the Visibility
 of the Set Windows
group from the Visibility tree.
of the Set Windows
group from the Visibility tree.
7.1 Major Planes Legend
The Major Planes Legend displays a list of Mean Set Planes and User Planes. For each plane the following is displayed:
- Name
- Color
- Orientation in the format governed by the Orientation reporting convention.
Turn on/off the Major Planes Legend section with Legend Options.
8.0 Properties
Various visibility and display properties can be customized in the Visibility and Properties panes for Set Windows and Mean Set Planes.
This concludes the tutorial. You are now ready for the next tutorial, Tutorial 03 – Freehand Set Windows.