Correlation Coefficient
If you are performing a Probabilistic analysis with SWedge, and you are using the Mohr-Coulomb strength criterion, you may define a correlation coefficient between Cohesion and Friction Angle, for each Joint Set, as described below.
It is known that Cohesion and Friction Angle are related in a general way, such that materials with low friction angles tend to have high cohesion, and materials with low cohesion tend to have high friction angles. The Correlation Coefficient option allows you to define the correlation between these two variables.
By default, when the check box is NOT selected, Cohesion and Friction Angle are treated as completely independent random variables.
The Correlation Coefficient option is only enabled under the following circumstances:
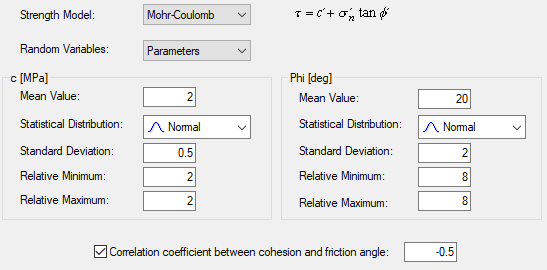
- The Strength Model = Mohr-Coulomb.
- The Random Variables option = Parameters.
- BOTH the Cohesion and Friction Angle are defined as random variables (i.e. assigned a statistical distribution).
- Normal, Uniform, Lognormal, Exponential or Gamma distributions are defined (will not work for Triangular or Beta distributions).
If all of these criteria are met, then you will be able to select the Correlation Coefficient check box and enter a value of the correlation coefficient.
A negative correlation coefficient is usually used to correlate cohesion and friction angle because the variables are inversely correlated (i.e. high friction angle usually implies low cohesion and vice versa).
Example
In order to see the effect of the correlation coefficient, try the following:
- Create a file with probabilistic input data.
- Use Normal or Uniform distributions for Cohesion and Friction Angle.
- For Joint Set 1 or Joint Set 2, select the "Correlation coefficient between cohesion and friction angle" check box, in the Input Data dialog.
- Enter a correlation coefficient. (Initially, use the default value of –0.5.)
- Run the probabilistic analysis.
- Create Scatter Plots of Cohesion vs. Friction Angle for Joint Set 1 or Joint Set 2.
- Note the correlation coefficient listed at the bottom of the Scatter Plots. It should be approximately equal to the value entered in the Input Data dialog. (It will not in general, be exactly equal to the user-defined correlation coefficient since the results are still based on random sampling of the input data distributions).
- Note the appearance of the plots (i.e. the degree of scatter between the two variables).
- Repeat steps 4 to 8, using correlation coefficients of -0.6 to -1.0, in 0.1 increments. Observe the effect on the Scatter Plots. Notice that when the correlation coefficient is equal to –1, the Scatter Plot results in a straight line.