Direct Toppling
The Direct Toppling Kinematic Analysis failure mode is a test for Direct Toppling as defined in Hudson and Harrison (1997).
The key elements of Direct Toppling Kinematic Analysis are:
- Two joint sets intersect such that the intersection lines dip into the slope and can form discrete toppling blocks
- A third joint set exists which act as release planes or sliding planes allowing the blocks to topple
Direct Toppling can be an issue when you have near vertical intersections dipping into the slope and near horizontal base planes which undercut the blocks and form release planes.
Direct Toppling analysis using intersections and pole vectors (base planes)
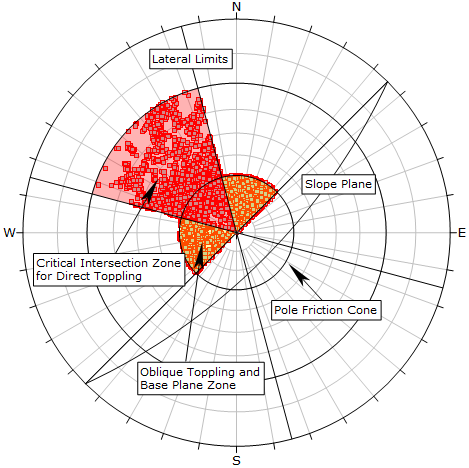
Direct Toppling Kinematic Analysis has several different criteria to simultaneously consider. We will describe them with respect to the three zones labelled in the figure below.
Regions to consider for Direct Toppling analysis
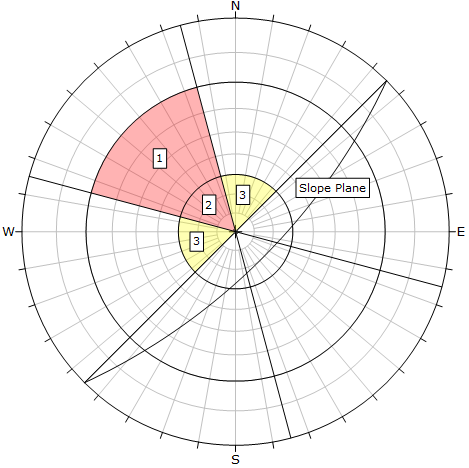
Primary and Secondary Critical Zones
In the above figure, the highlighted red region containing zones 1 and 2 is the primary critical zone for Direct Toppling (intersections and base plane poles). The highlighted yellow region (zone 3) is the secondary critical zone where we consider oblique toppling (intersections and base plane poles).
Critical Intersections - Zones 1 and 2
Intersections which fall in the combined region of zones 1 and 2, represent the risk of formation of toppling blocks. These are intersections which dip into the slope and are within the lateral limits. This region is defined by the following:
- Straight line lateral limits (plus/minus specified angle from the slope dip direction).
- The outer curved limit of this region is given by a circle with cone angle equal to the slope angle. The distance of this boundary from the stereonet perimeter = 90° - slope angle (in the above figure = 90° - 70° = 20° degrees). This defines an upper limit for a toppling type failure mode, and ensures that the angle between the slope face and the toppling blocks is always less than or equal to 90°. For a vertical slope zone 1 would extend to the stereonet perimeter.
Note that intersections which fall in zone 2 are closer to vertical than intersections in zone 1, so may be considered a greater toppling risk than zone 1 intersections which are flatter. The boundary between zone 1 and zone 2 is the friction cone of the base planes. This is not directly relevant to the critical intersections, but is used to delineate a sliding or non-sliding release mode for the base planes.
Critical Intersections - Zone 3
Intersections which fall in zone 3 are referred to as oblique toppling intersections. Basically, as intersections approach vertical, toppling in a direction outside of the lateral limits becomes more likely. To account for this, we consider oblique toppling for near vertical intersections which are outside of the straight line lateral limits.
Again note that the outer circular limit for zone 3 is simply the friction cone of the base planes. Since this is not directly relevant to the critical intersections, this is a somewhat arbitrary boundary and is used for convenience in the analysis. You may adjust this boundary as required for consideration of oblique toppling, by adjusting the value of friction angle.
Critical Base Planes - Zones 2 and 3
Any poles which fall in the combined region of zones 2 and 3 represent base planes which may act as potential release surfaces for the toppling blocks. Poles inside zones 2 and 3 are inside the friction cone, therefore they are not sliding planes but can still act as release planes. Poles in zone 3 are oblique release planes (outside the lateral limits) and poles in zone 2 are within the lateral limits.
NOTE: Although not considered in the Direct Toppling analysis, base planes which dip into the slope, may still act as release planes for Direct Toppling blocks. This is the half-circle region opposite zones 2 and 3, within the friction cone. If a sufficient quantity of poles plots in this region, then these may also be considered as potential base planes even though the planes dip into the slope. Dips does not currently report these poles in the Direct Toppling analysis results, you must keep track of these manually.
Critical Base Planes - Zone 1
Poles which plot in zone 1 represent release planes which are also sliding planes, since the poles plot outside of the friction cone. So if poles plot in zone 1 you may have combined sliding and toppling modes occurring simultaneously.
Lateral Limits
The Lateral Limits for Direct Toppling have the same purpose as described for Planar Sliding. They define the lateral extents of the primary critical zone with respect to the dip direction of the slope. See the Planar Sliding topic for more information. For Direct Toppling note:
- The Lateral Limits must always be defined, they are not optional.
- We also consider the possibility of oblique toppling outside the lateral limits, as described above.
Friction Cone
The friction cone in Direct Toppling serves two purposes:
- Delineates the zones of sliding or non-sliding release planes
- Defines the limits of the oblique toppling zones
Intersection Plotting
The intersection of two planes forms a line in 3-dimensional space. The trend/plunge of the line plots as a single point on a stereonet which we refer to as an intersection. In Dips there are several different options for the display of intersections on the stereonet.
You can plot:
- The intersection of ALL planes in the file (i.e., Grid Data Planes)
- Contours of all intersections (i.e., Grid Data Planes)
- Intersections of major planes (i.e., Mean Set Planes and/or User Planes)
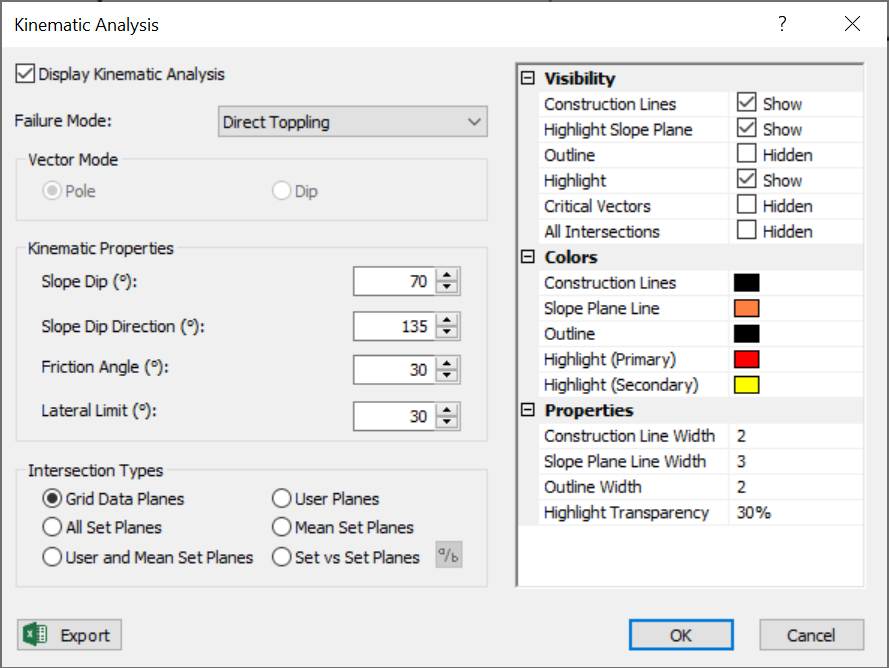
For Direct Toppling analysis you can use any of the above methods of intersection plotting and results will be reported accordingly. See the Intersections Overview topic for more information.
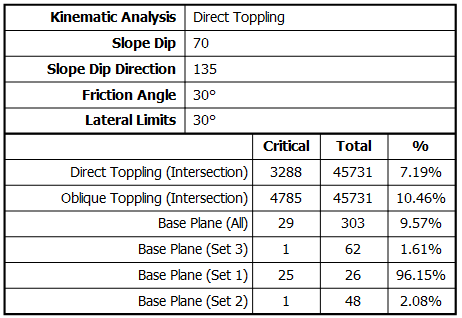
Direct Toppling Results
A summary of Direct Toppling results is displayed in the Legend (critical intersections and base planes).
NOTE: A detailed summary of all Kinematic Analysis results for all failure modes is available in the Info Viewer.