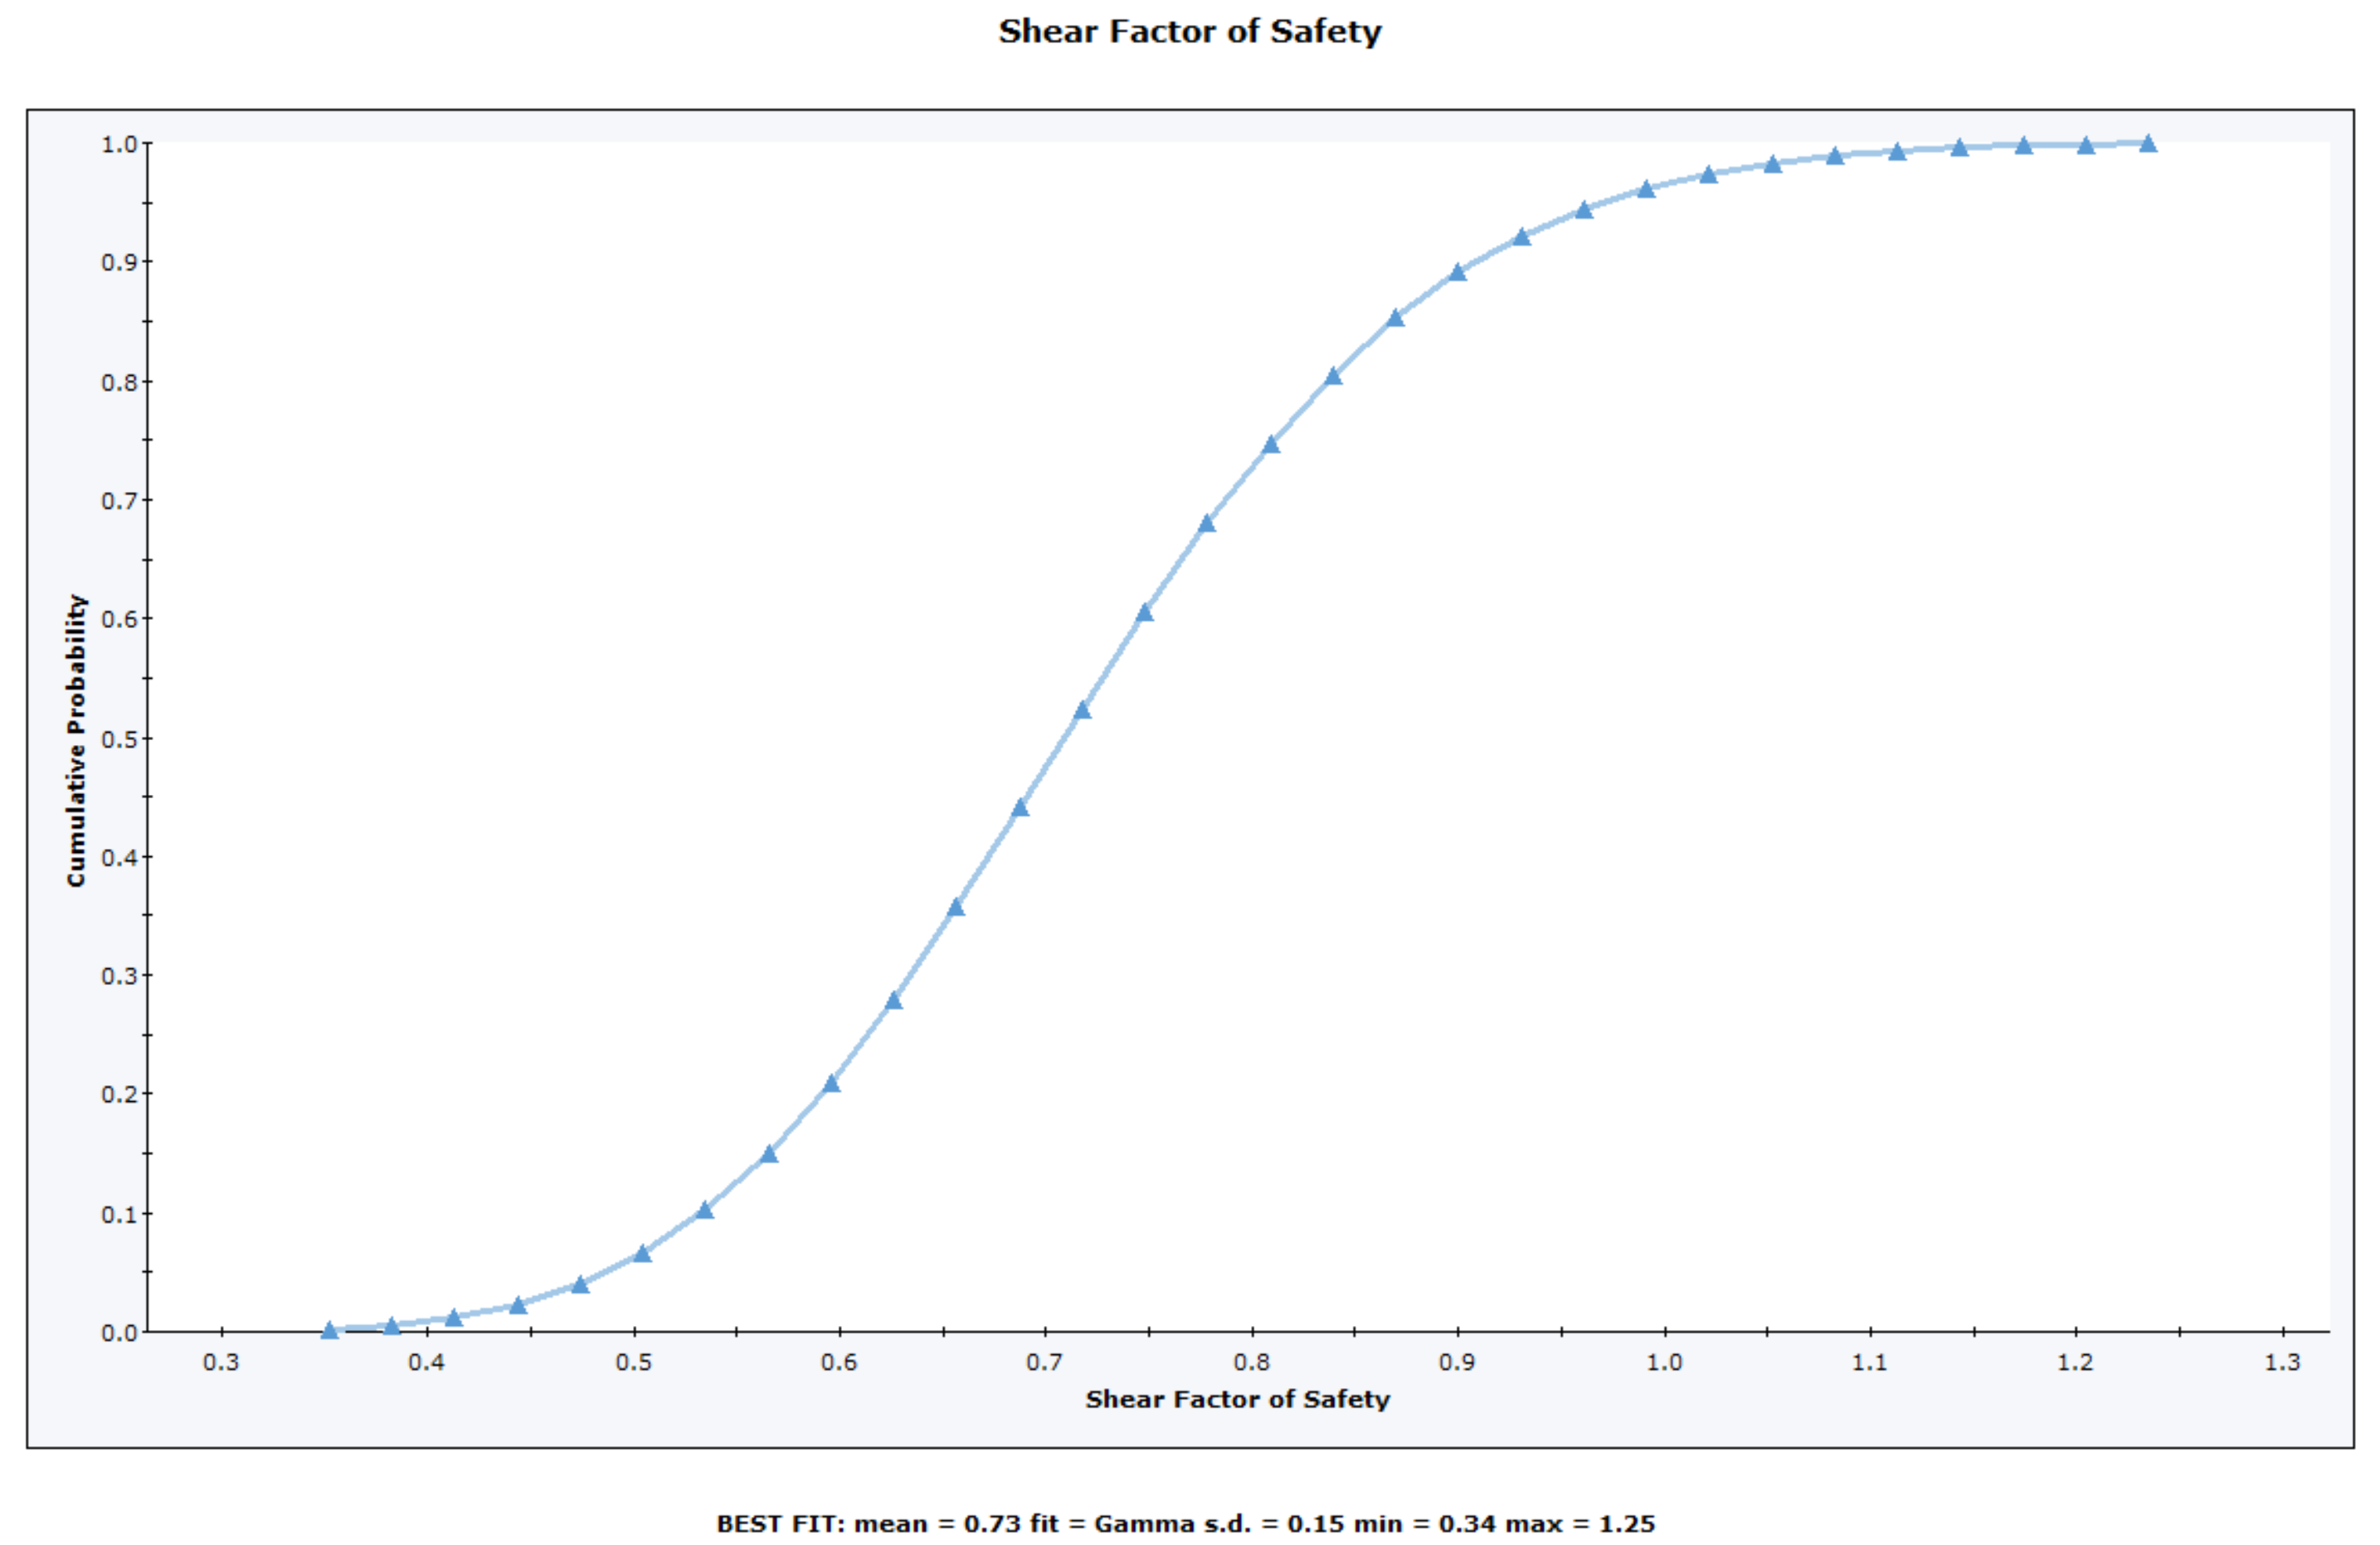
Cumulative Plot
To plot a Cumulative Distribution after a Probabilistic Analysis:
- Select Plot Cumulative
 from the toolbar or Statistics menu.
 - Select the Failure Mode (e.g., Shear, Elastic Buckling, Arch Snap Thru, or Compression, whichever is applicable).
- Select the Data to Plot (e.g., Factor of Safety, or one of your input data random variables).
- Enter a Number of Bins. The default is 30, but any value between 2 and 100 can be entered.
- Select Plot.

The Cumulative Distribution will be generated, and the mean, standard deviation, minimum and maximum values for the data plotted, will be listed at the bottom of the plot.
A Cumulative Distribution is, mathematically speaking, the integral of the normalized probability density function. Practically speaking, a point on the cumulative distribution gives us the probability that a random variable will be LESS THAN OR EQUAL TO a specified value.
Simply put, if (X , Y) is a point on the cumulative distribution S-curve, then Y = the probability that the random variable will be <= X.
The data Sampler allows you to obtain the coordinates of points on the S-curve.
The same Data Types, which can be plotted with Plot Histogram, can also be plotted as Cumulative Distributions – see the Data Type topic for details.

Right-Click Options
Several options are available in the right-click menu for Cumulative Distributions, including:
- Chart Properties
- Change Plot Data
- Copy Chart to Clipboard
- Copy Data to Clipboard
- Plot in Excel