8 - Importing a DIPS File
1.0 Introduction
This tutorial will demonstrate the ability of UnWedge to import a DIPS file into the Joint Orientations tab of the Input Data dialog. This method proves advantageous when analyzing sets of several poles.
Topics Covered in this Tutorial:
- Importing a DIPS File
- Probabilistic Analysis
- Persistence
- Histogram Plot
- Scatter Plot
Finished Product:
The finished tutorial can be found in the Tutorial 08 Importing a DIPS File.weg5 file located in the Examples > Tutorials folder in your UnWedge installation folder.
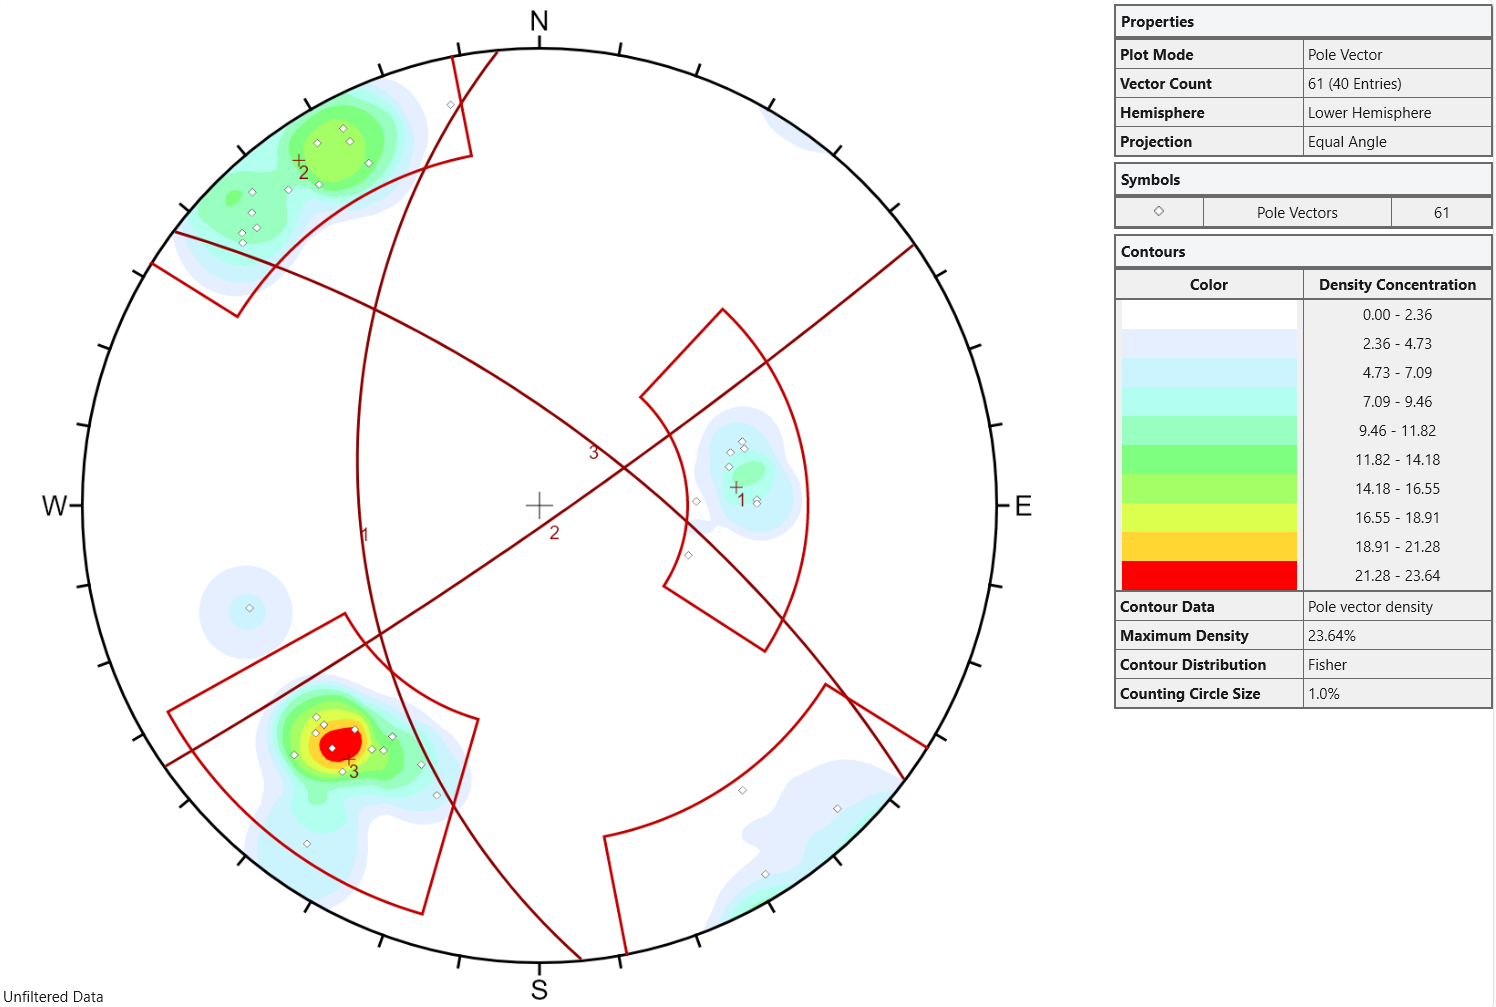
2.0 DIPS File
A DIPS results file has been provided for importing into UnWedge during the tutorial (Tutorial 8.dipsresults). In the file, the plotted poles have been grouped into sets.
The Stereonet View of the plotted data in DIPS looks as follows:
3.0 Model
- If you have not already done so, run the UnWedge program by double-clicking the UnWedge icon in your installation folder or by selecting Programs > Rocscience > UnWedge > UnWedge in the Windows Start menu. When the program starts, a default model is automatically created.
If the UnWedge application window is not already maximized, maximize it now so that the full screen is available for viewing the model.
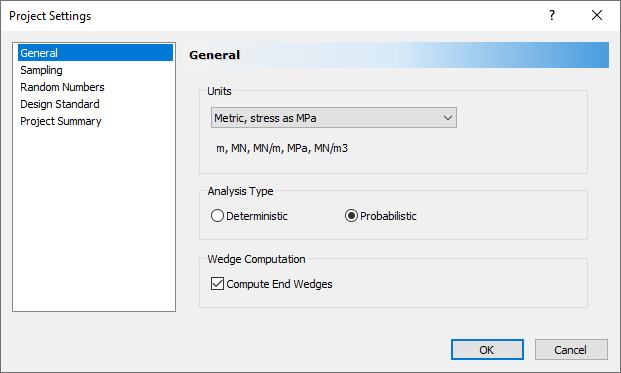
3.1 PROJECT SETTINGS
Before we start, we'll make sure Project Settings are the way we want them.
- Select Project Settings
 from the toolbar or the Analysis menu.
 - In the General tab, make sure Units = Metric, stress as MPa.
- Set Analysis Type = Probabilistic.
Project Settings Dialog General Tab - Select the Sampling tab.
- Set Number of Samples = 1000.
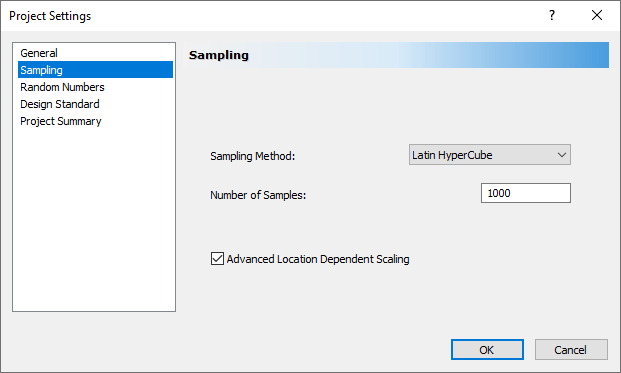
Project Settings Dialog Sampling Tab - Select OK.
3.2 IMPORT DXF FILE
For this tutorial, we will import the DXF file used in Tutorial 4, which contains the coordinates of the Opening Section boundary.
- Select File > Import > Import DXF

- Navigate to the Examples > Tutorials folder in your UnWedge installation folder and open the Tutorial 04 Tunnel Boundary.dxf file.
- In the Import DXF dialog, you're given the option of defining the Boundary Type.
- Leave the default selection of Opening Section.
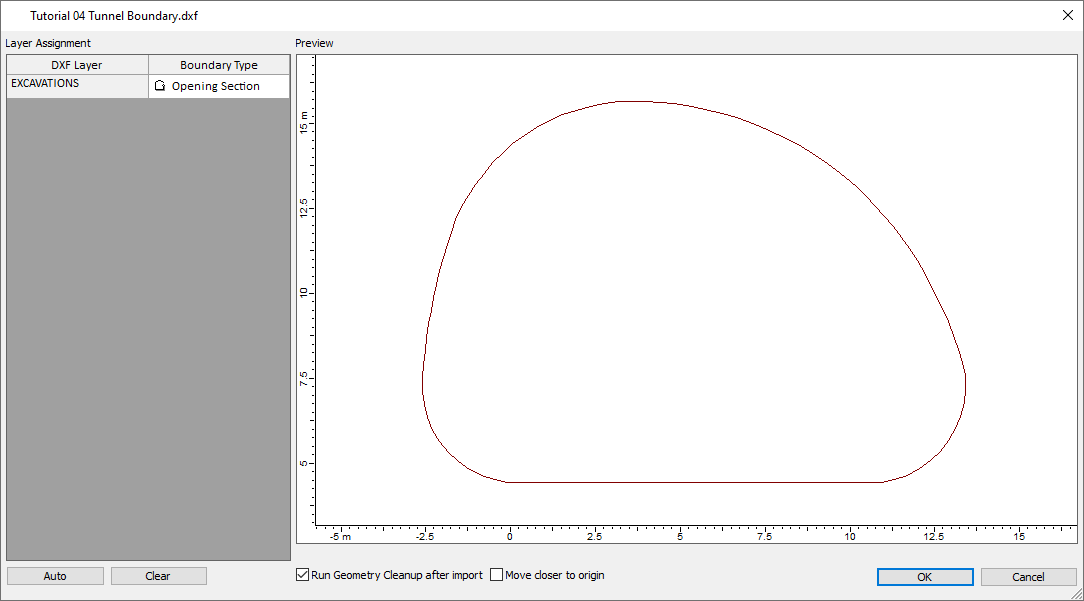
Tutorial 04 Tunnel Boundary Import Screen - Select OK.
The model should appear as follows: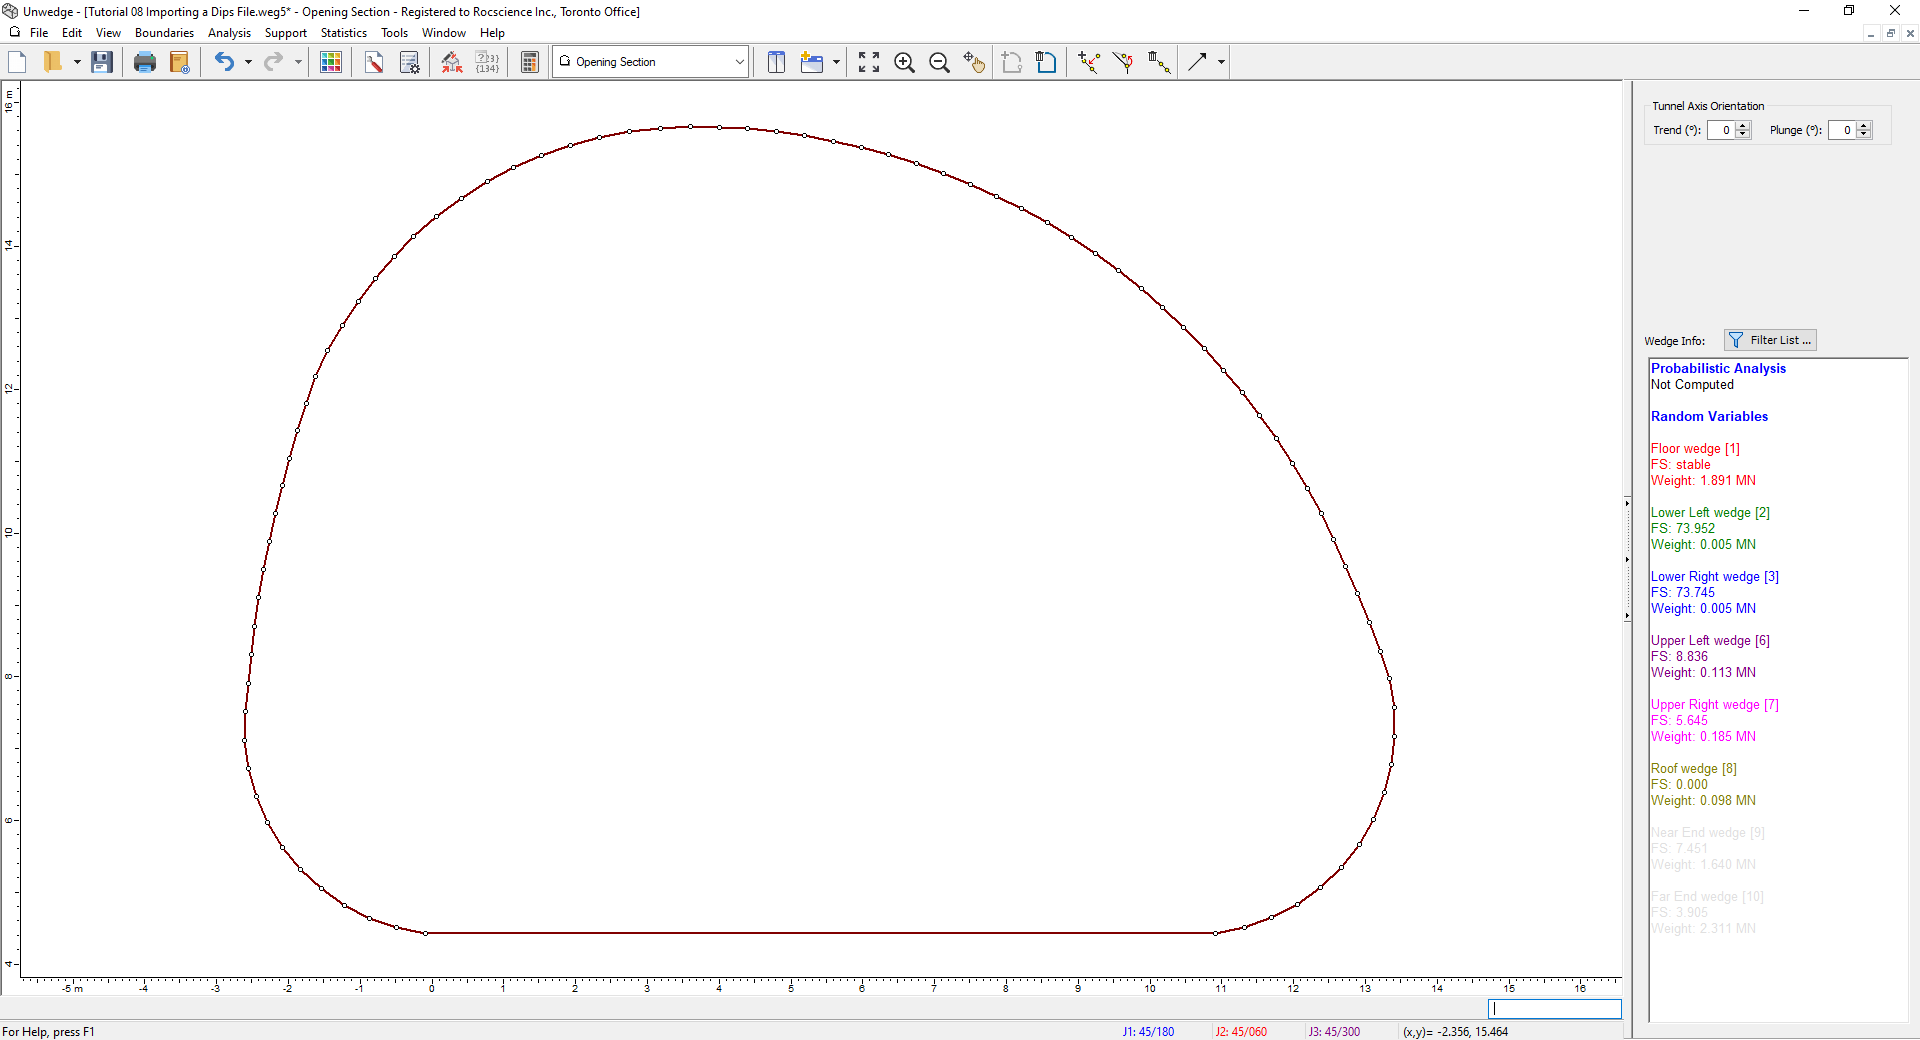
Opening Section Model View - Switch to the 3D Wedge View
 by selecting it in the View dropdown on the toolbar.
3.3 INPUT DATA
Now we'll input our analysis data using the Input Data dialog. This is where we'll import Joint Orientations data from DIPS.
- Select Input Data
 on the toolbar or the Analysis menu.
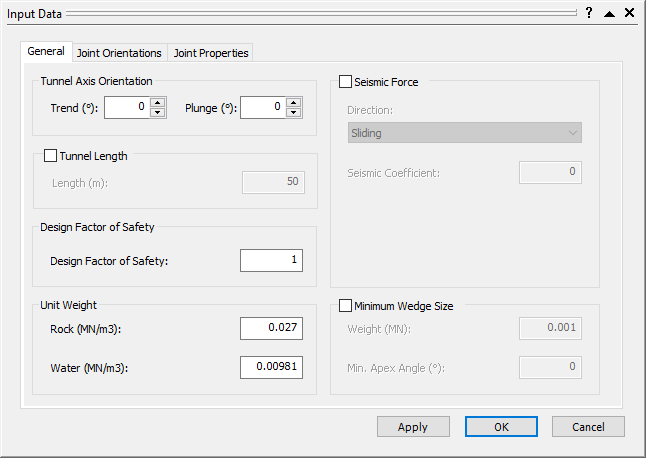
 - Leave the default values in the General tab as is.
Input Data Dialog - General Tab - Select the Joint Orientations tab and click the Import from DIPS
 button.
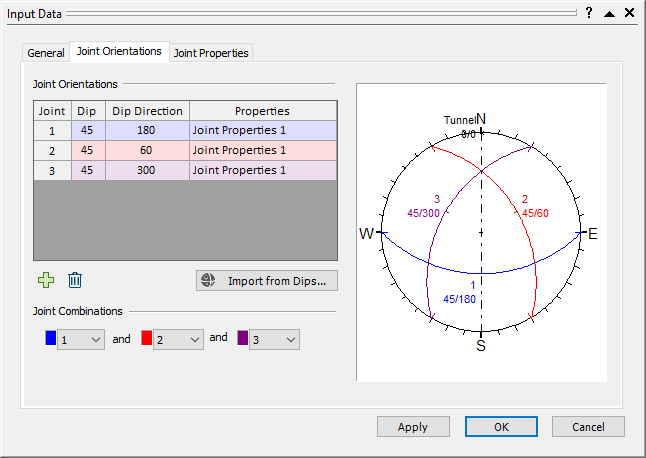
Input Data Dialog - Joint Orientations Tab - Navigate to the Examples > Tutorials folder in your UnWedge installation folder and open the Tutorial 8.dipsresults file.
The DIPS Data Import Options dialog appears. - Under Data to Import, ensure Sets is selected and Set Relevant Statistics is checked so that the sets and their statistics data from the .dipsresults file are imported.
- Under How to Add Data, ensure the Replace button is selected.
We want to overwrite the default Joint Orientation data. - Under Use Weight or Unweighted Values, leave UnWeighted selected.
The Terzaghi Weighting method is used to account for the sampling bias introduced by orientation data collection along Traverses. Although applicable, we will not use it for now.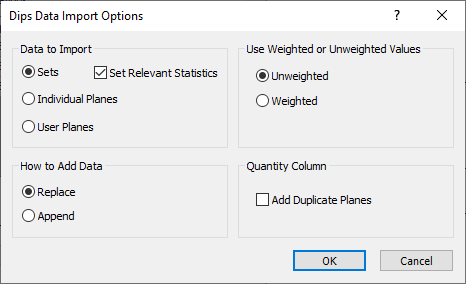
- Select OK to close the DIPS Data Import Options dialog.
The Joint Orientations tab should now look like this.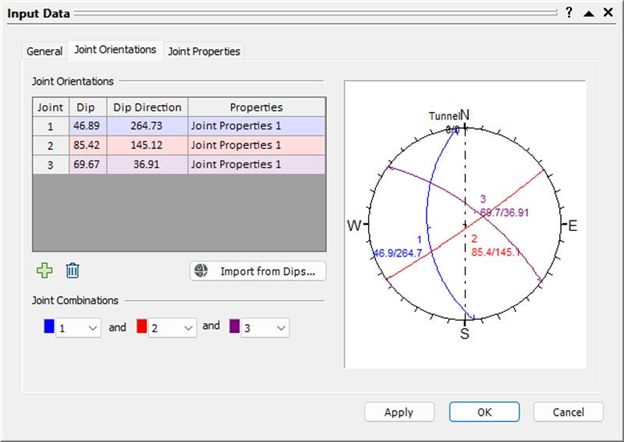
- Click on the Joint Properties tab.
- Under Shear Strength, change the Cohesion = 0.
- Under Joint Structure, change the Continuity from Infinite to Persistence. Keep the default Persistence = 5 m.
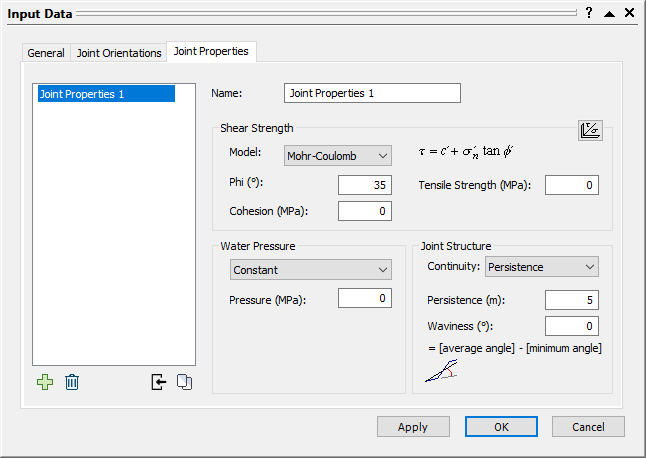
- Select OK.
3.4 PROBABILISTIC INPUT DATA
Now we'll enter the probabilistic Input Data using the Statistics options.
- Select Joint Orientations
 on the Statistics menu.
The Joint Orientations Statistics dialog appears.
- Under Joint 1 (Joint Properties 1), notice that the Dip, Dip Direction, distribution type (Option), and Fisher constant (Fisher K) are already defined.
This is because we imported the set statistics from DIPS when we checked off the Set Relevant Statistics checkbox. Note that the Fisher K defined in this dialog is the same as the Fisher K defined in the Report Generator of the DIPS file. - Notice that the other two joints also have Fisher Distributions and a Fisher K defined.
- Select Cancel.
Now we'll also apply a Distribution to the Persistence:
- Select Joint Properties
 on the Statistics menu.
The Joint Properties Statistics dialog appears. - Click the Add
 button.
 - Select Persistence from the Property dropdown and set Distribution to Exponential.
- Set Mean = 5, Rel. Min = 2, and Rel. Max = 10.
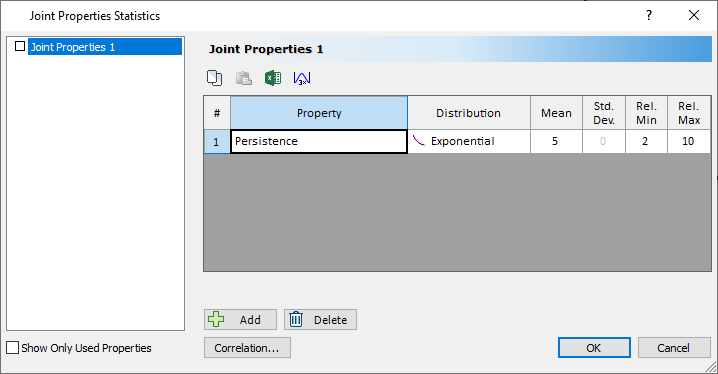
- Select OK.
4.0 Compute
We are now ready to compute.
- Select Compute
 on the toolbar or the Analysis menu.
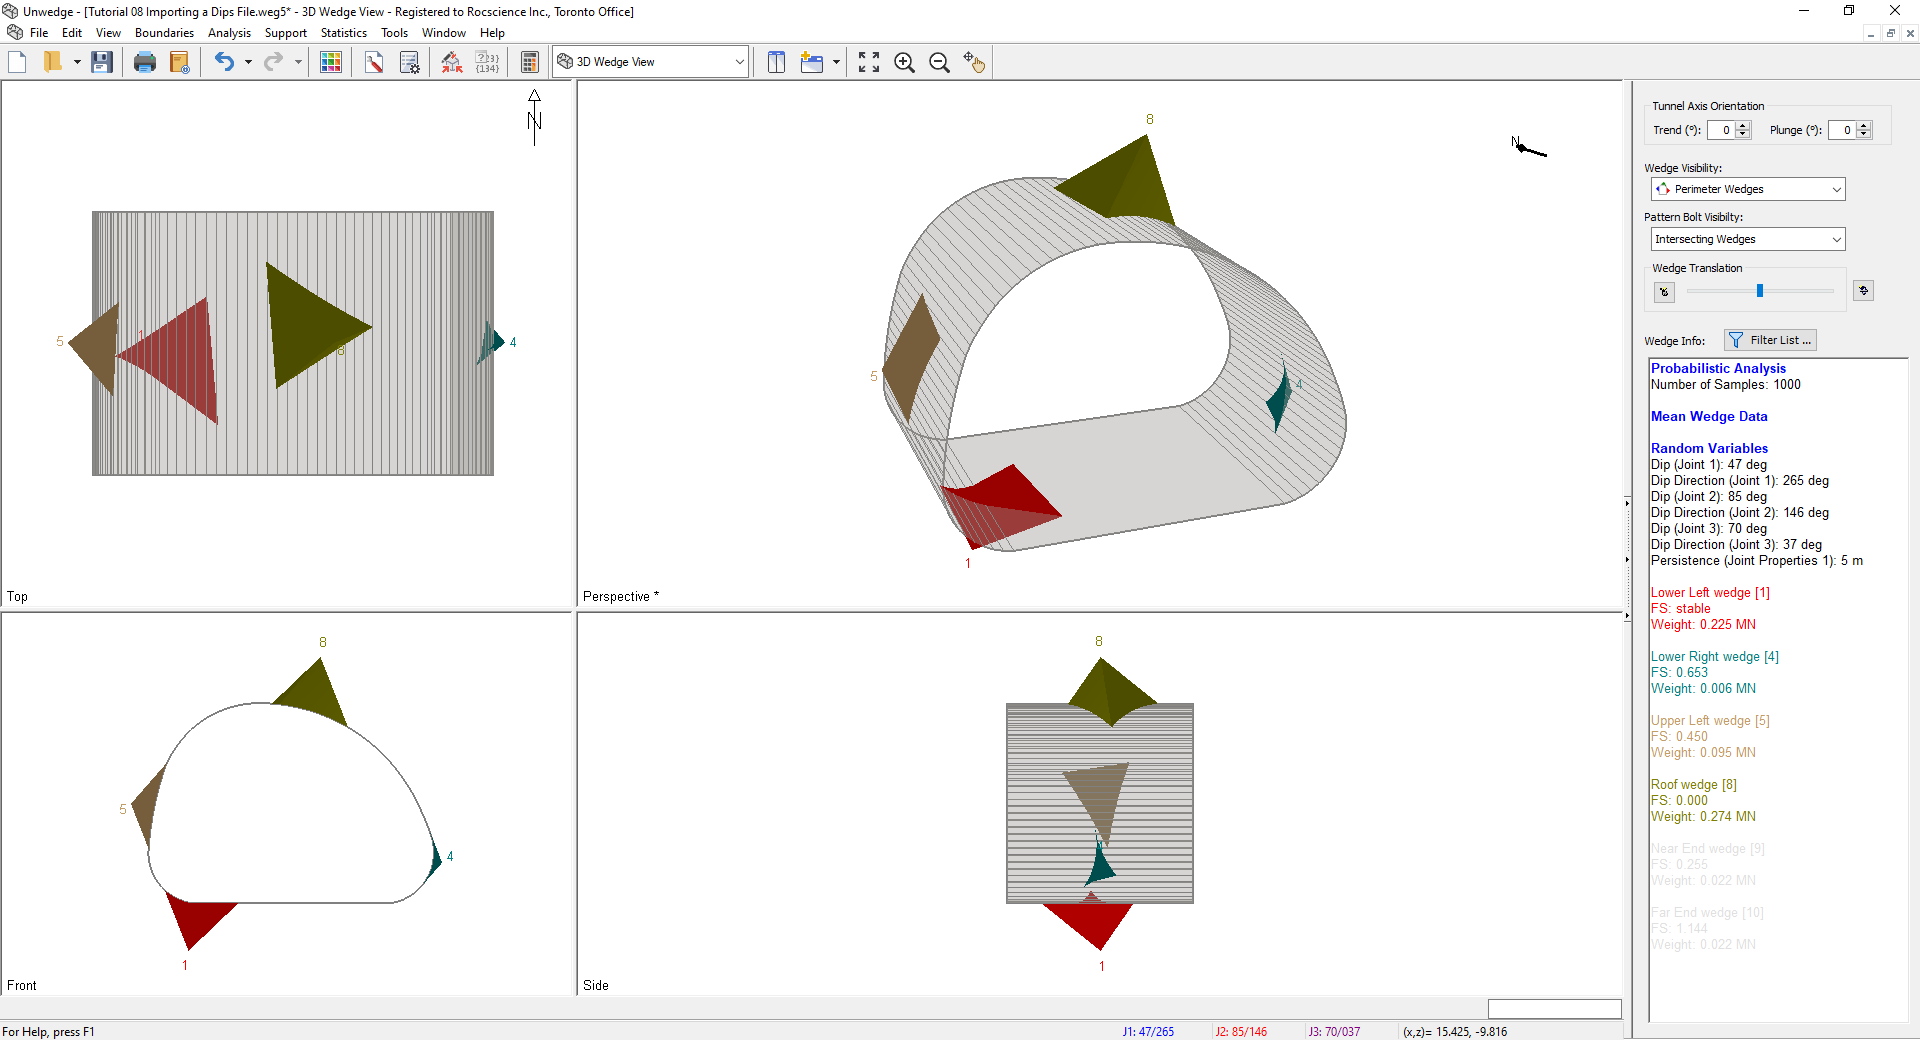
 - Switch to the 3D Wedge View .
You should see the following screen:
5.0 Analysis Results
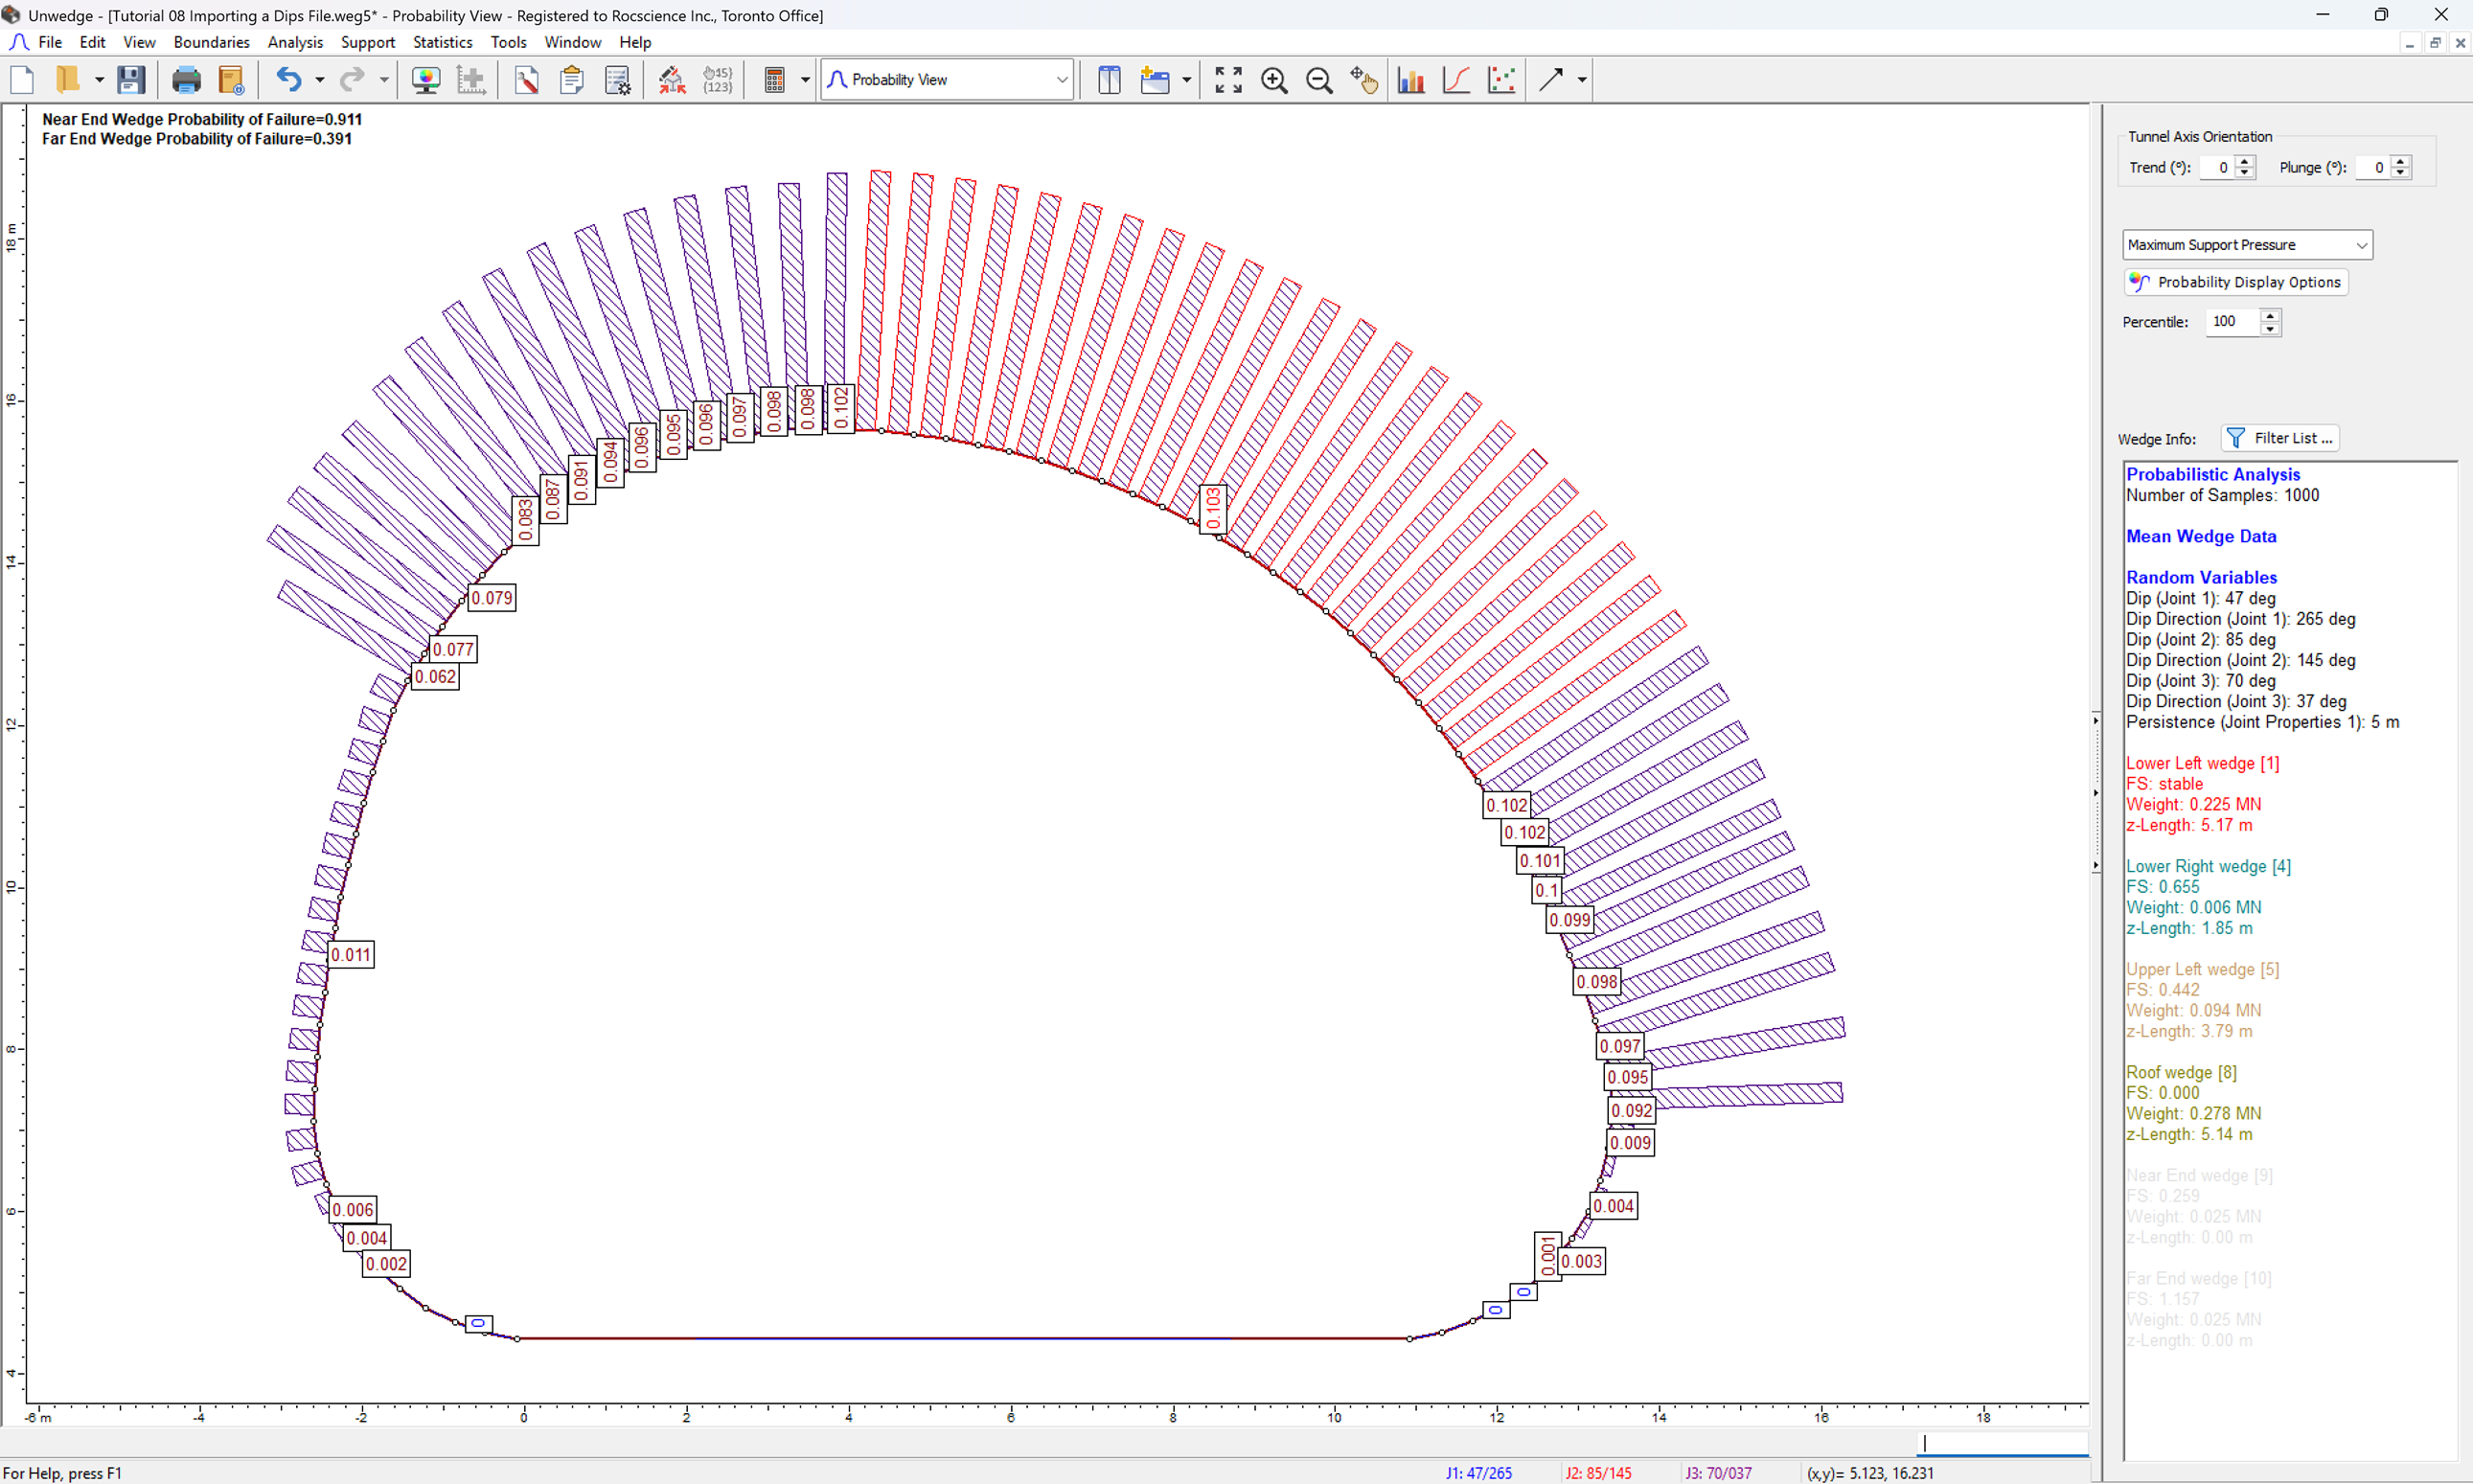
We can now view the results of the analysis by switching to Probability View:
- Select Probability View
 in the View dropdown on the toolbar or on the View > Select View menu.
 - From the Sidebar on the right, we can see that the values on the screen represent the Maximum Support Pressure.
5.1 HISTOGRAM - PERSISTENCE
- Select Plot Histogram
 on the toolbar or the Statistics menu.
 - Change the Data Type to Persistence (Joint Properties 1).
- Select the Plot Input Distribution checkbox.
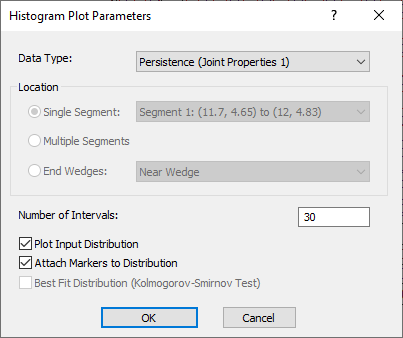
- Select OK.
You should see the following histogram:
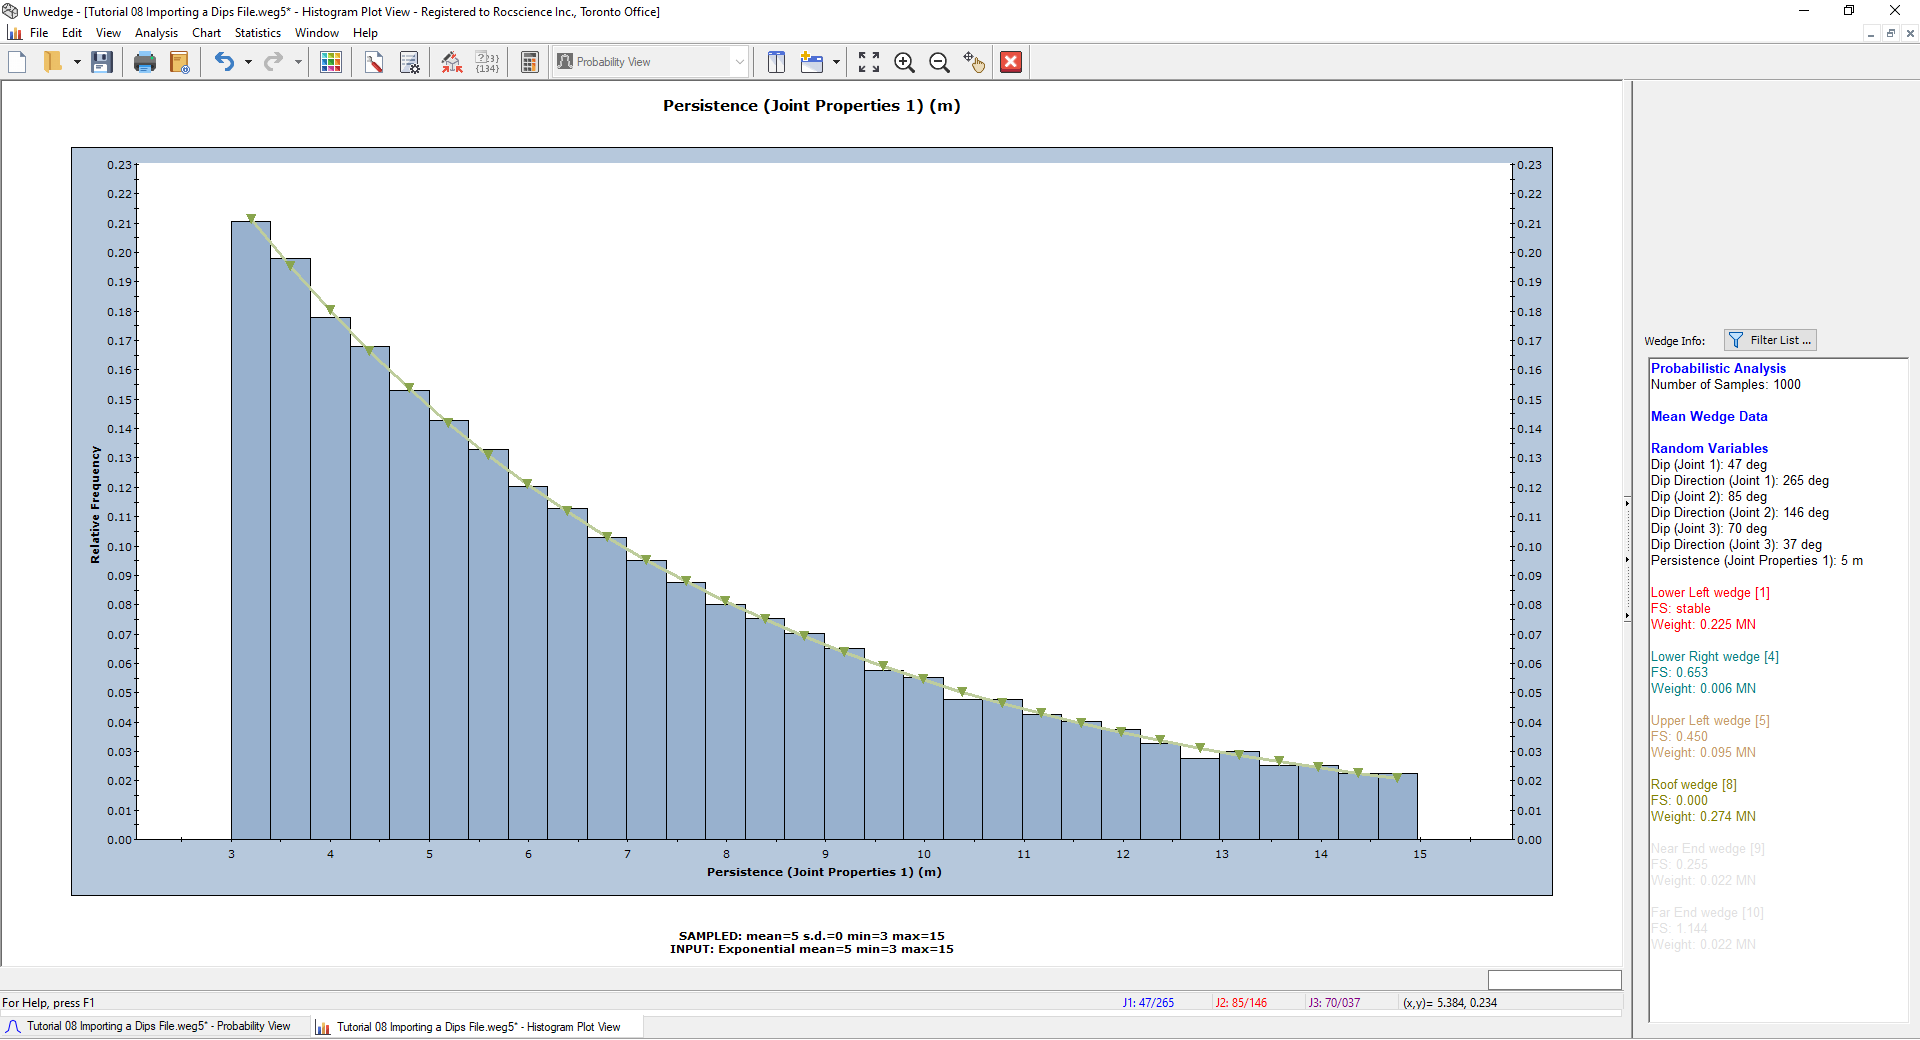
Notice that the Persistence values follow an exponential distribution and range from 3 to 15, as expected. We defined these values in the Joint Properties dialog.
- Select New Window
 on the toolbar or from the Window menu.
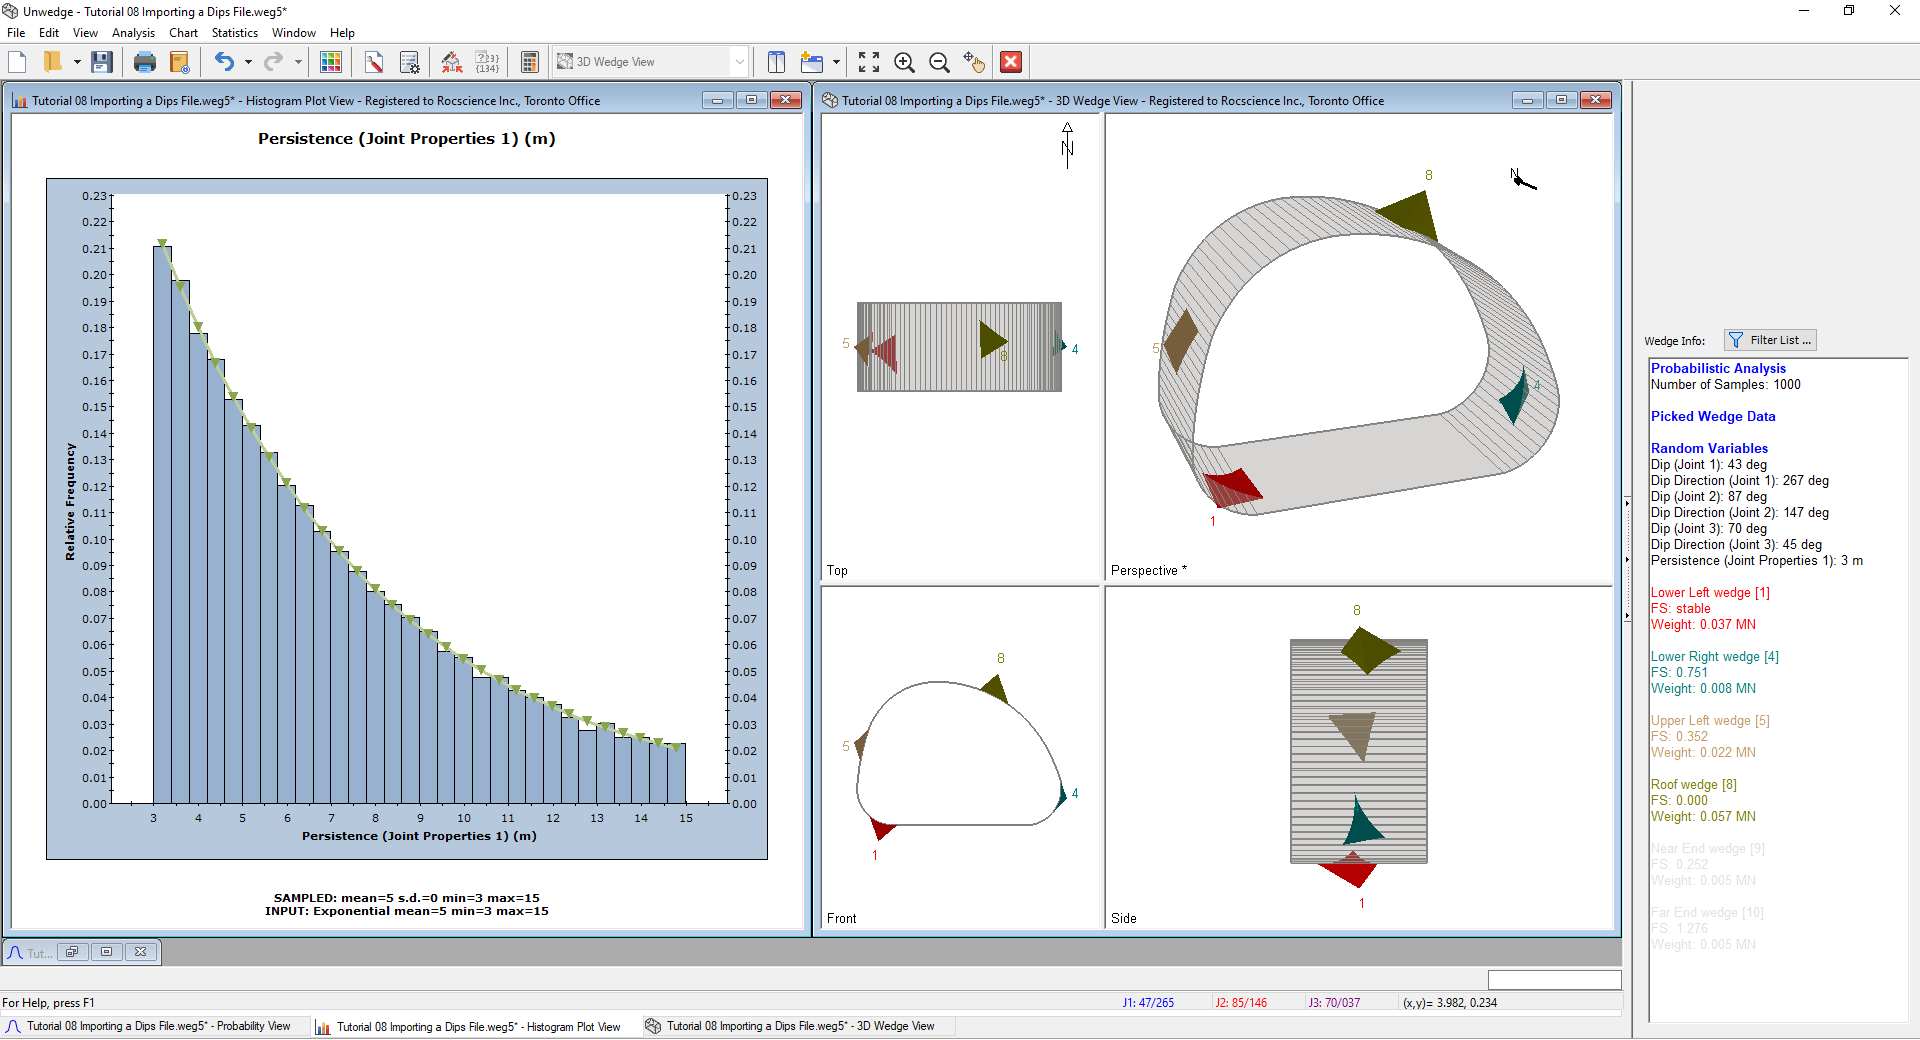
This opens a 3D Wedge View window and tiles all open views. - Minimize the Probability View window and select Tile Vertically
 on the toolbar or Window menu.
 - Double-click at points along the Histogram and see the change in the 3D Wedge View.
As expected, larger joint persistence values tend to result in larger wedges. For example, for a minimum persistence of about 3, your screen might look something like this:
5.2 SCATTER PLOT - DIP VS. DIP DIRECTION
- Close the 3D Wedge View and the persistence histogram by selecting the
 in the upper right corner of each view.
 - Maximize the Probability View.
- To return to the Mean Wedge view, select View > Show Mean Wedges.
- Select Plot Scatter
 from the toolbar or the Statistics menu.
 - Set X Axis Dataset = Dip (Joint 1) and Y Axis Dataset = Dip Direction (Joint 1).
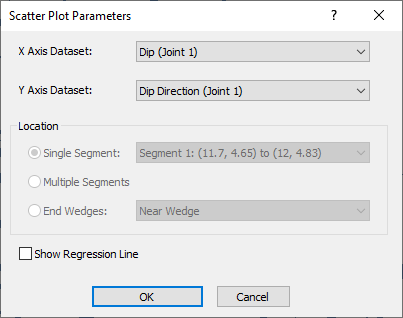
- Select OK.
You should see the following plot:
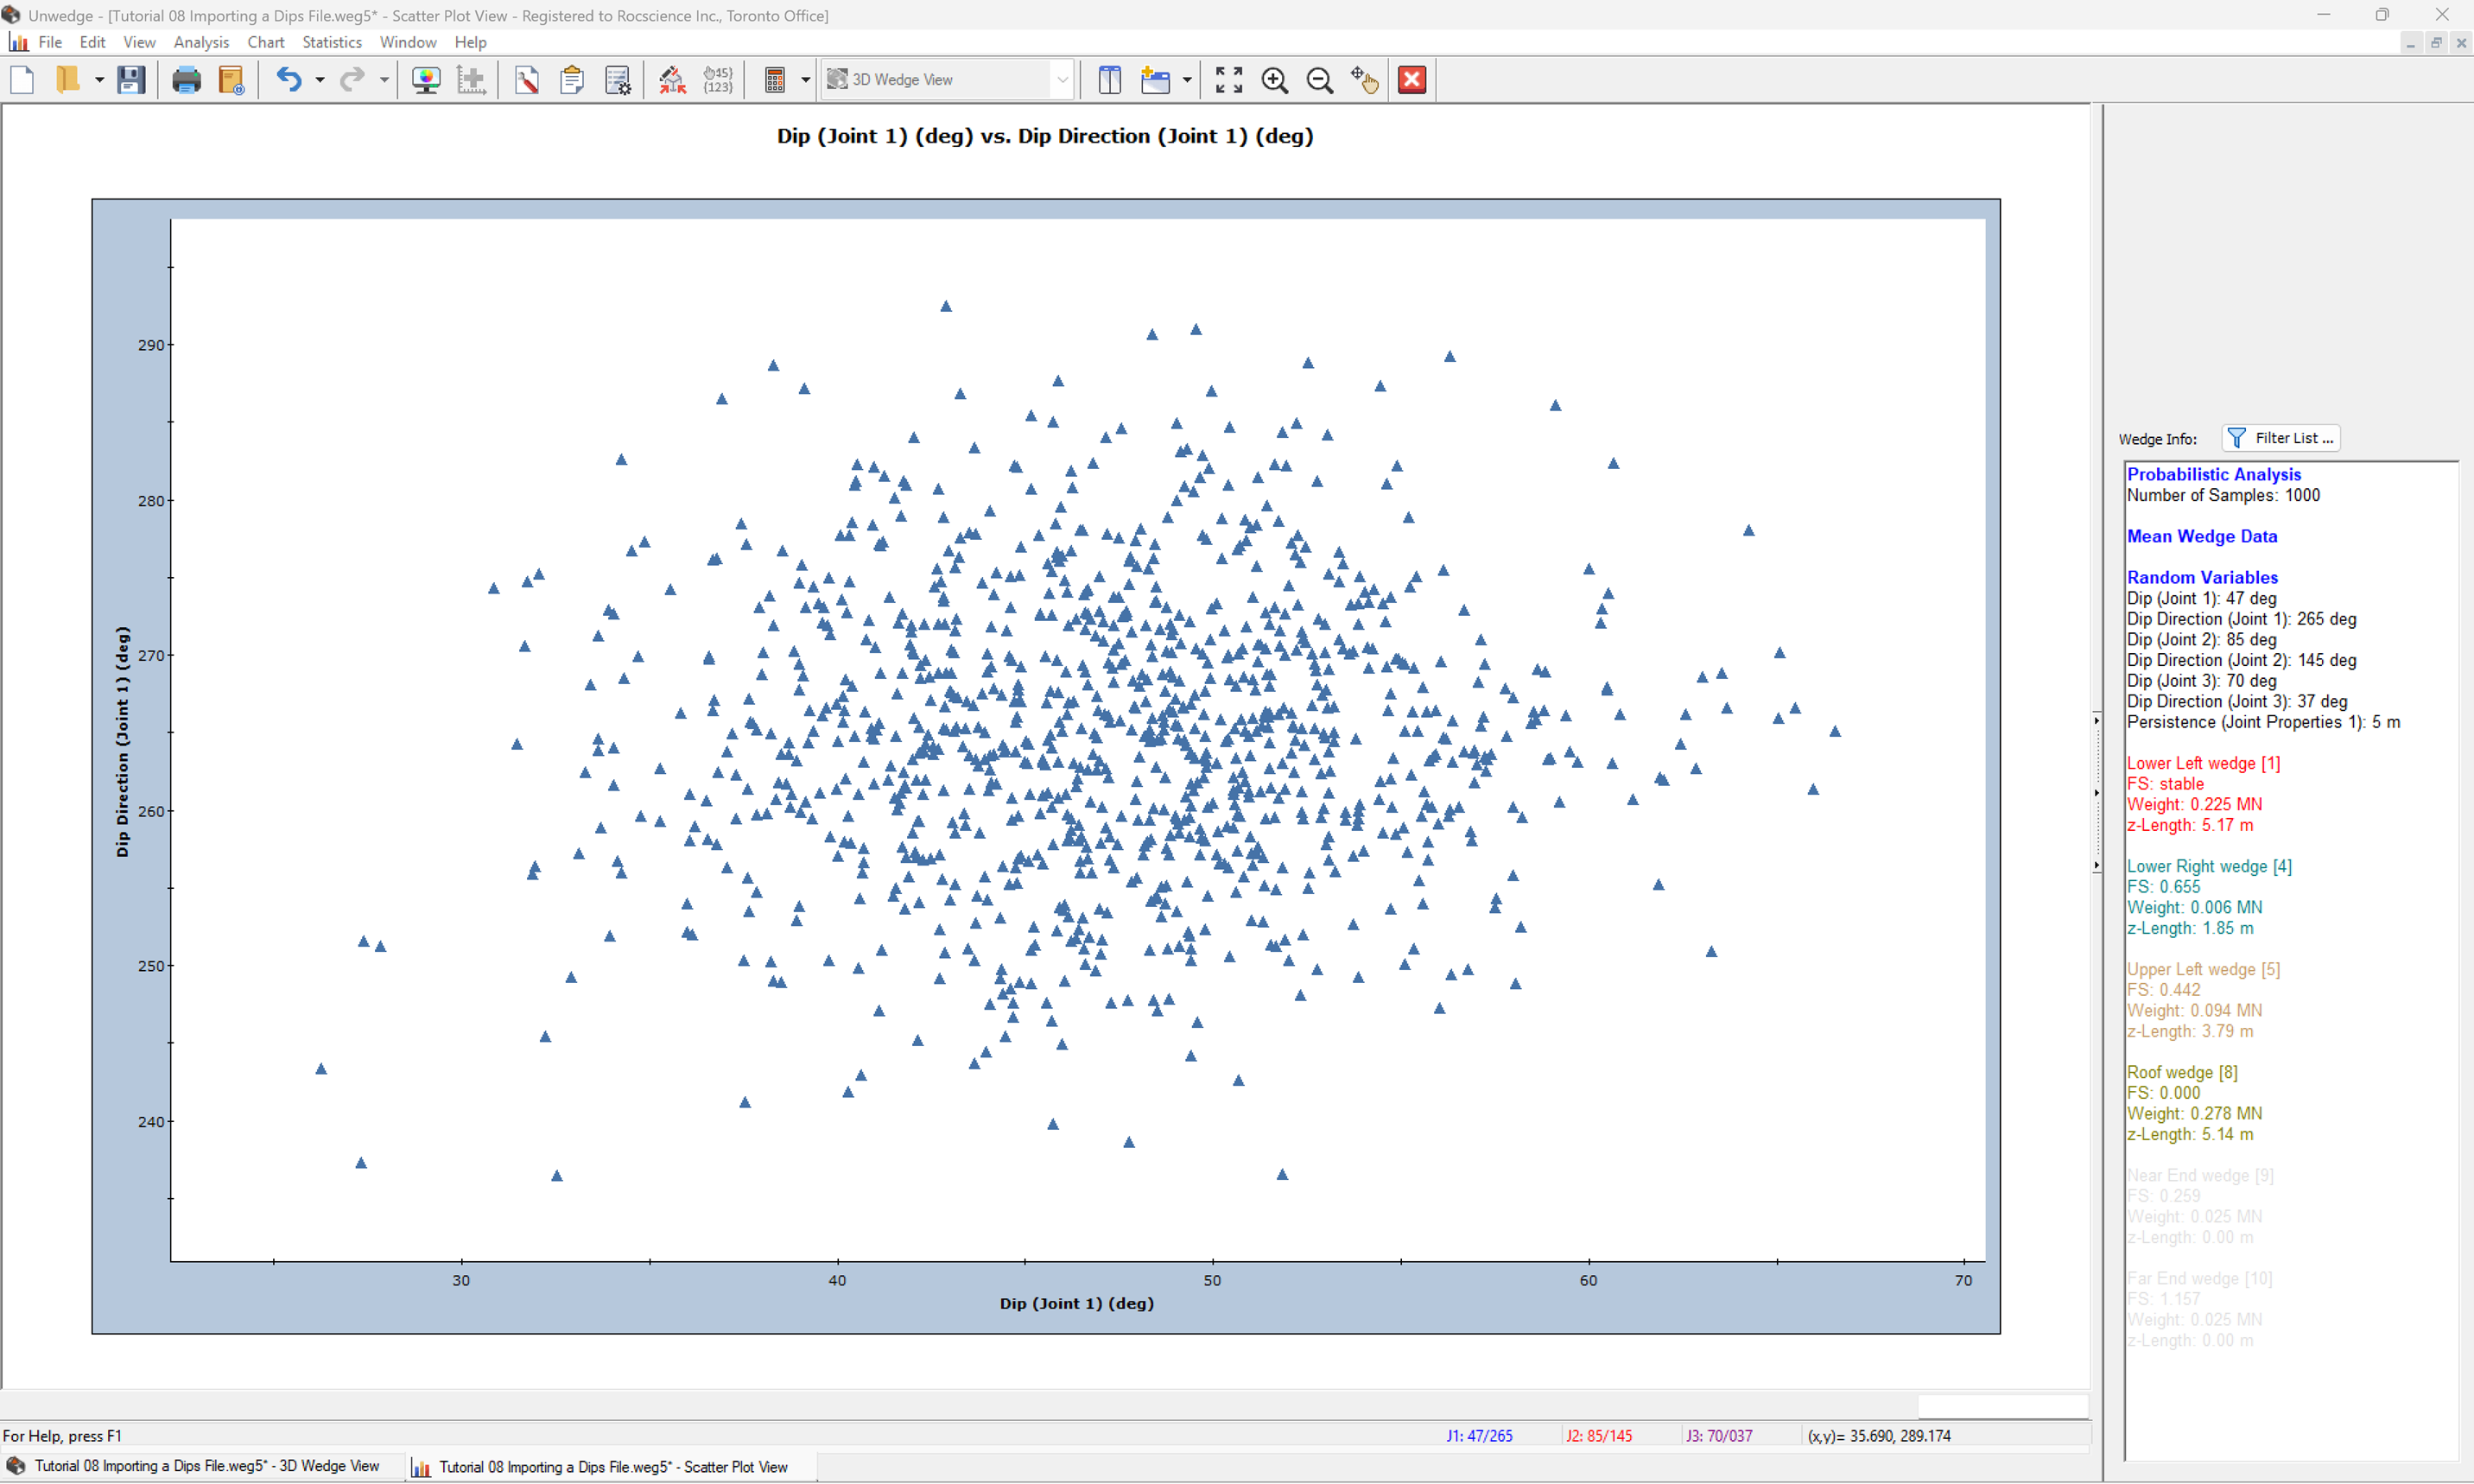
Notice that the data is concentrated in a relatively circular area in the middle of the plot, and becomes more scattered on the outskirts.
This concludes the tutorial. You are now ready for the next tutorial, Tutorial 09 - Probabilistic Support in UnWedge.