11 - Advanced Joint Combinations Analysis
1.0 Introduction
This tutorial will perform a Probabilistic Analysis on a geometry with four joints. We will first look at the individual combinations. We will then proceed to compute all of the joint combinations at once.
Topics Covered in this Tutorial:
- Probabilistic Joint Combination Analysis
- Analysis of Individual Joint Combinations
- Analysis of All Joint Combinations
Finished Product:
The finished tutorial can be found in the Tutorial 11 Advanced Joint Combination.weg5 file located in the Examples > Tutorials folder in your UnWedge installation folder.
2.0 Model
- If you have not already done so, run the UnWedge program by double-clicking on the UnWedge icon in your installation folder. Or from the Start Menu, select Programs > Rocscience > UnWedge. If the UnWedge application window is not already maximized, maximize it now so that the full screen is available for viewing the model.
- Read in the file Tutorial 01 Quick Start.weg5, which you should find in the Examples > Tutorials folder in your UnWedge installation folder and open.
2.1 PROJECT SETTINGS
- Select Project Settings
 from the toolbar or the Analysis menu.
 - Ensure Units = Metric, stress as MPa.
- Change Analysis Type = Probabilistic.
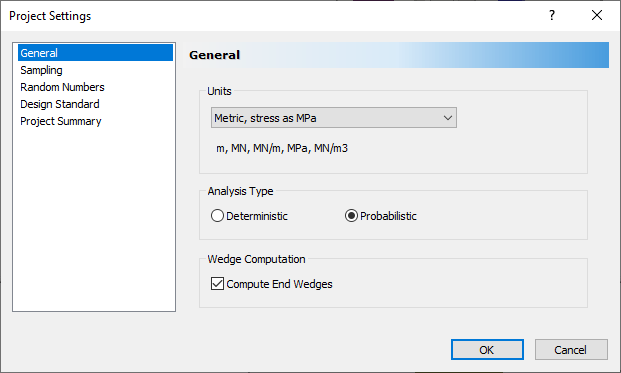
- Navigate to the Sampling tab on the left of the dialog.
- Change the Number of Samples = 1000.
- Ensure the Advanced Location Dependent Scaling box is checked.

- Select OK.
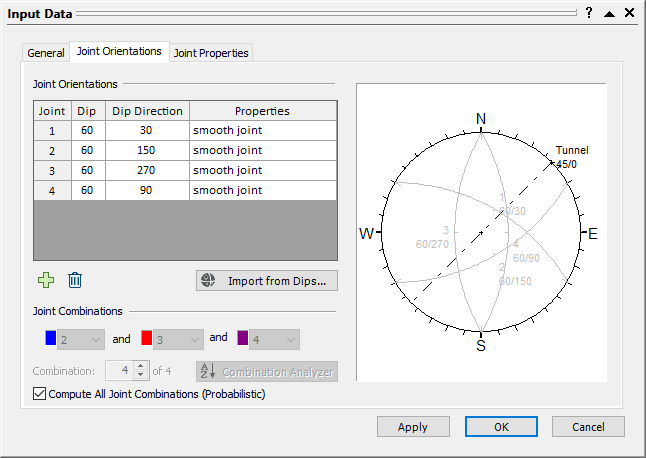
2.2 INPUT DATA
- Select Input Data
 from the toolbar or the Analysis menu.
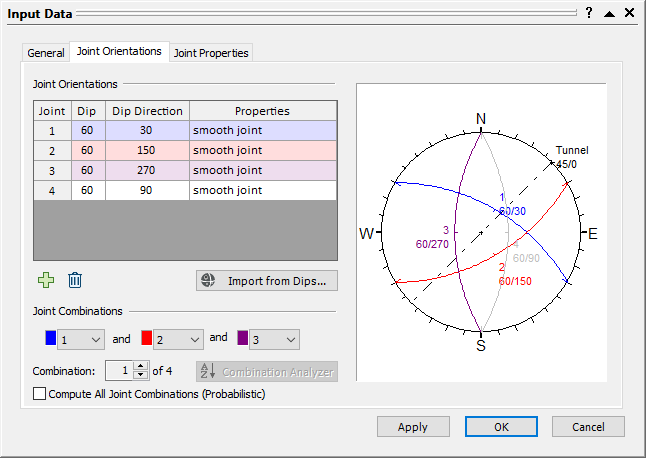
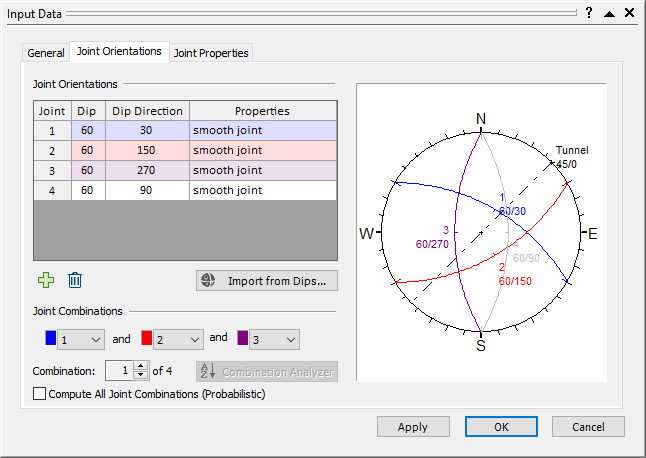
 - Navigate to the Joint Orientations tab.
- Select the Add
 button to add a new joint.
 - Change Joint 4 Dip = 60 and Dip Direction = 90.
- Change all four joint Properties = smooth joint as shown.
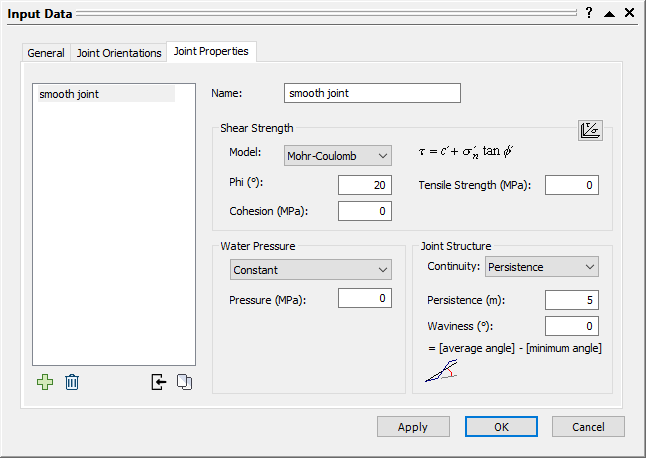
- Navigate to the Joint Properties tab.
- Select the rough joint tab on the left of the dialog.
- Select the Delete
 button to delete the rough joint.
Only the smooth joint should be displayed on the left of the dialog. - Change the Joint Structure Continuity from Infinite to Persistence. Keep the default Persistence = 5 m.
- Select OK.
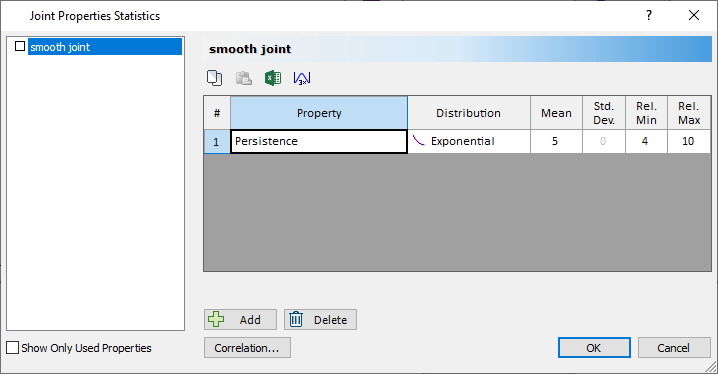
2.3 JOINT PROPERTIES
- Select Statistics > Joint Properties
 to open the Joint Properties Statistics dialog.
 - Select Add .
- Enter the following:
- Property = Persistence
- Distribution = Exponential
- Mean = 5
- Rel. Min = 4
- Rel. Max = 10
3.0 Combination 1: Joints 1,2,3
- Select Input Data from the toolbar or the Analysis menu.
- Navigate to the Joint Orientations tab.
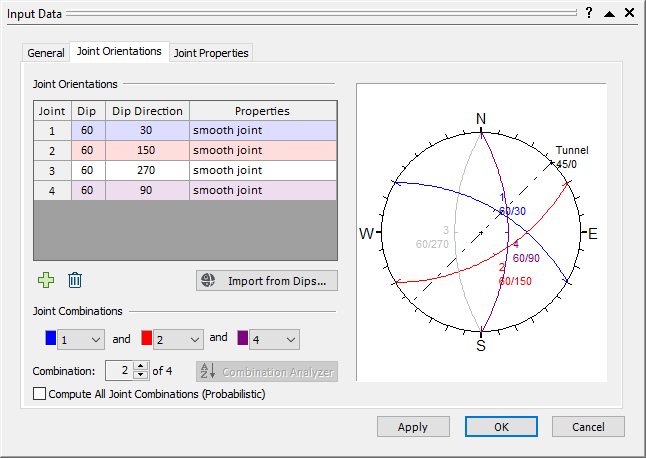
- Note under Joint Combination that we are looking at Combination 1 of 4. Combination 1 uses Joints 1, 2, and 3.

- Select Cancel.
We are now ready to compute.
- Select Compute
 on the toolbar or the Analysis menu.
 - Switch to the Probability View
 .
.
You should see the following:
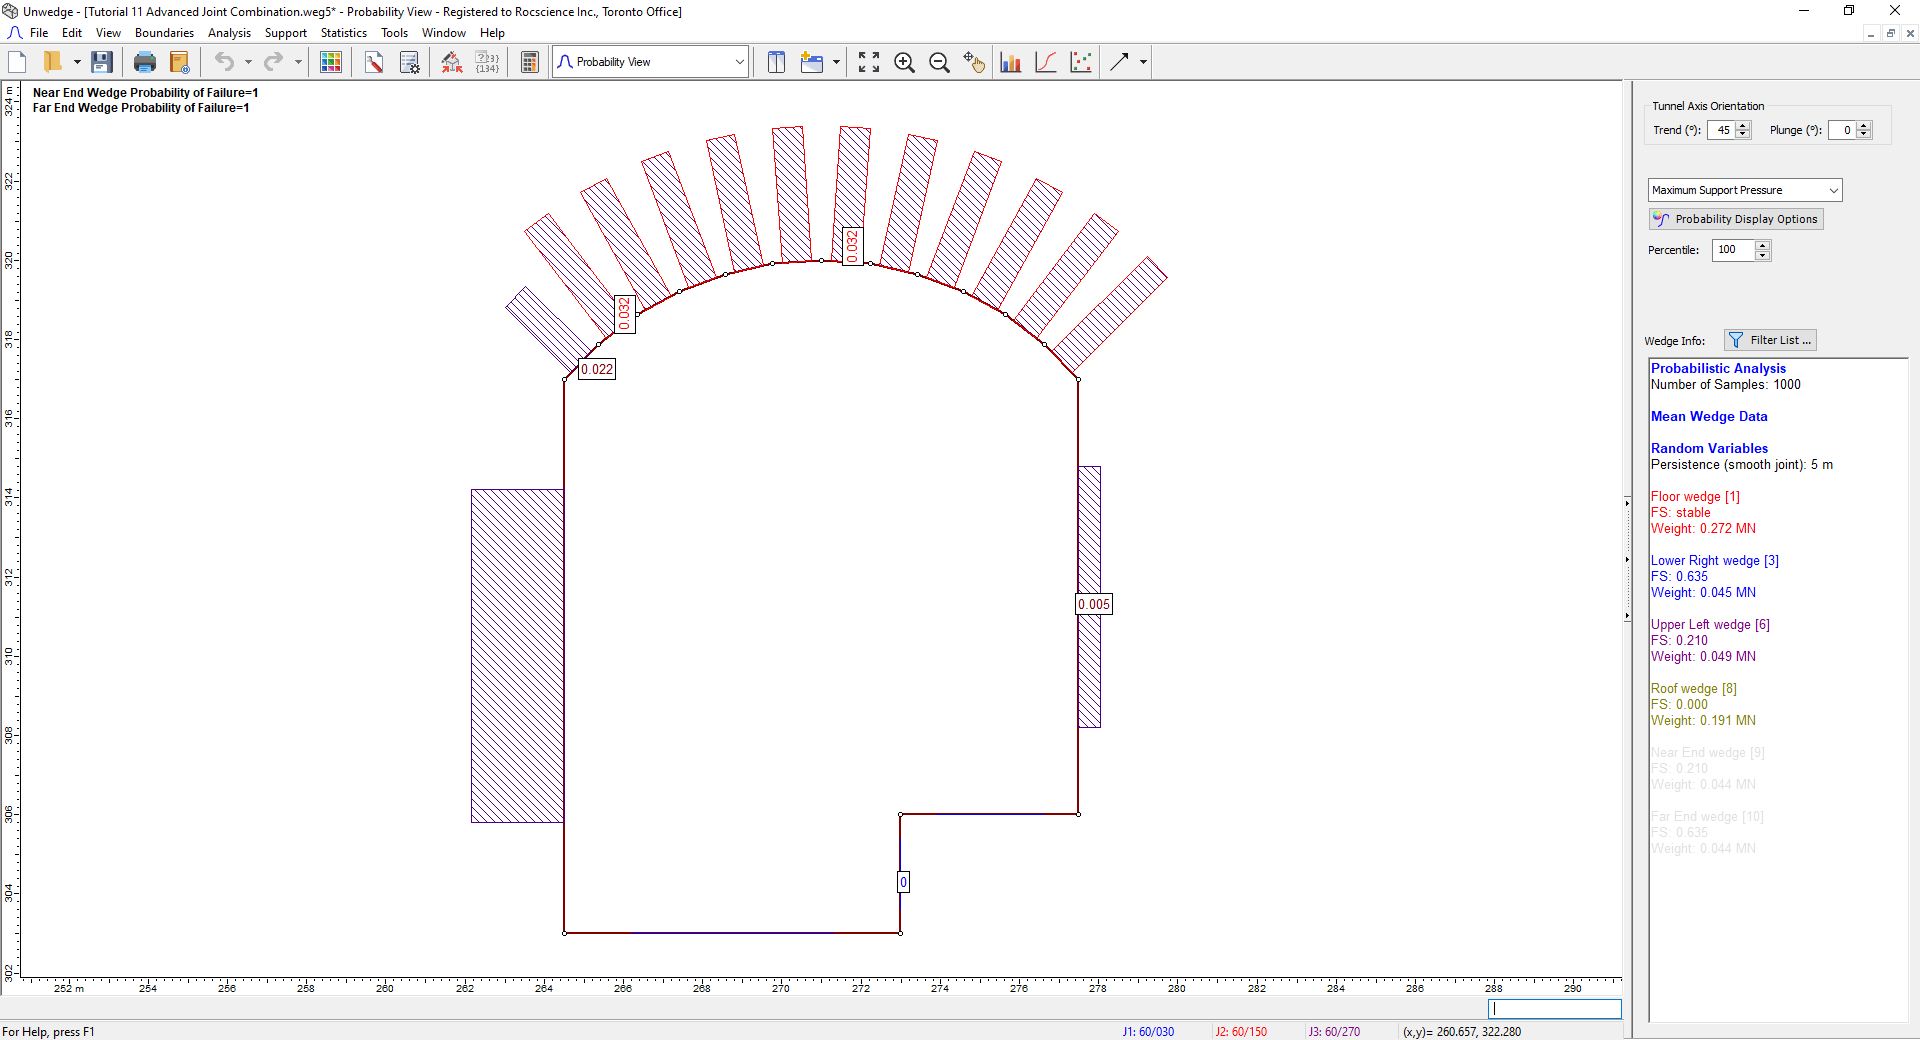
From the Sidebar, we can see that we are currently looking at the Maximum Support Pressure. Most of the roof segments have a Maximum Support Pressure of 0.032 MPa.
- Select New Window
 on the toolbar or the Window menu.
The Probability View should now be vertically tiled with the 3D Wedge View. - Click on one of the 0.032 roof segments in the Probability View to see the resulting 3D Wedge View.
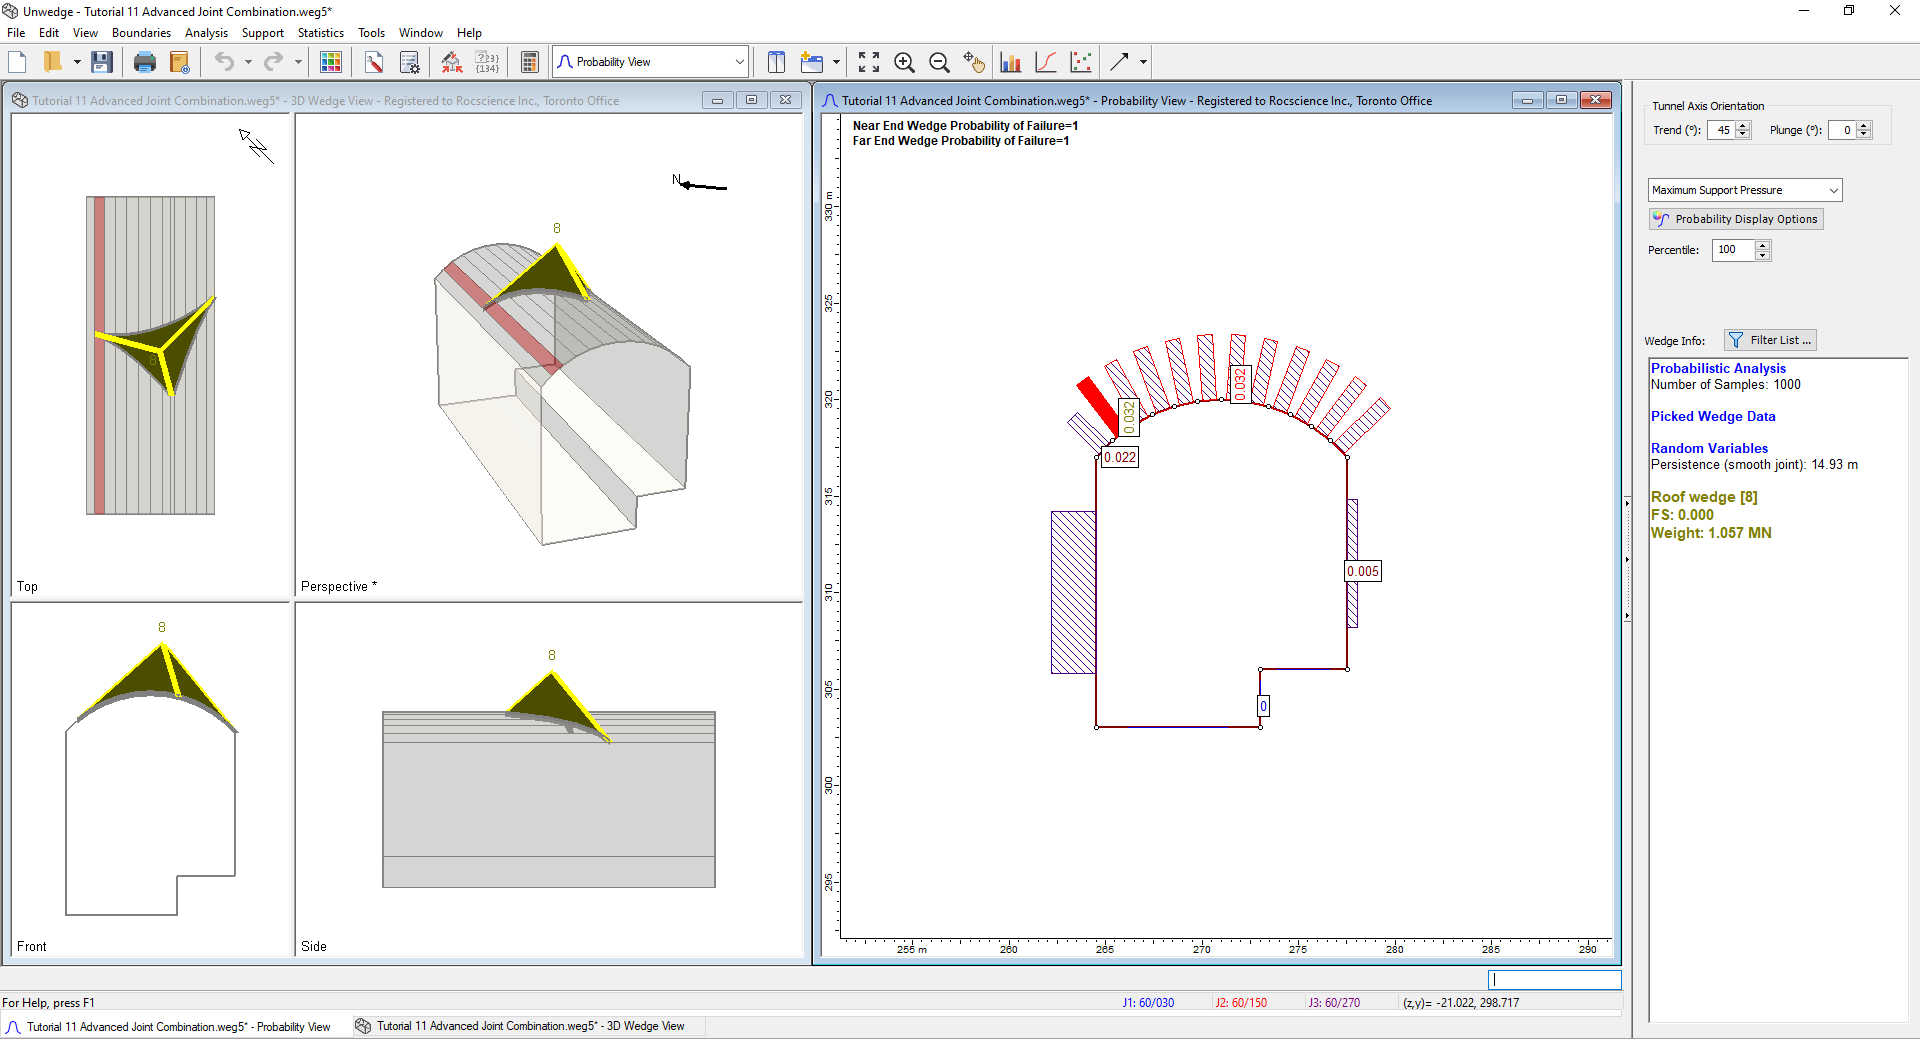
3D Wedge Movel View - Close the 3D Wedge View and maximize the Probability View.
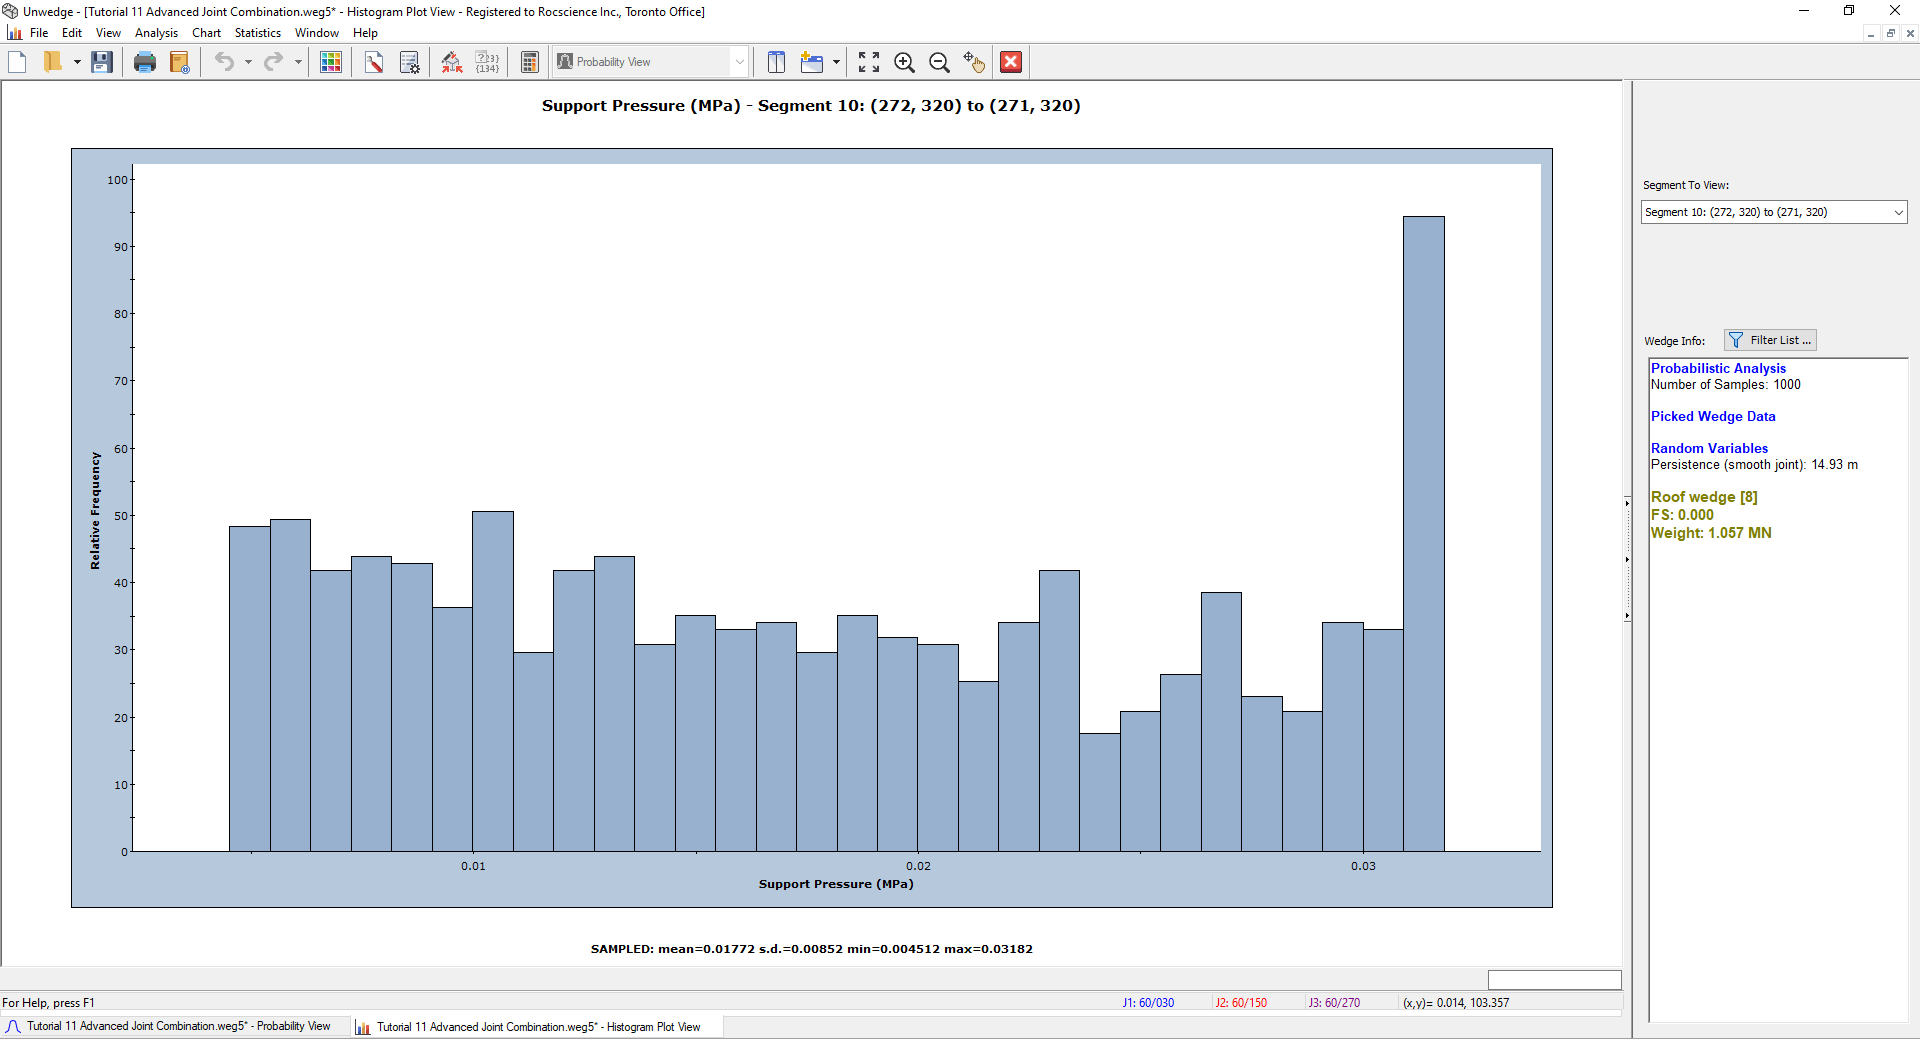
- Right-click on one of the 0.032 roof segments (e.g., Segment 10) and select Plot Histogram
 .
.
- Select OK.
You should see the following Histogram:
Now that we have studied the results of the first joint combination, we will go on to look at the second.
- Close the Histogram view.
4.0 Combination 2: Joints 1,2,4
- Select Input Data from the toolbar or the Analysis menu.
- Navigate to the Joint Orientations tab.
On the bottom of the dialog, we can see that we are looking at Combination 1 of 4 total combinations. - Click on the up arrow to go to Combination 2.
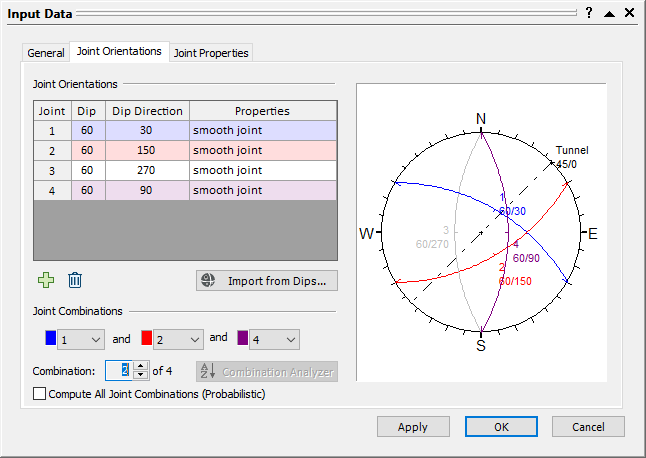
This combination takes joints 1, 2, and 4 into account. - Select OK.
- Select Compute on the toolbar or the Analysis menu.
- Switch to the Probability View .
Probability Model View
The Maximum Support Pressure on the roof now varies between 0.057 MPa and 0.086 MPa. - Select New Window on the toolbar.
The Probability View should now be vertically tiled with the 3D Wedge View, as shown.
- Close the 3D Wedge View and maximize the Probability View.
- Right-click on one of the roof segments (e.g., Segment 12) and select Plot Histogram in the popup menu.

- Select OK in the dialog.
You should see the following Histogram:
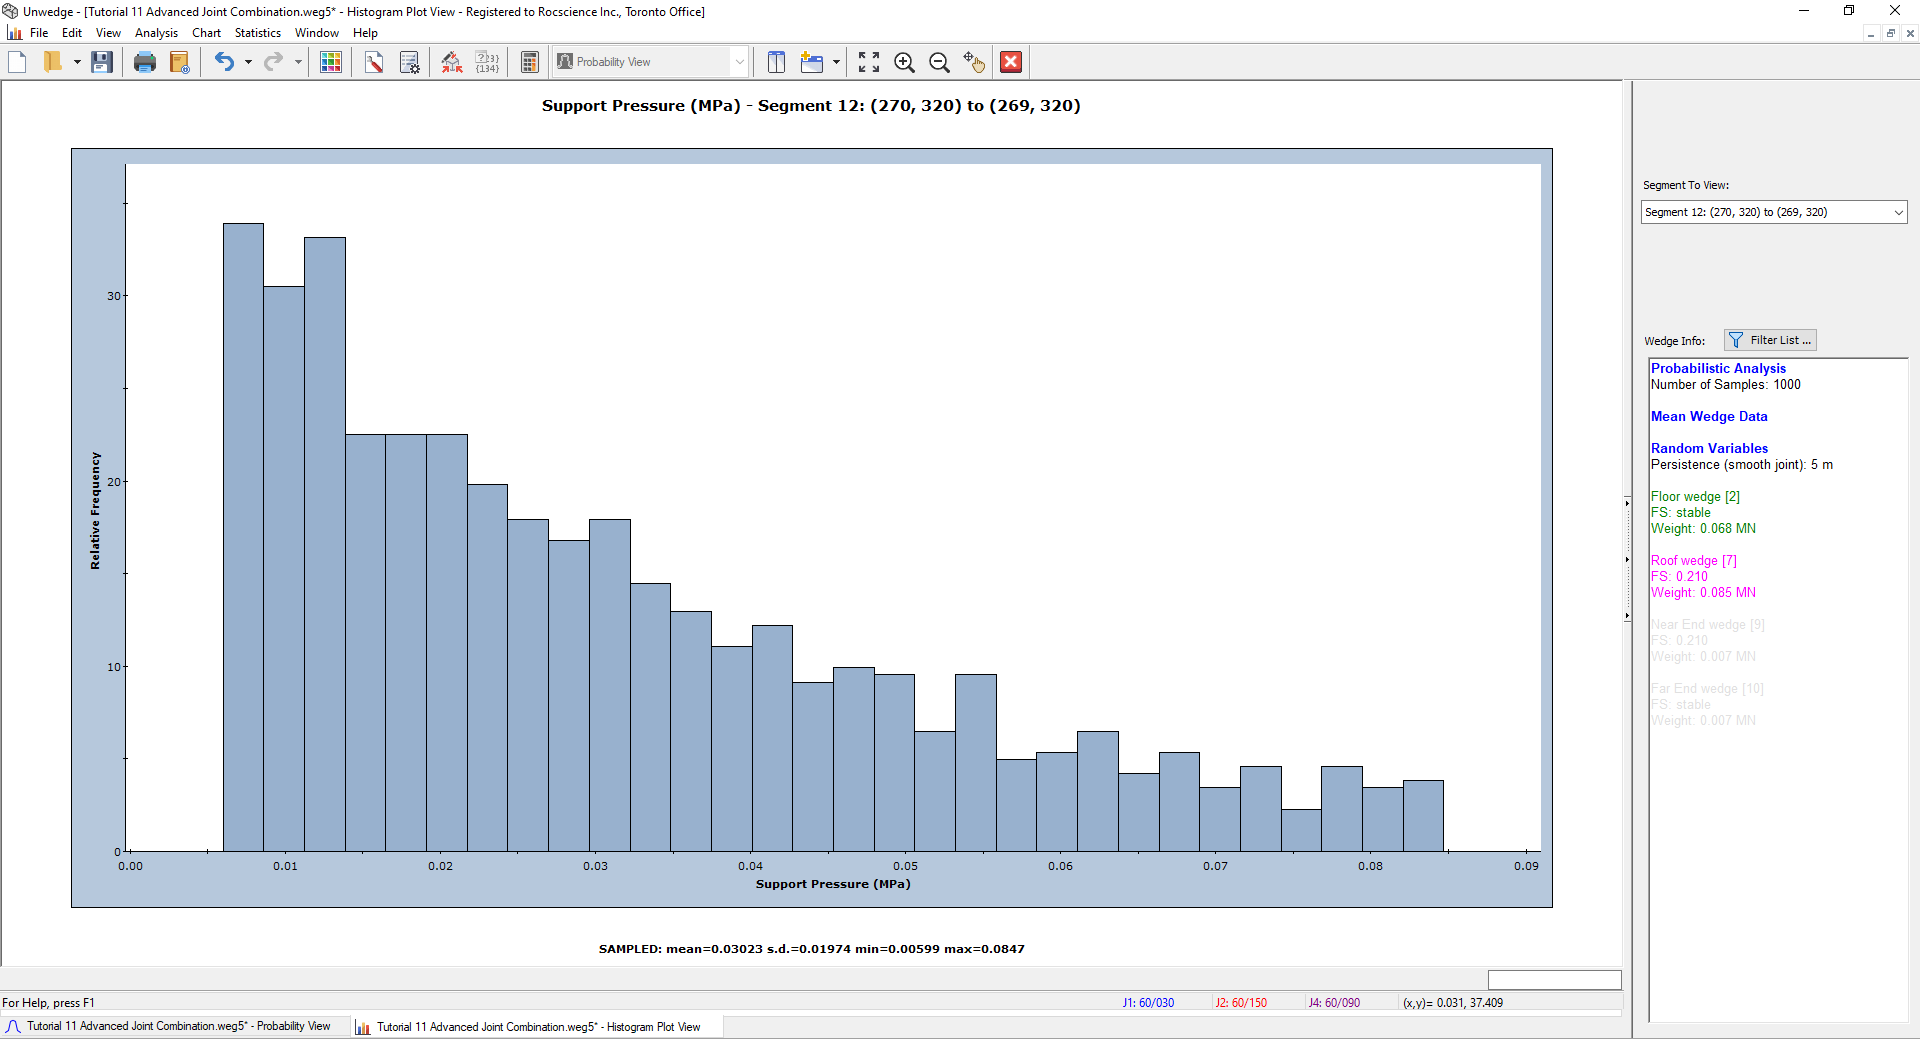
Note that in this combination, unlike the previous one, the Support Pressure follows a generally exponential distribution without any extreme anomalies. This is because, in this combination, the maximum persistence is never met so UnWedge does not have to scale down a large number of wedges.
We will now go on to look at the third joint combination.
- Close the Histogram view.
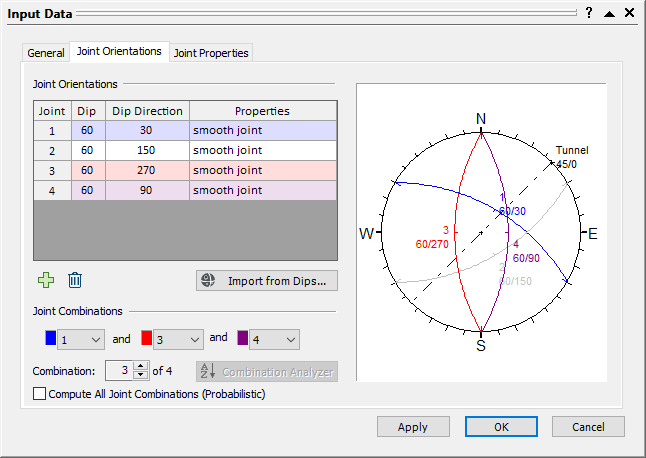
5.0 Combination 3: Joints 1,3,4
- Select Input Data from the toolbar or the Analysis menu.
- Navigate to the Joint Orientations tab.
Under Joint Combinations, we can see that we are looking at Combination 2 of 4 total combinations. - Click on the up arrow to go to Combination 3. This combination takes Joints 1, 3, and 4 into account.
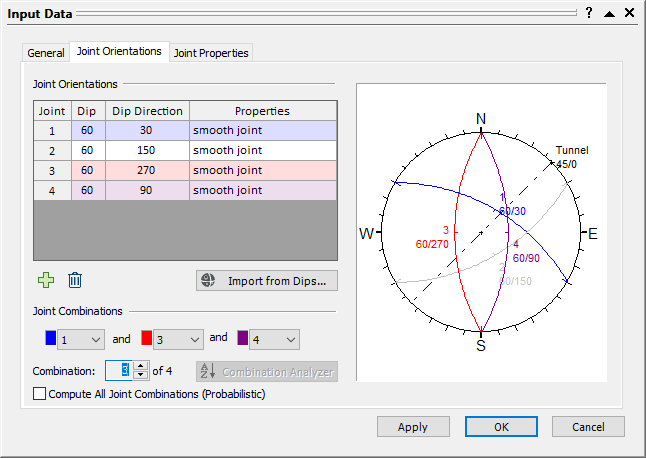
- Select OK.
- Select Compute on the toolbar or the Analysis menu.
- Switch to the Probability View .
Probability Model View
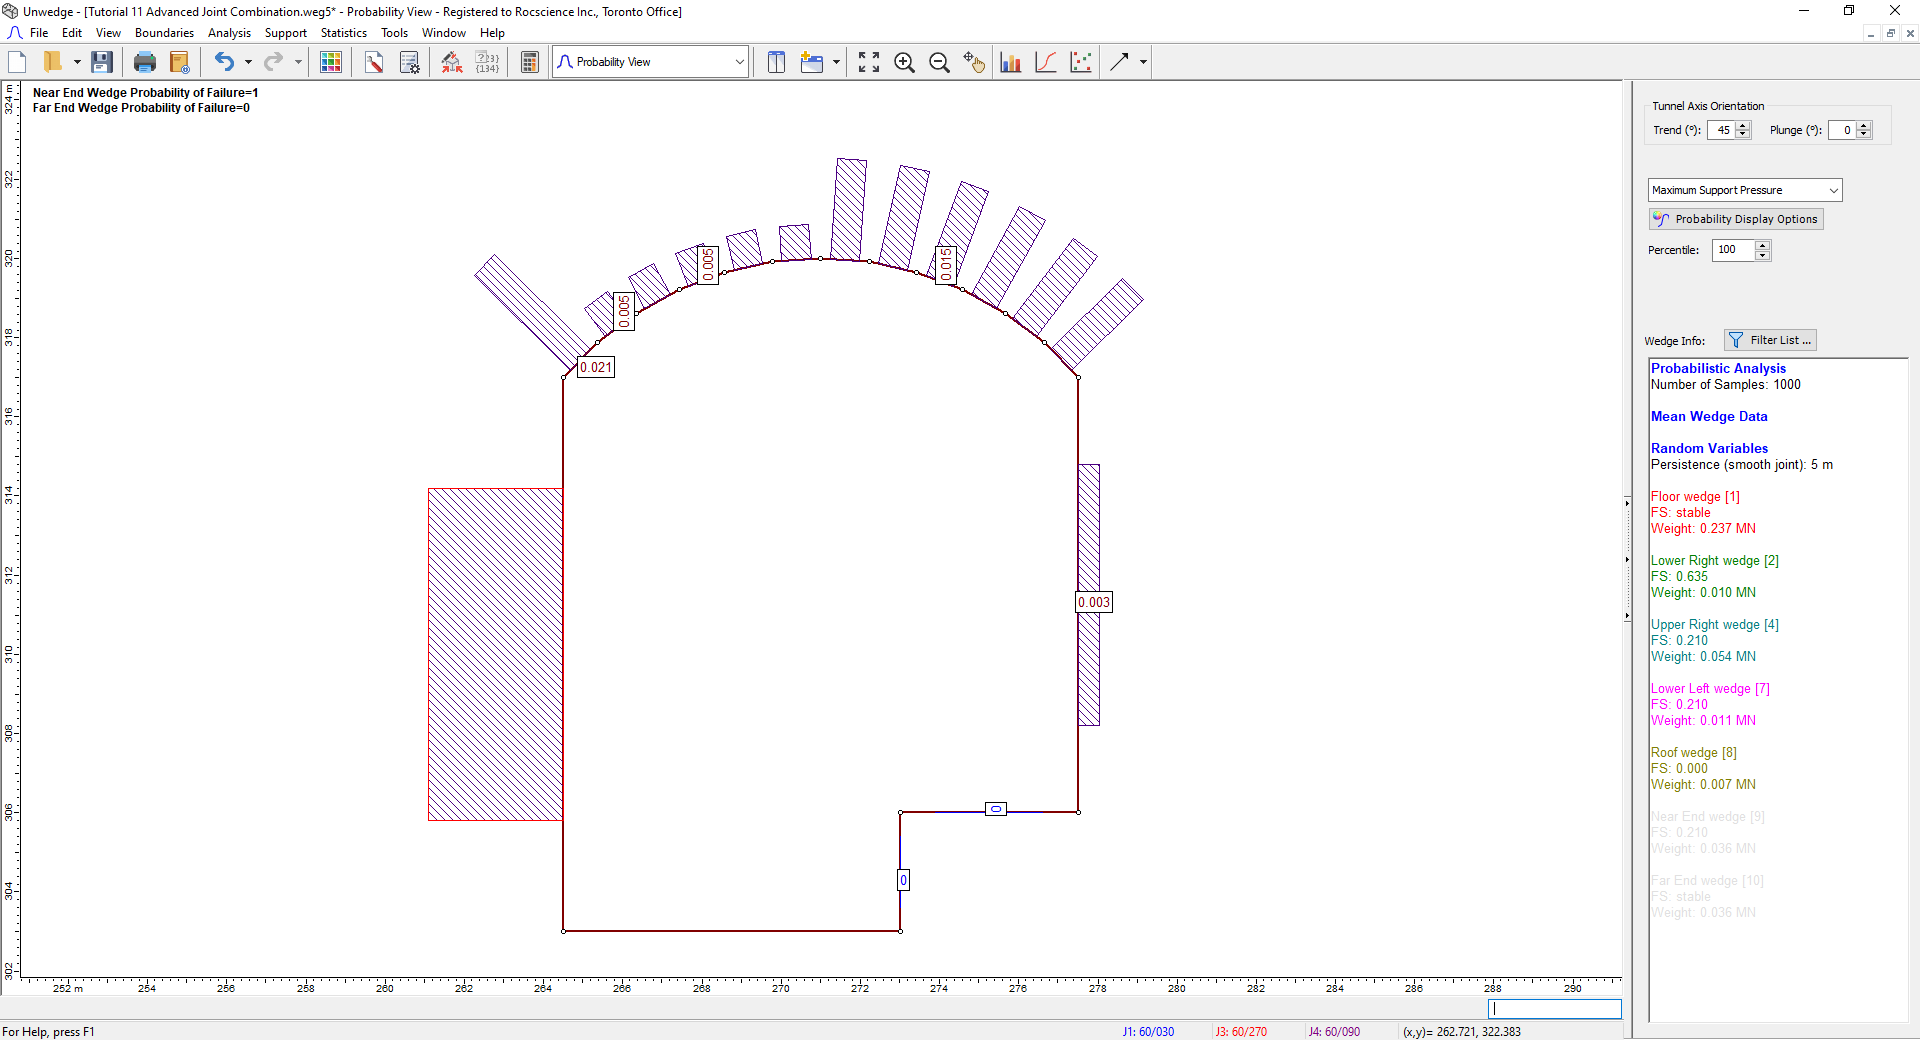
The Maximum Support Pressure on the roof segments now varies between 0.005 MPa and 0.021 MPa. - Select New Window on the toolbar or Window menu.
The Probability View should now be vertically tiled with the 3D Wedge View. - Click on one of the 0.005 MPa segments to view the resulting wedges.
- Close the 3D Wedge View and maximize the Probability View.
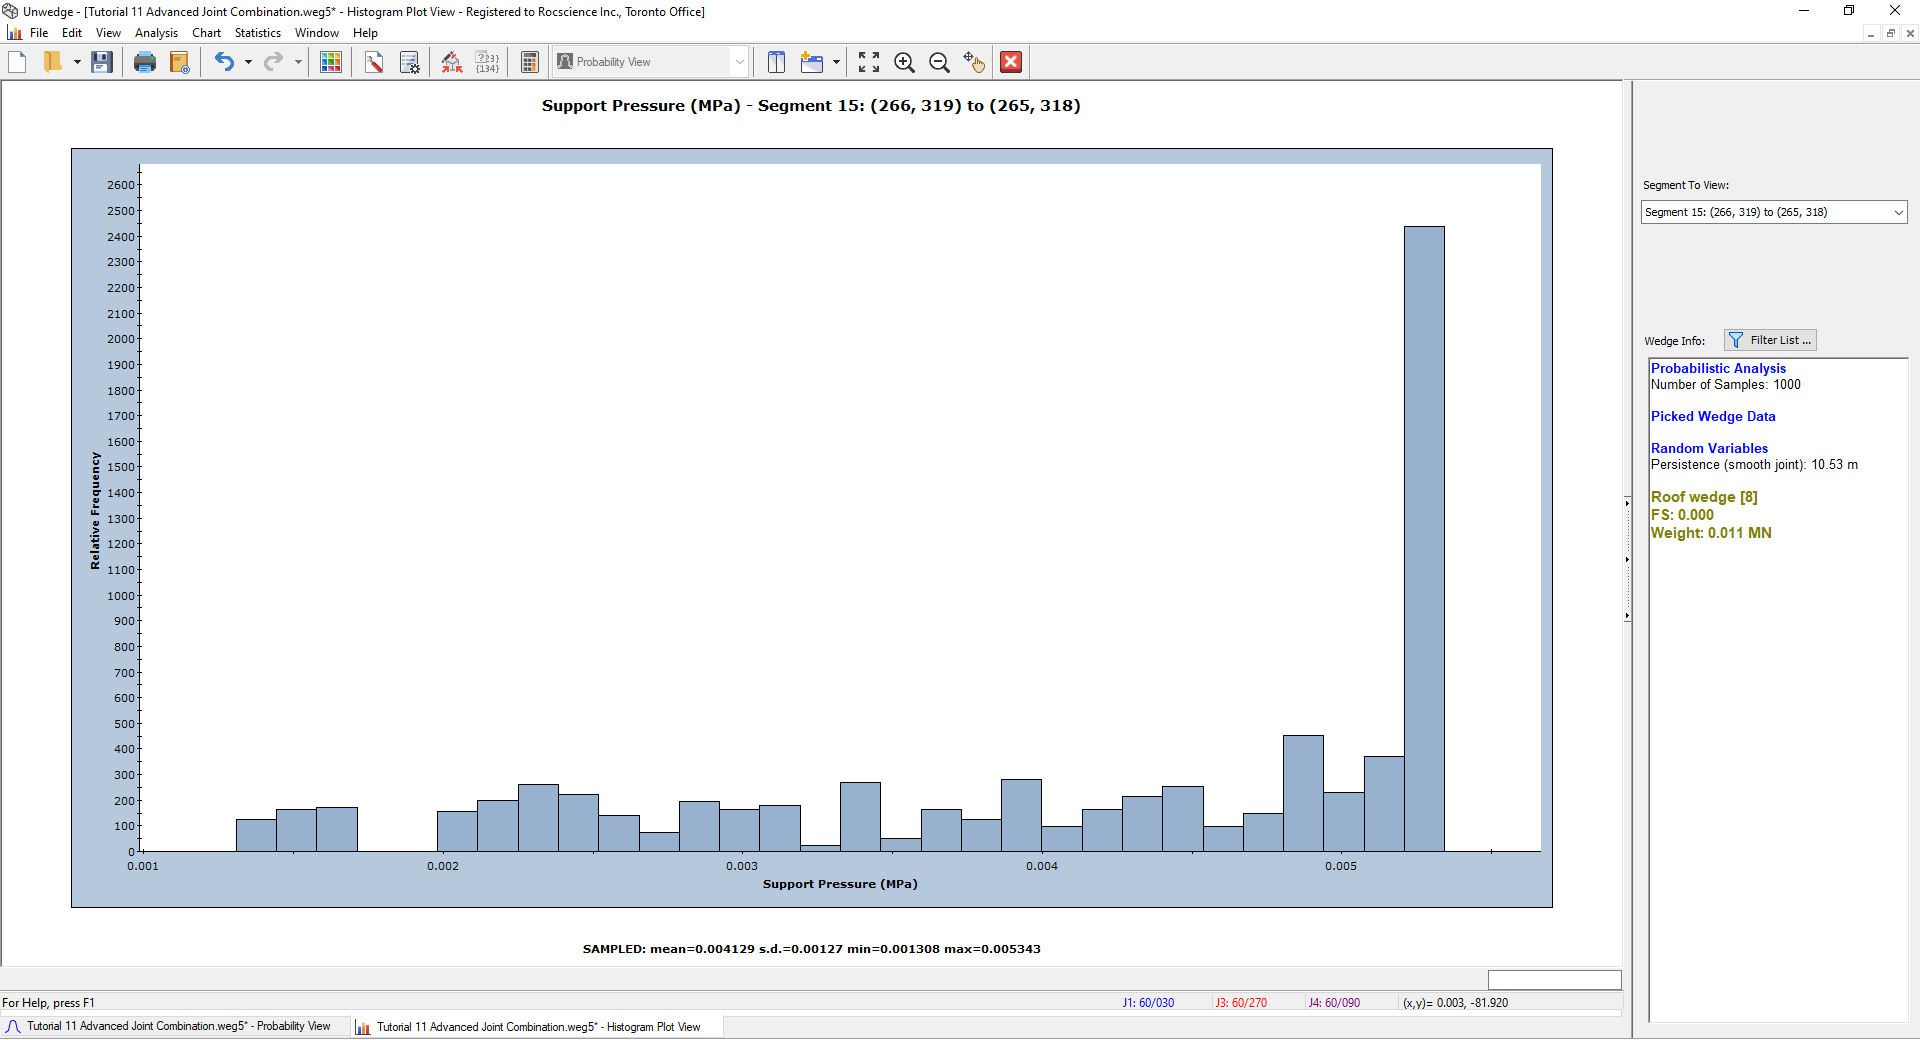
- Right-click on one of the 0.005 MPa roof segments (e.g., Segment 15) and select Plot Histogram on the popup menu.

- Select OK in the dialog.
You should see the following Histogram:
We will now go on to look at the fourth joint combination.
- Close the Histogram view.
6.0 Combination 4: Joints 2,3,4
- Select Input Data from the toolbar or the Analysis menu.
- Navigate to the Joint Orientations tab.
Under Joint Combinations, we can see that we are looking at Combination 3 of 4 total combinations. - Click on the up arrow to go to Combination 4. This combination takes Joints 2, 3, and 4 into account.
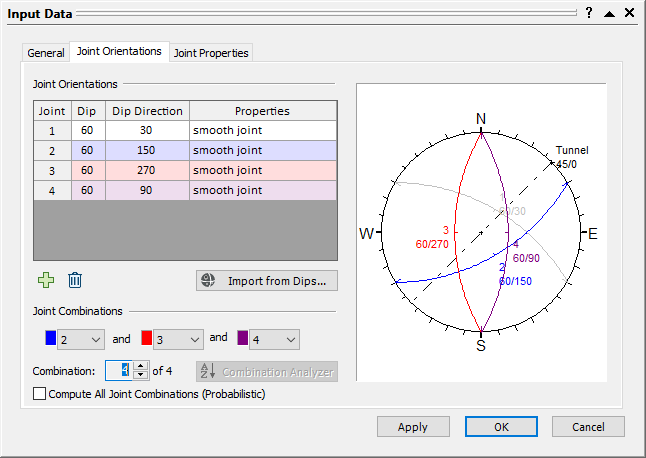
- Select OK.
- Select Compute on the toolbar or the Analysis menu.
- Switch to the Probability View .
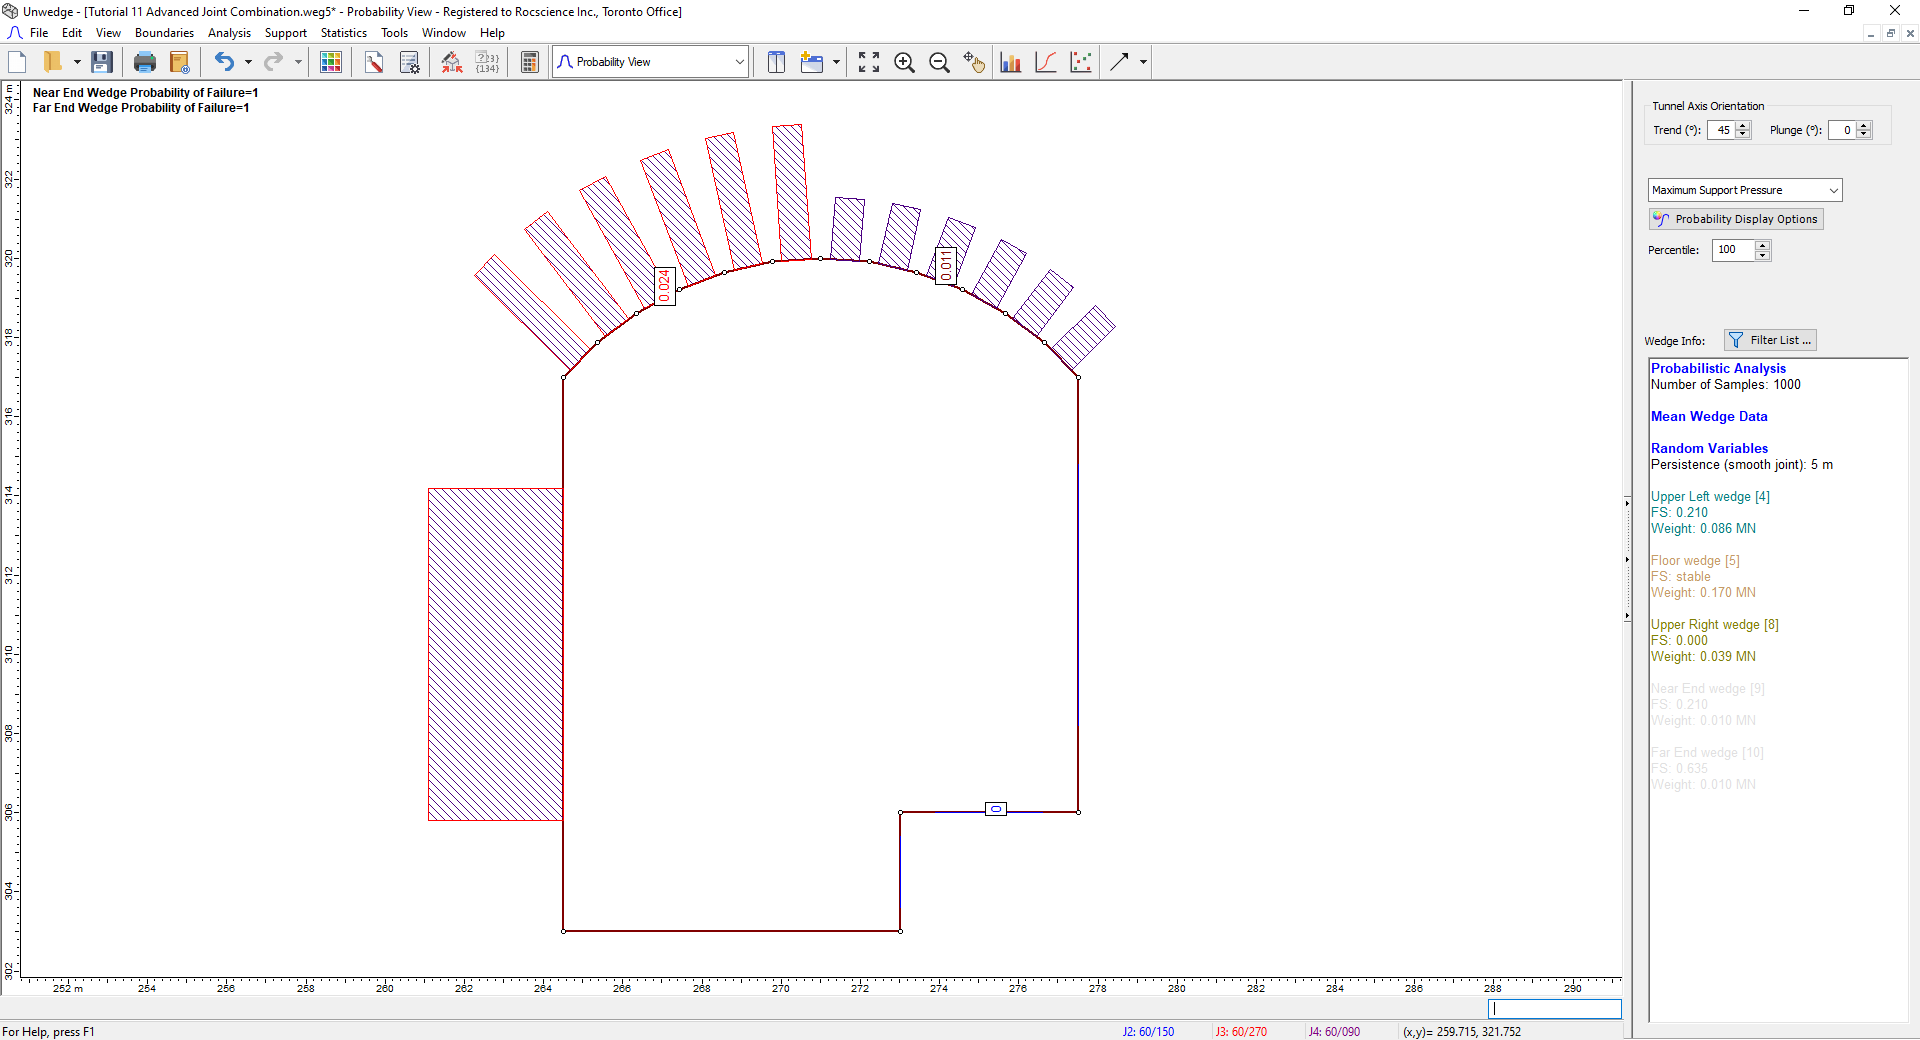
Probability Model View
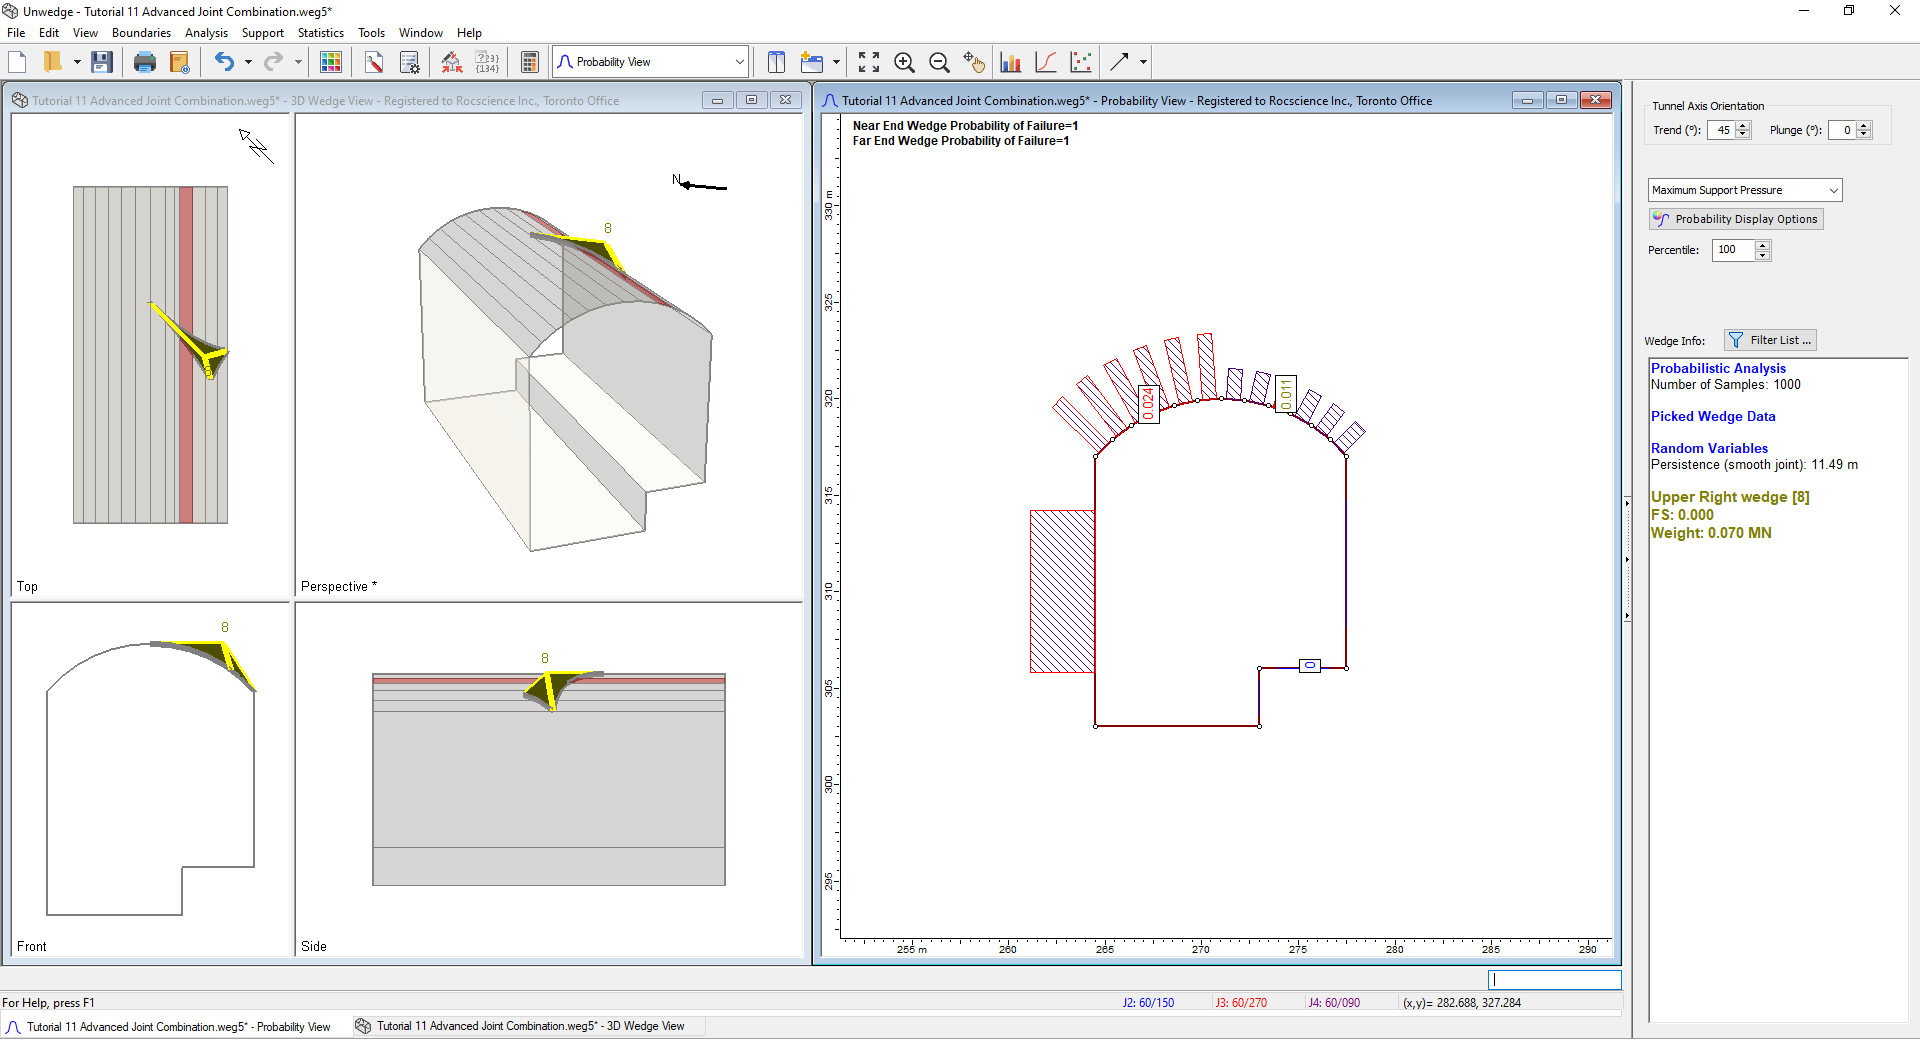
The Maximum Support Pressure on the roof segments now varies between 0.011 MPa and 0.024 MPa. - Select New Window on the toolbar or Window menu.
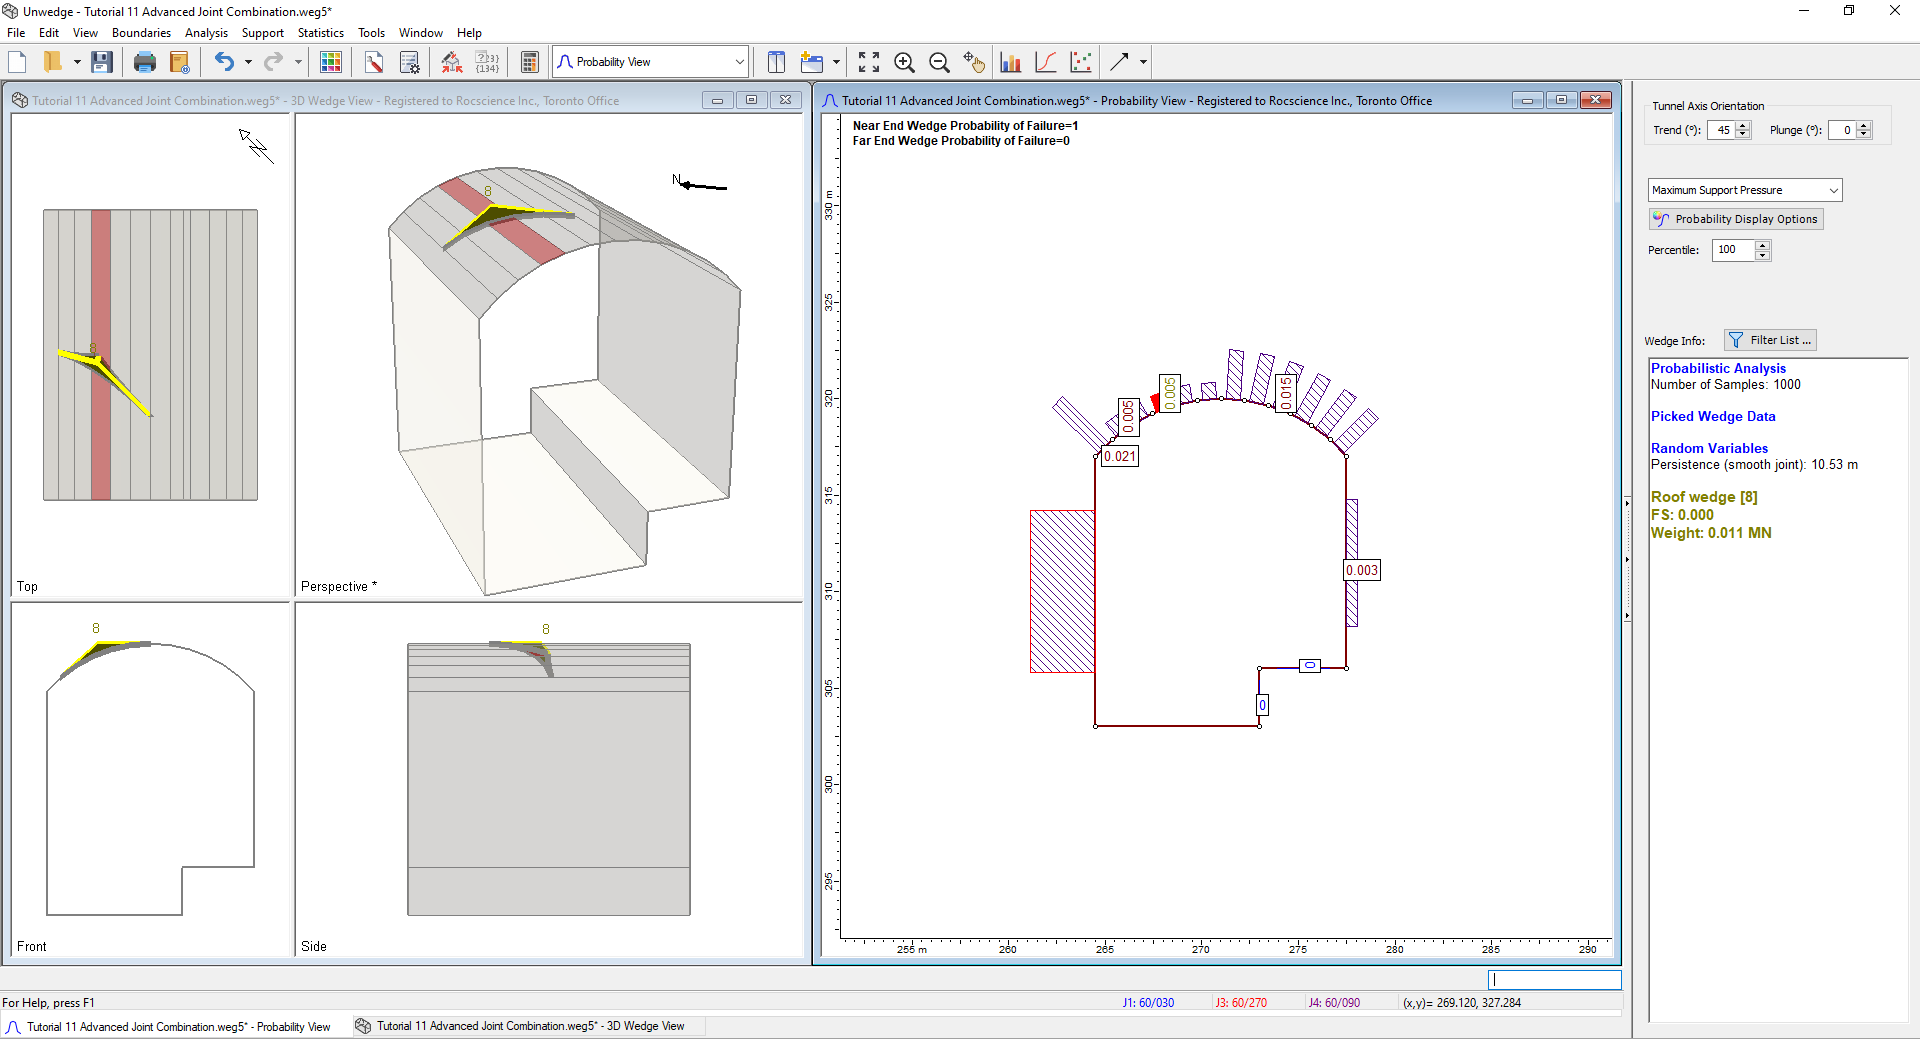
The Probability View should now be vertically tiled with the 3D Wedge View. - Click on one of the 0.011 MPa segments (e.g., Segment 8) to view the resulting wedges.
3D Wedge Model View - Close the 3D Wedge View and maximize the Probability View.
- Right-click on one of the 0.011 MPa roof segments (e.g., Segment 8) and select Plot Histogram on the popup menu.
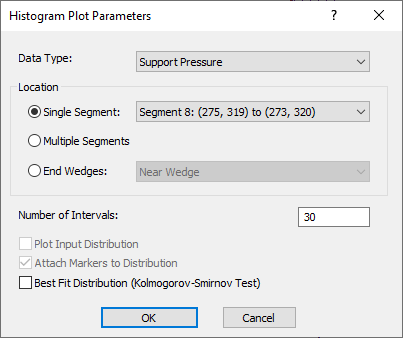
- Select OK in the dialog.
You should see the following Histogram:
- Close the Histogram view.
7.0 All Joint Combinations
We have seen different results from each combination of joints. We will now show how we can look at all four joint combinations at once.
We should note here that the number of samples we entered in the Project Settings dialog at the beginning of the tutorial (1000) was the number of samples used for each combination. That is to say, for Joint Combination 1, 1000 wedge orientations were computed, and the Maximum Support Pressure from all these samples was studied in the Probability View. Similarly, for Joint Combination 2, 1000 samples were computed, and the Maximum Support Pressure from all these samples was studied.
In this section, we will look at all four joint combinations at once. Because there are four different combinations of joints, UnWedge will divide the number of samples by four. Therefore, for Joint Combination 1, 1000/4 = 250 samples will be computed. Similarly, 250 samples will be computed for Joint Combination 2, and so on. For the sake of consistency, and in order to have comparable results, we want 1000 samples to be computed for each joint combination as before. Therefore, we will use a sampling size of 4000.
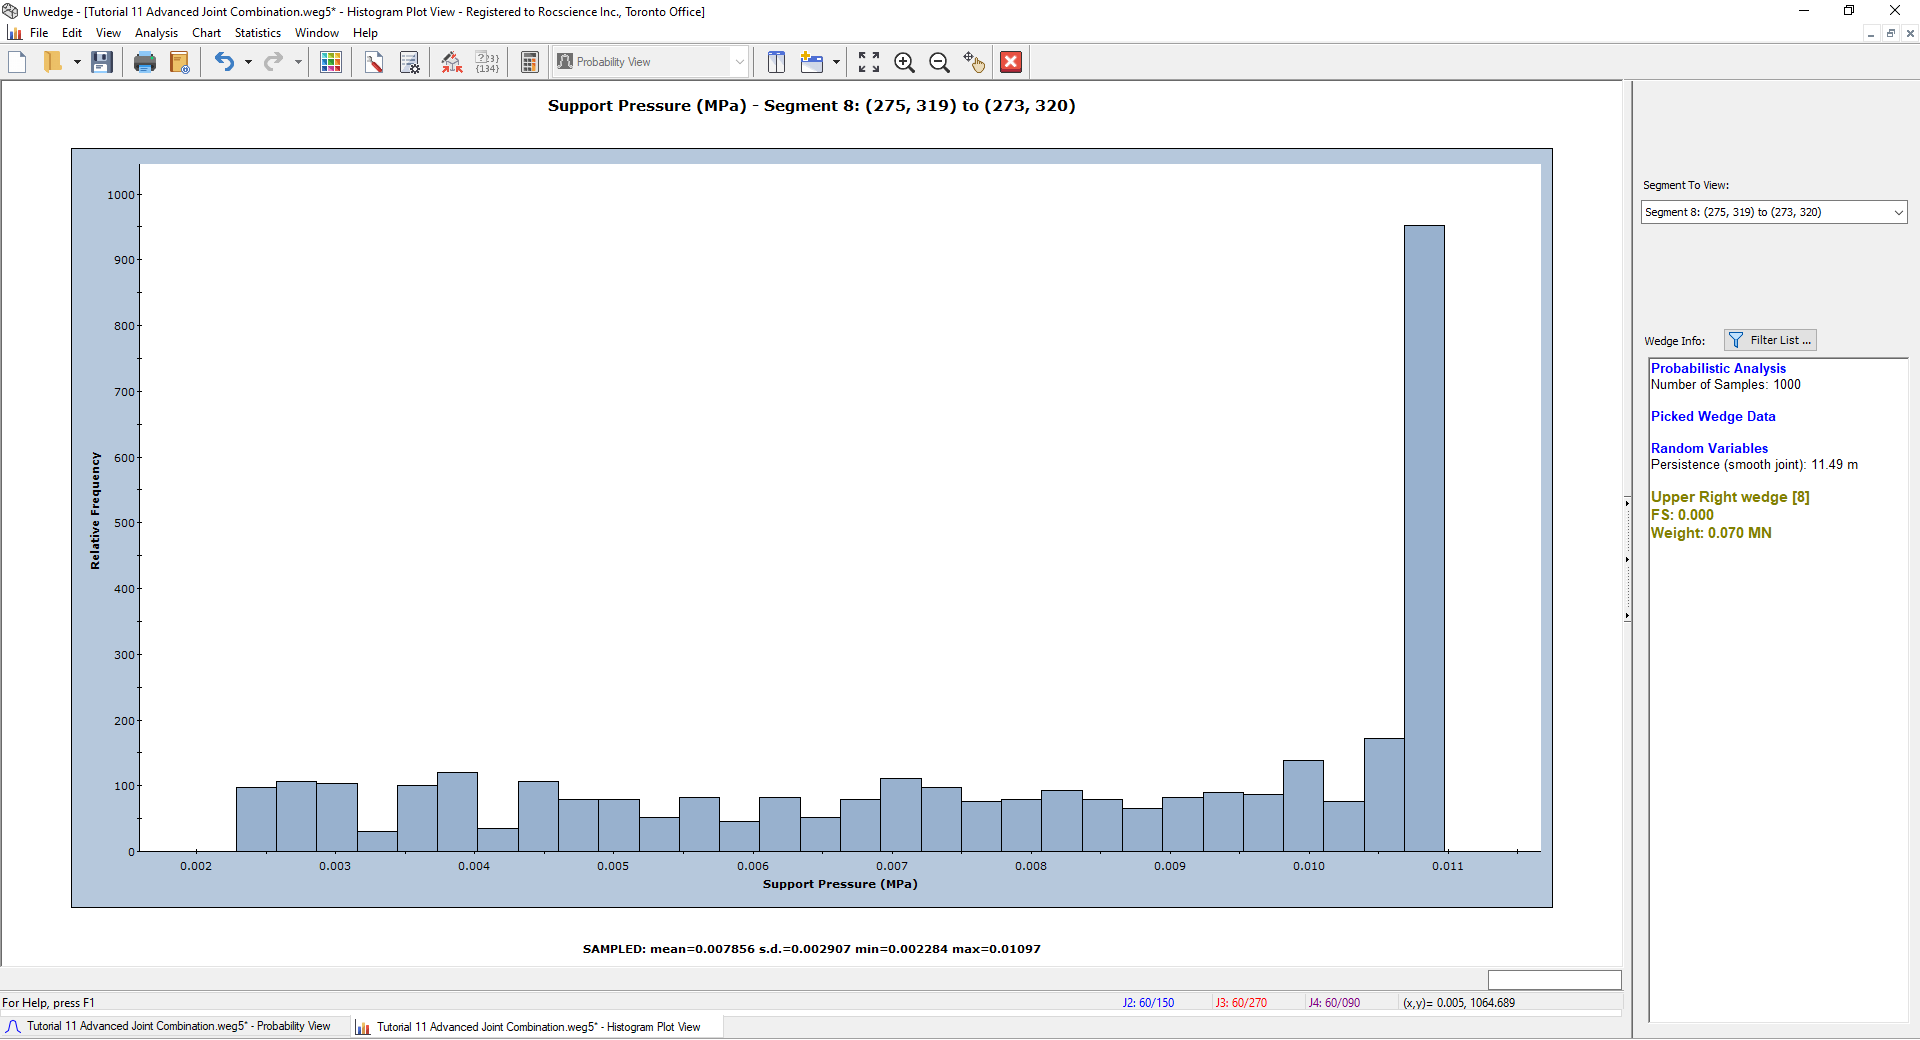
- Select Project Settings from the toolbar or the Analysis menu.
- Click on the Sampling tab and change the Number of Samples = 4000.
- Select OK.
- Select Input Data from the toolbar or the Analysis menu.
- Navigate to the Joint Orientations tab.
Under Joint Combinations, we can see that we are looking at Combination 4 out of the four total combinations. - Select the Compute All Joint Combinations (Probabilistic) checkbox.
- Select OK.
- Select Compute on the toolbar or the Analysis menu.
- Switch to the Probability View .
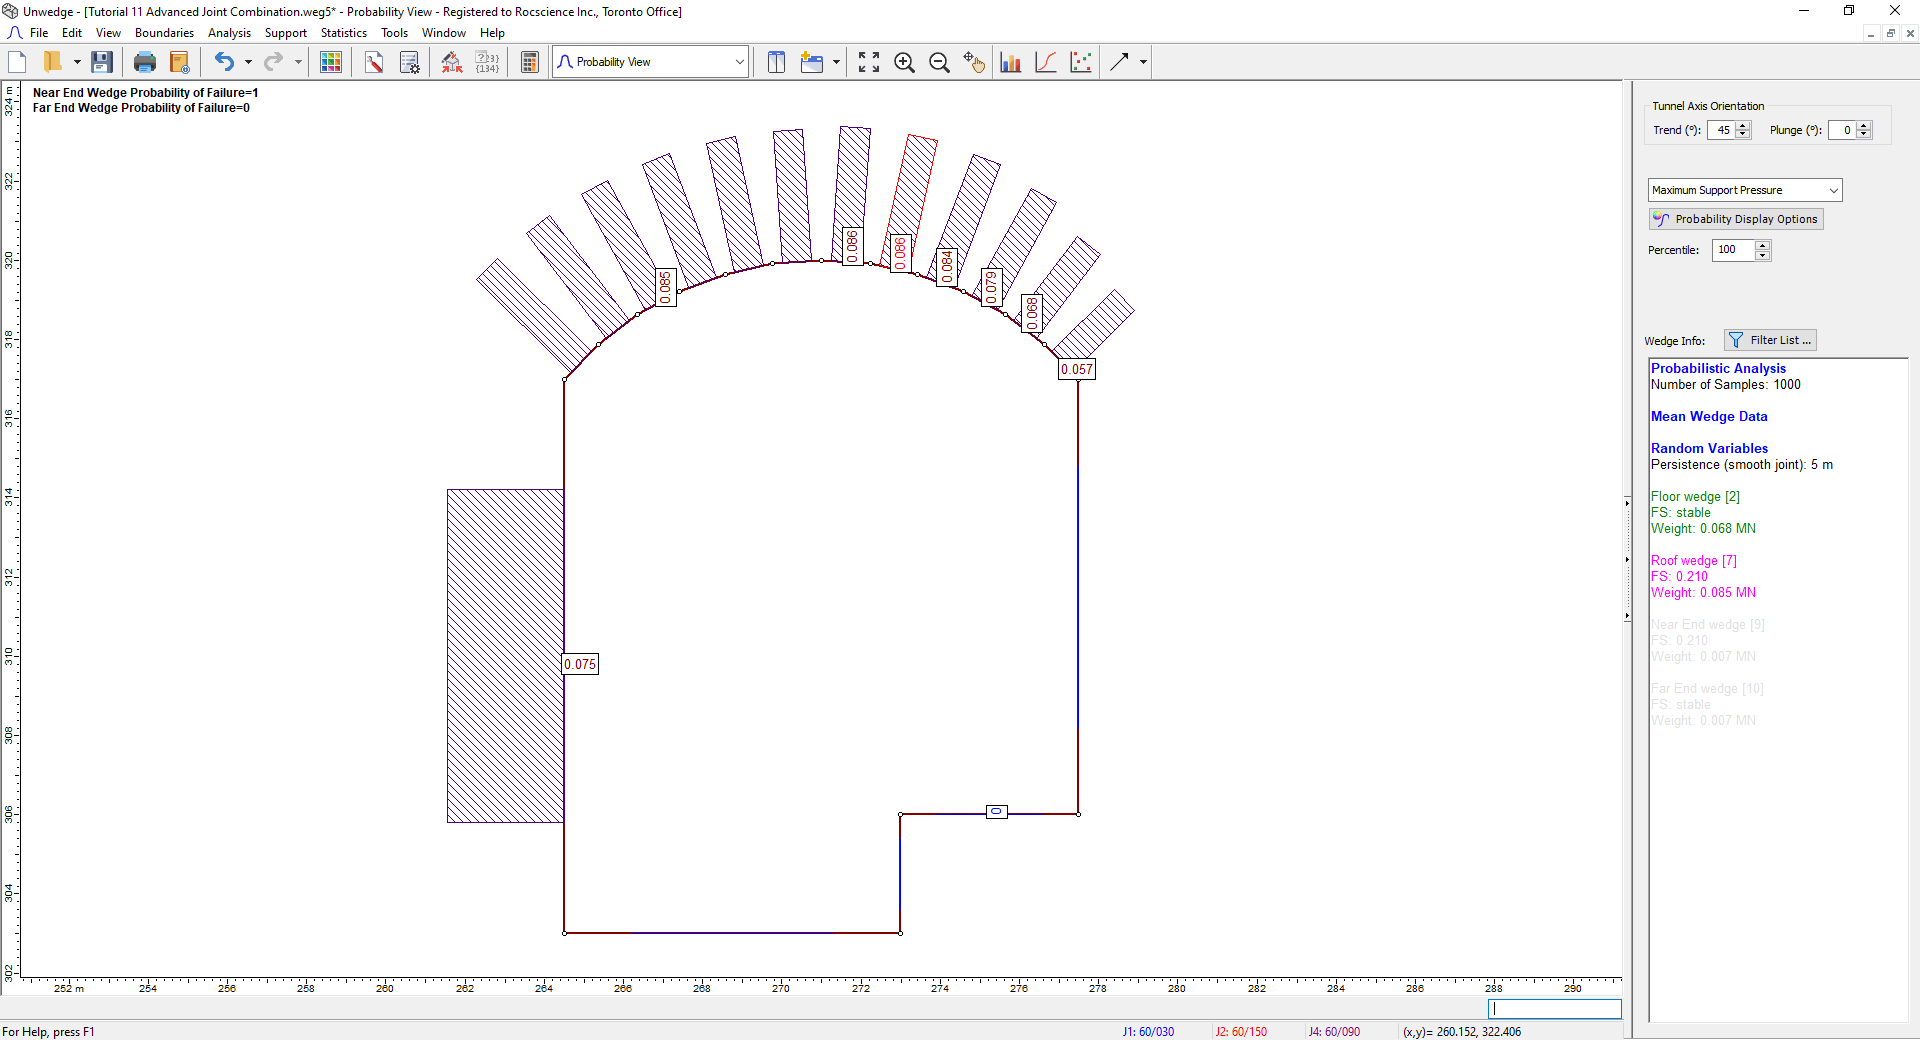
You should see the following:
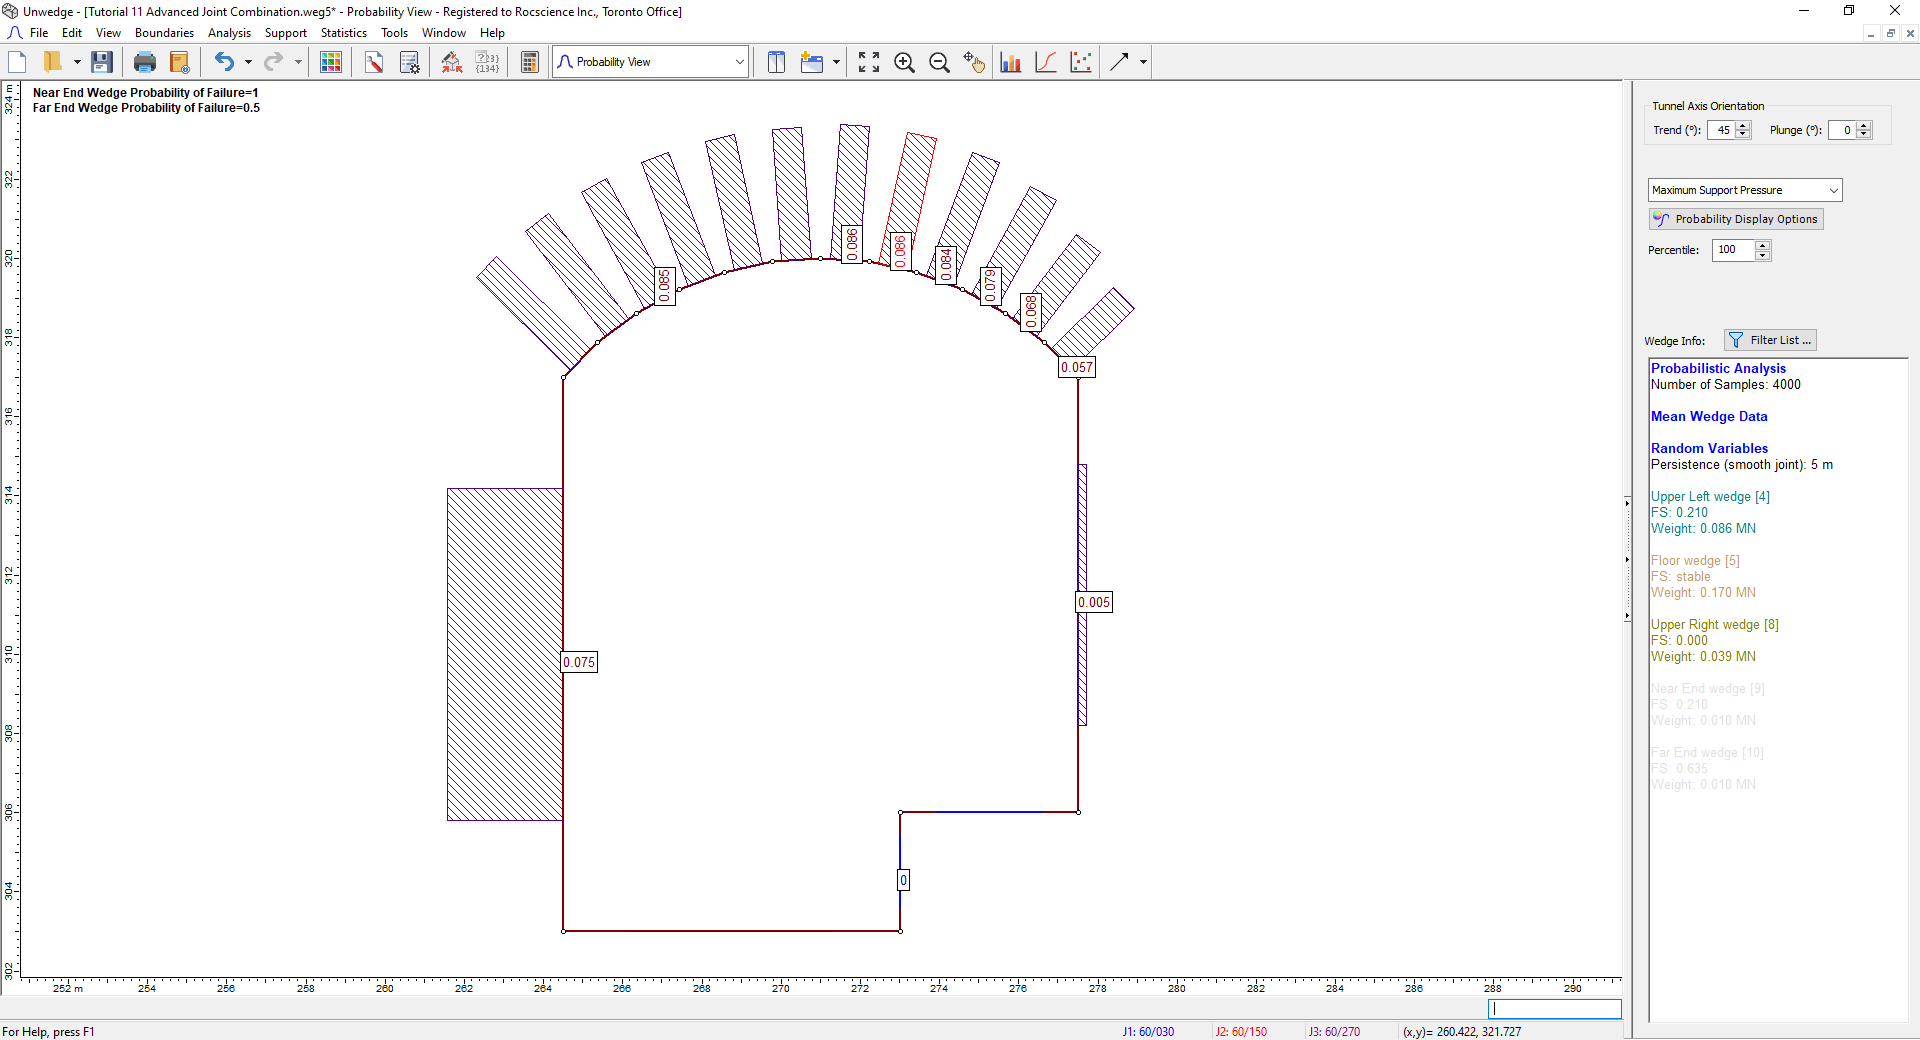
The Maximum Support Pressure on the roof segments now varies between 0.057 MPa and 0.086 MPa. Notice that the 0.086 MPa value is the Maximum Support Pressure from Joint Combination 2; it is also the maximum of the pressures we saw in the four different joint combinations, for this segment. For the right-most segment, notice that the 0.057 MPa value is the Maximum Support Pressure we saw from all the combinations for this segment. This demonstrates that we are now looking at the Maximum Support Pressure from all of the possible joint combinations.
- Right-click on one of the 0.086 MPa roof segments (e.g., Segment 9) and select Plot Histogram .

- Select OK.
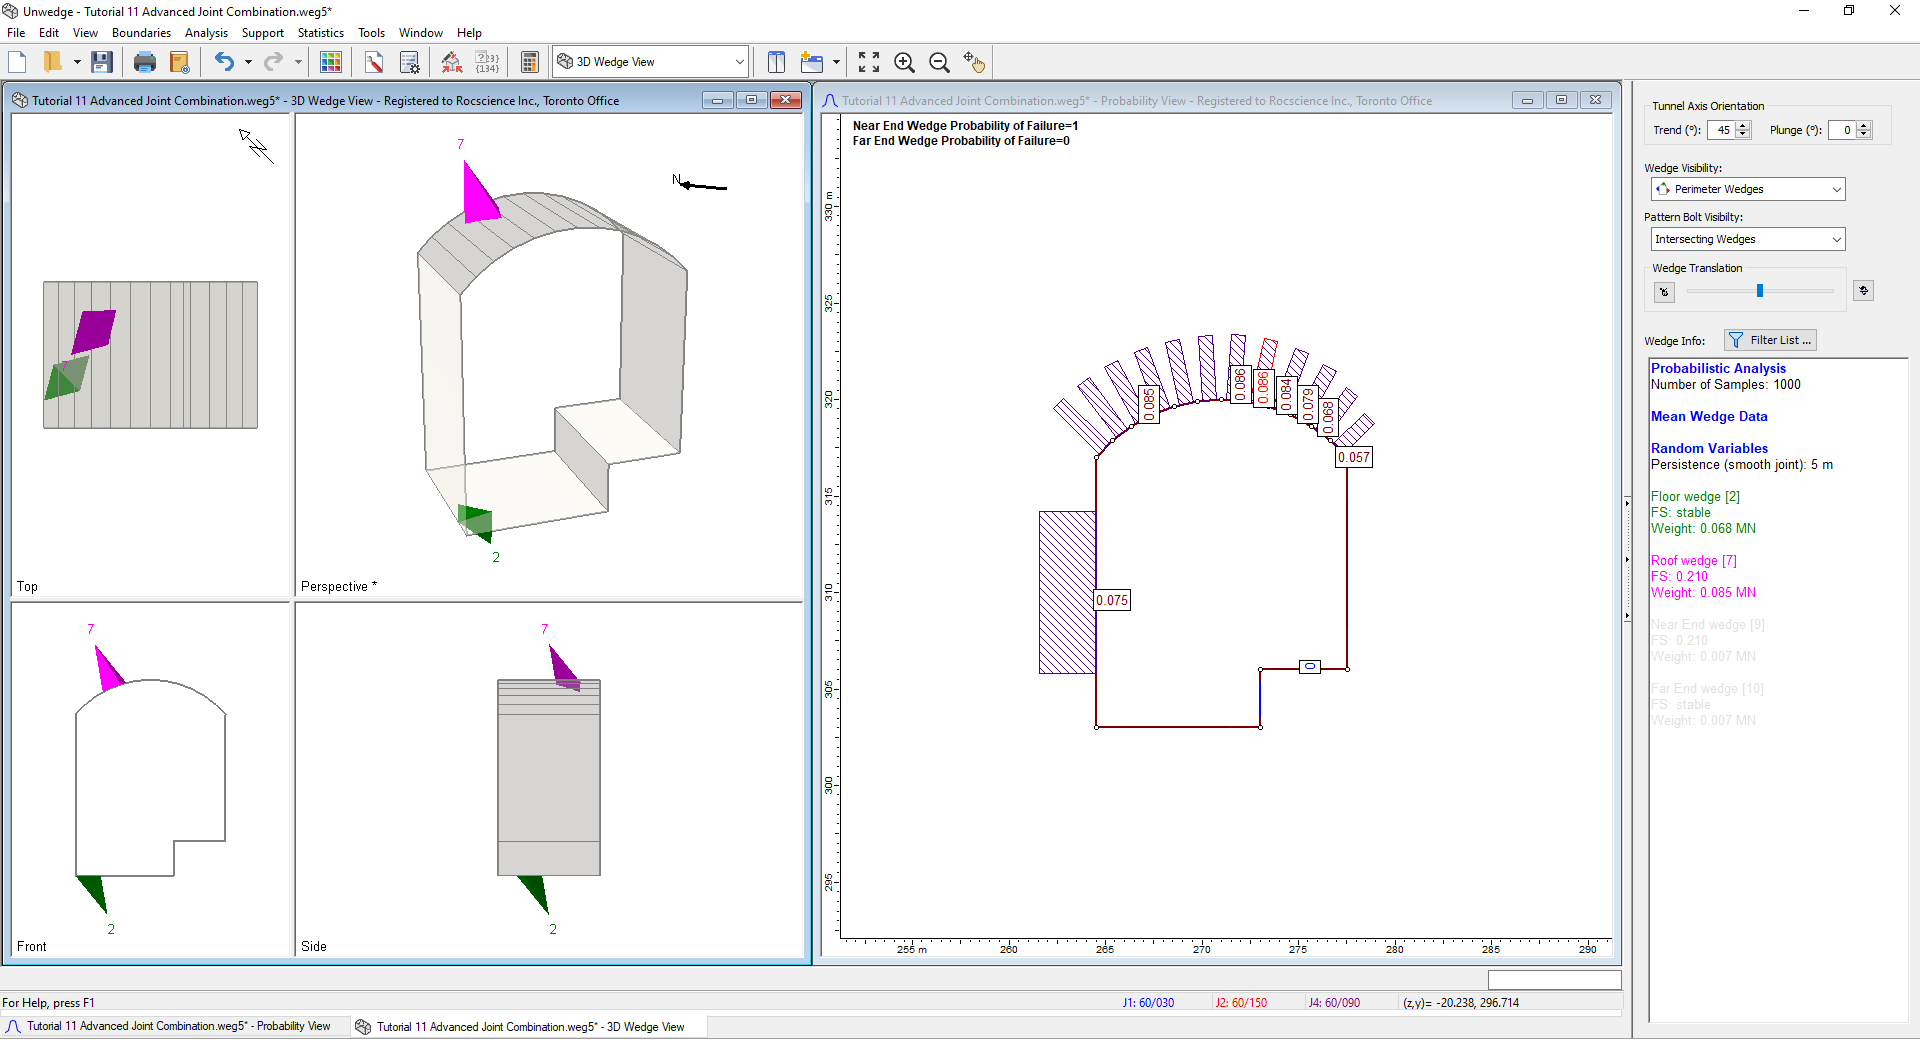
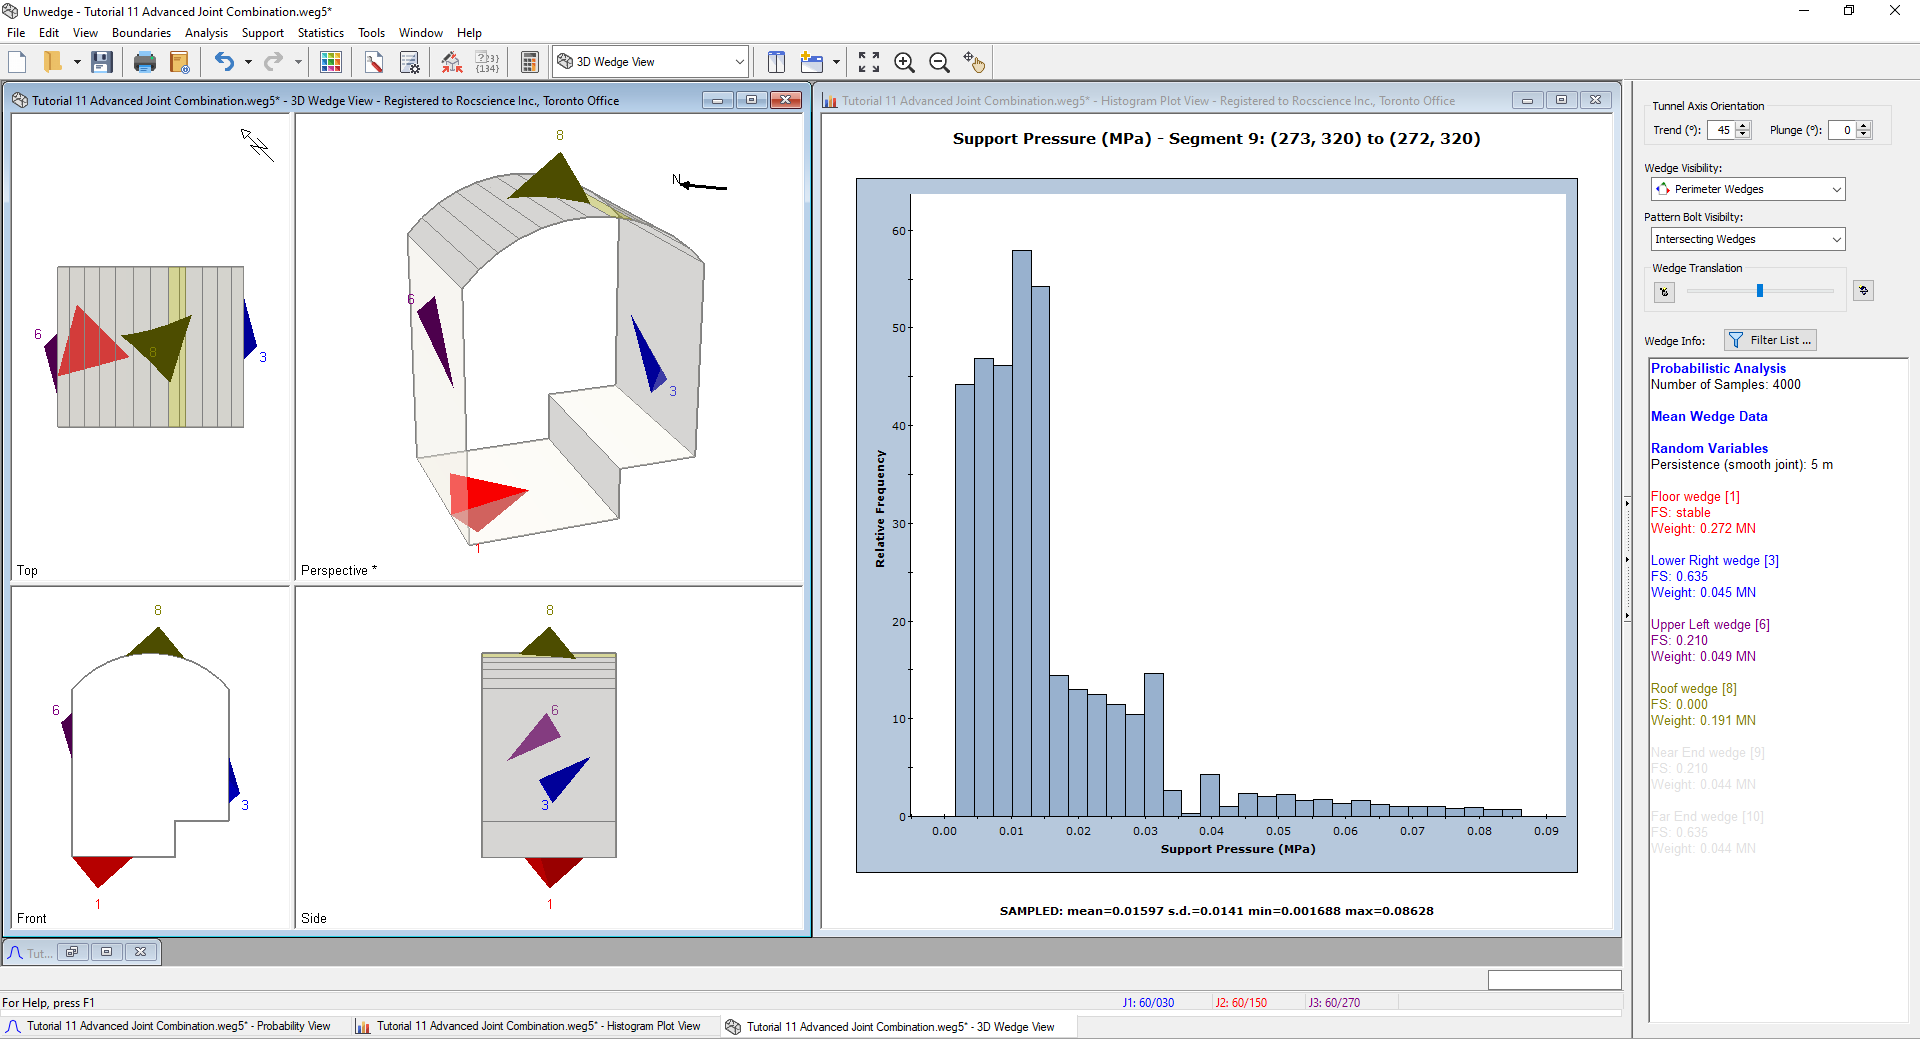
- Select New Window .
The Probability View should now be vertically tiled with the 3D Wedge View and the Histogram. - Minimize the Probability View and select Tile Vertically
 on the toolbar or Window menu.
You should see the following on your screen.
Recall that Joint Combination 1 gave us a maximum support pressure of 0.032 MPa for this segment.
- Double-click on the Histogram where the Support Pressure is about 0.032 MPa.
The resulting 3D Wedge View is almost identical to the one we saw in the Joint Combination 1 section of the tutorial. From the Sidebar we can see that the exact pressure in the figure is 0.033 MPa.
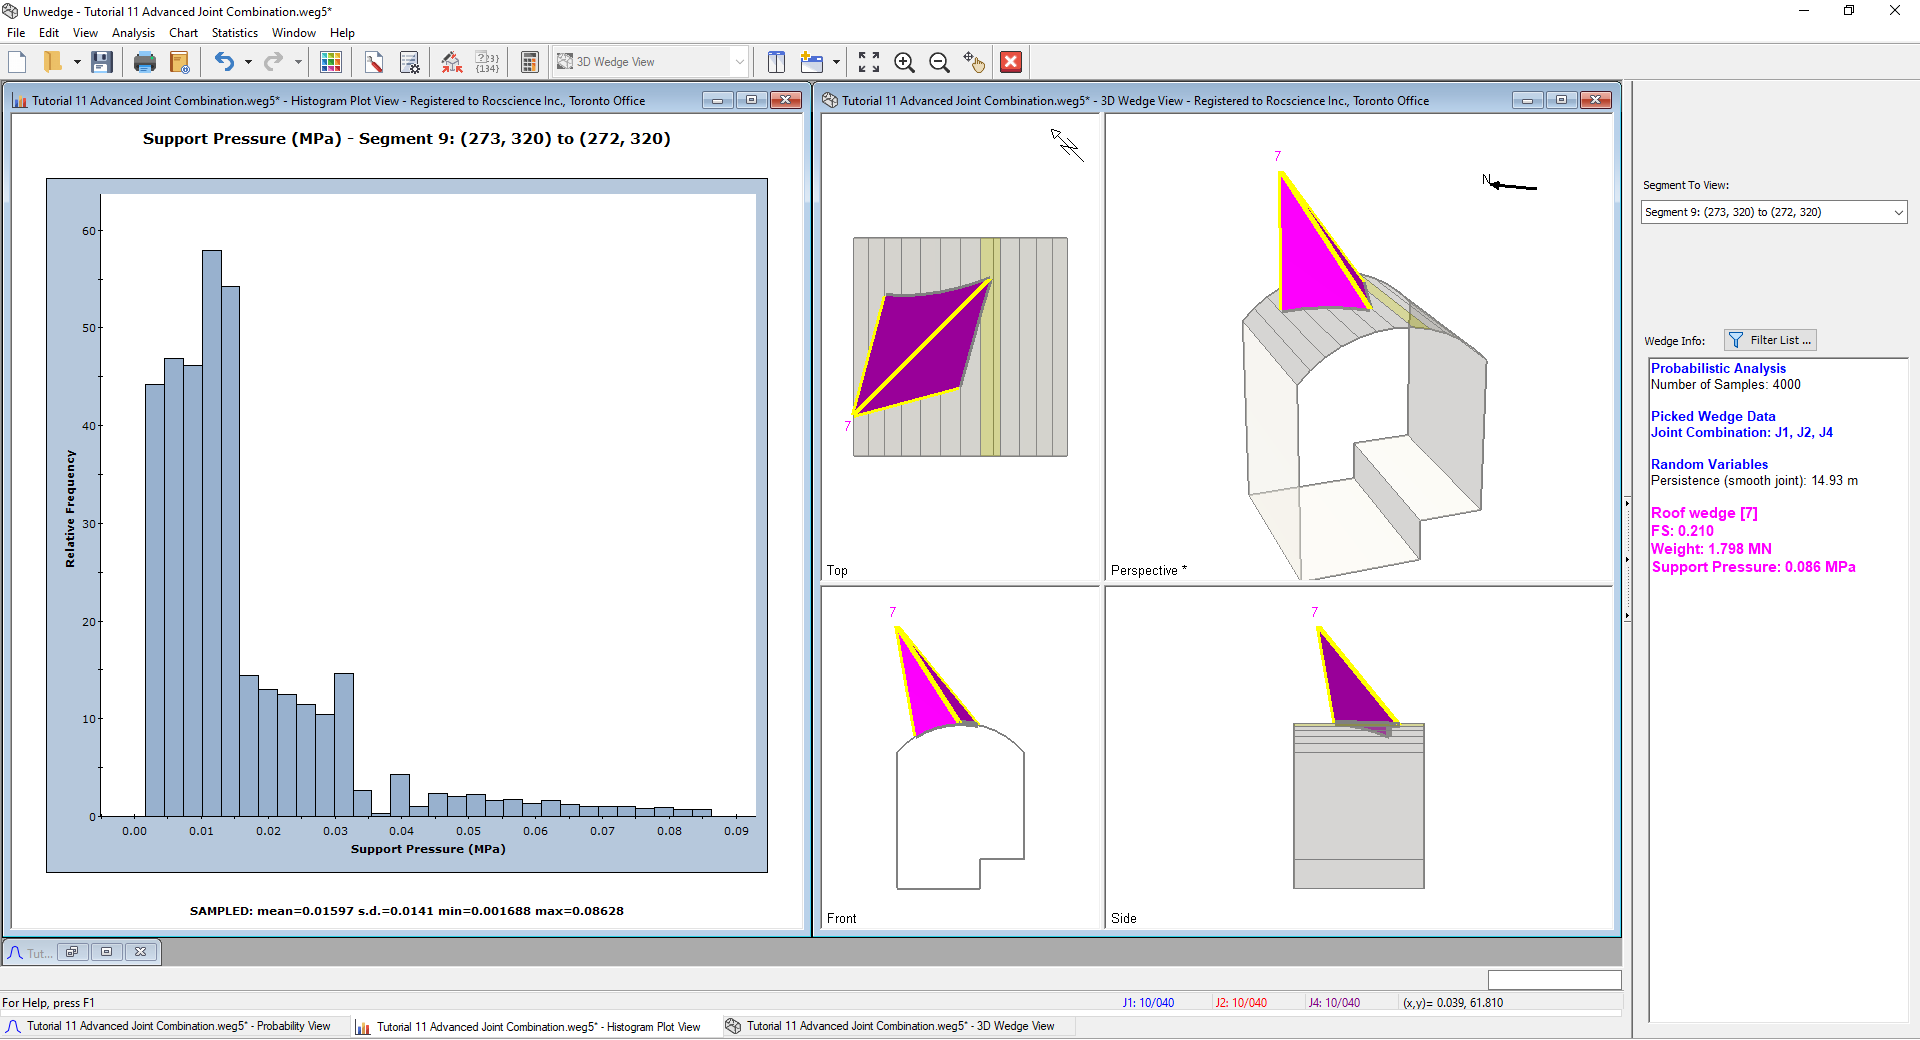
- Now, double-click on the Histogram where the Support Pressure is maximum (0.086 MPa).
You will notice that the resulting wedges are identical to those we saw in Joint Combination 2. Recall the maximum support pressure on this roof segment for Combination 2 was also 0.086 MPa.
It will be left as an exercise for the user to examine the wedges resulting from double-clicking on the Histogram on the same pressures seen in Joint Combination 3 and 4.
In conclusion, using the Compute All Joint Combinations (Probabilistic) checkbox, allows the user to view the results from all possible joint combinations at once.
This concludes the tutorial. You are now ready for the next tutorial, Tutorial 12 - Batch Compute in UnWedge.