Sensitivity Analysis
The effect of uncertainty in the values of input parameters in RocPlane can be explored using a Sensitivity analysis. In a Sensitivity analysis, values of model parameters are varied across a range of likely values, and the effect on computed Factors of Safety is observed. This exercise helps identify the parameters that have the most effect on the stability of a sliding block and can be used to compare the effectiveness of various remedial measures.
Sensitivity plots are plots of Factor of Safety results against percentage changes in specified model parameters. On Sensitivity plots, the gradient of a curve for a parameter indicates the effect that parameter has on the Factor of Safety of a sliding mass. Steeper rising or falling curves indicate greater influence on the Factor of Safety.
To carry out a Sensitivity analysis with RocPlane:
- Select Analysis Type = Deterministic in the Project Settings dialog.
- Select the Sensitivity
 option from the Analysis menu or the toolbar.
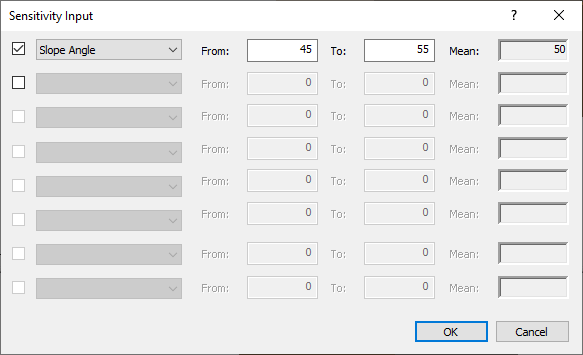
- In the Sensitivity Input dialog, select the first available check box in the dialog. The input data fields beside the check box are enabled.
- From the drop-list of input variables, select a parameter for which you desire a sensitivity plot.
- Using the From and To input edit boxes, enter a range within which you would like the parameter to vary. To assist you in doing so, RocPlane automatically displays the Mean value of the parameter from the main Input Data dialog .
- If you would like sensitivity plots for other parameters, select the next available check box and repeat the steps above.
- When you are done selecting parameters, click OK.
NOTES:
- A Sensitivity plot is generated by subdividing each variable range (defined by the From and To values in the Sensitivity Input dialog), into 50 intervals, and calculating the Factor of Safety at each value of the variable between the From and To values. If you right-click on the graph, and select the Markers option, you will see the actual points used to generate the curve(s).
- The Percent Change (on the horizontal axis of a Sensitivity Graph) is the relative difference between the Minimum value of a variable ( 0 percent) and the Maximum value of a variable (100 percent), according to the From and To ranges you have entered in the Sensitivity Input dialog.
- You can modify the data in an existing Sensitivity plot by right-clicking the mouse in the plot and selecting Update Sensitivity Data.