Rocscience acquires 3GSM. Read more

Search Results

Chart Properties

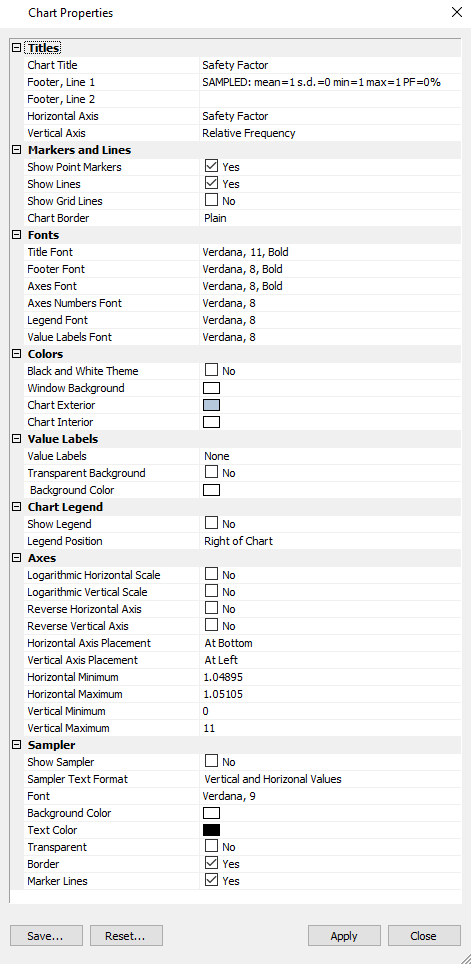
The Chart Properties option in RocPlane allows you to customize several properties in Histogram, Cumulative, Scatter, and Sensitivity plots, as shown below. You can access the option on the Chart menu or the right-click menu.

  • Titles
  • Markers and Lines
  • Fonts
  • Colours
  • Value Labels
  • Chart Legend
  • Axes
  • Sampler

Chart Properties

NOTE: Changes to Chart Properties are applied to the active plot. To change properties for all plots, see below.

Save Properties as Default

To save the current properties as the default for all new plots:

  1. Click the Save button.
  2. Click Yes.

Reset Properties

To reset properties to the program defaults:

  1. Click the Reset button.
  2. Click Reset to Application Defaults.

To revert to the previous properties:

  1. Click the Reset button.
  2. Click Revert to Previous.
Rocscience logo, click here to return to the homepage Portal Account Portal Account Log In Log Out Home Shopping Cart icon Click here to search our site Click here to close Learning Tech Support Documentation Info Chevron Delete Back to Top View More" Previous Next PDF File Calendar Location Language Fees Video Click here to visit Rocscience's LinkedIn page Click here to visit Rocscience's YouTube page Click here to visit Rocscience's X page Click here to visit Rocscience's Facebook page Click here to visit Rocscience's Instagram page Click here to visit Rocscience's Reddit page Bookmark Network Scroll down for more Checkmark Download Print Back to top Single User Multiple Users RSLog RocFall3 CPillar Dips EX3 RocFall RocPlane RocSlope RocSupport RocTopple RS2 RS3 RSData RSPile Settle3 Slide2 Slide3 SWedge UnWedge RocTunnel Commercial License Education License Trial License Shop safe & secure Money-back guarantee