Open Pit Stability Analysis
1.0 Introduction
This tutorial will demonstrate how to use SSR (Shear Strength Reduction) method to analyze slope stability of an open-pit mine in RS3. The results are also compared with Slide3 as well. All tutorial files installed with RS3 can be accessed by selecting File > Recent > Tutorials folder from the RS3 main menu. The starting file can be found in the Open Pit Stability Analysis folder and the finished product of this tutorial can be found in the Open Pit Stability Analysis_final.rs3v3 file.
Want to watch the video version of the tutorial? Check it out here:
2.0 Import Slide3 Model
From the RS3 main menu:
- Select File > Import > Import Slide3 Project and open the file Open Pit Stability Analysis.slide3m2.
- In the Visibility pane, hide every Global Min layer by toggling off the
 icon. You should see the following:

The geometry along with material properties, mesh, and constraints are provided in the imported geometry from Slide3.
- Select: Analysis > Project Settings

- The model will analyze slope stability through Shear Strength Reduction (SSR) analysis method. Under Shear Strength Reduction, make sure 'Determine Strength Reduction Factor' is activated and values for the SRF are entered as Initial Estimate of SRF = 1, Step Size of Automatic Selected and Tolerance (SRF) = 0.01 (also shown below).
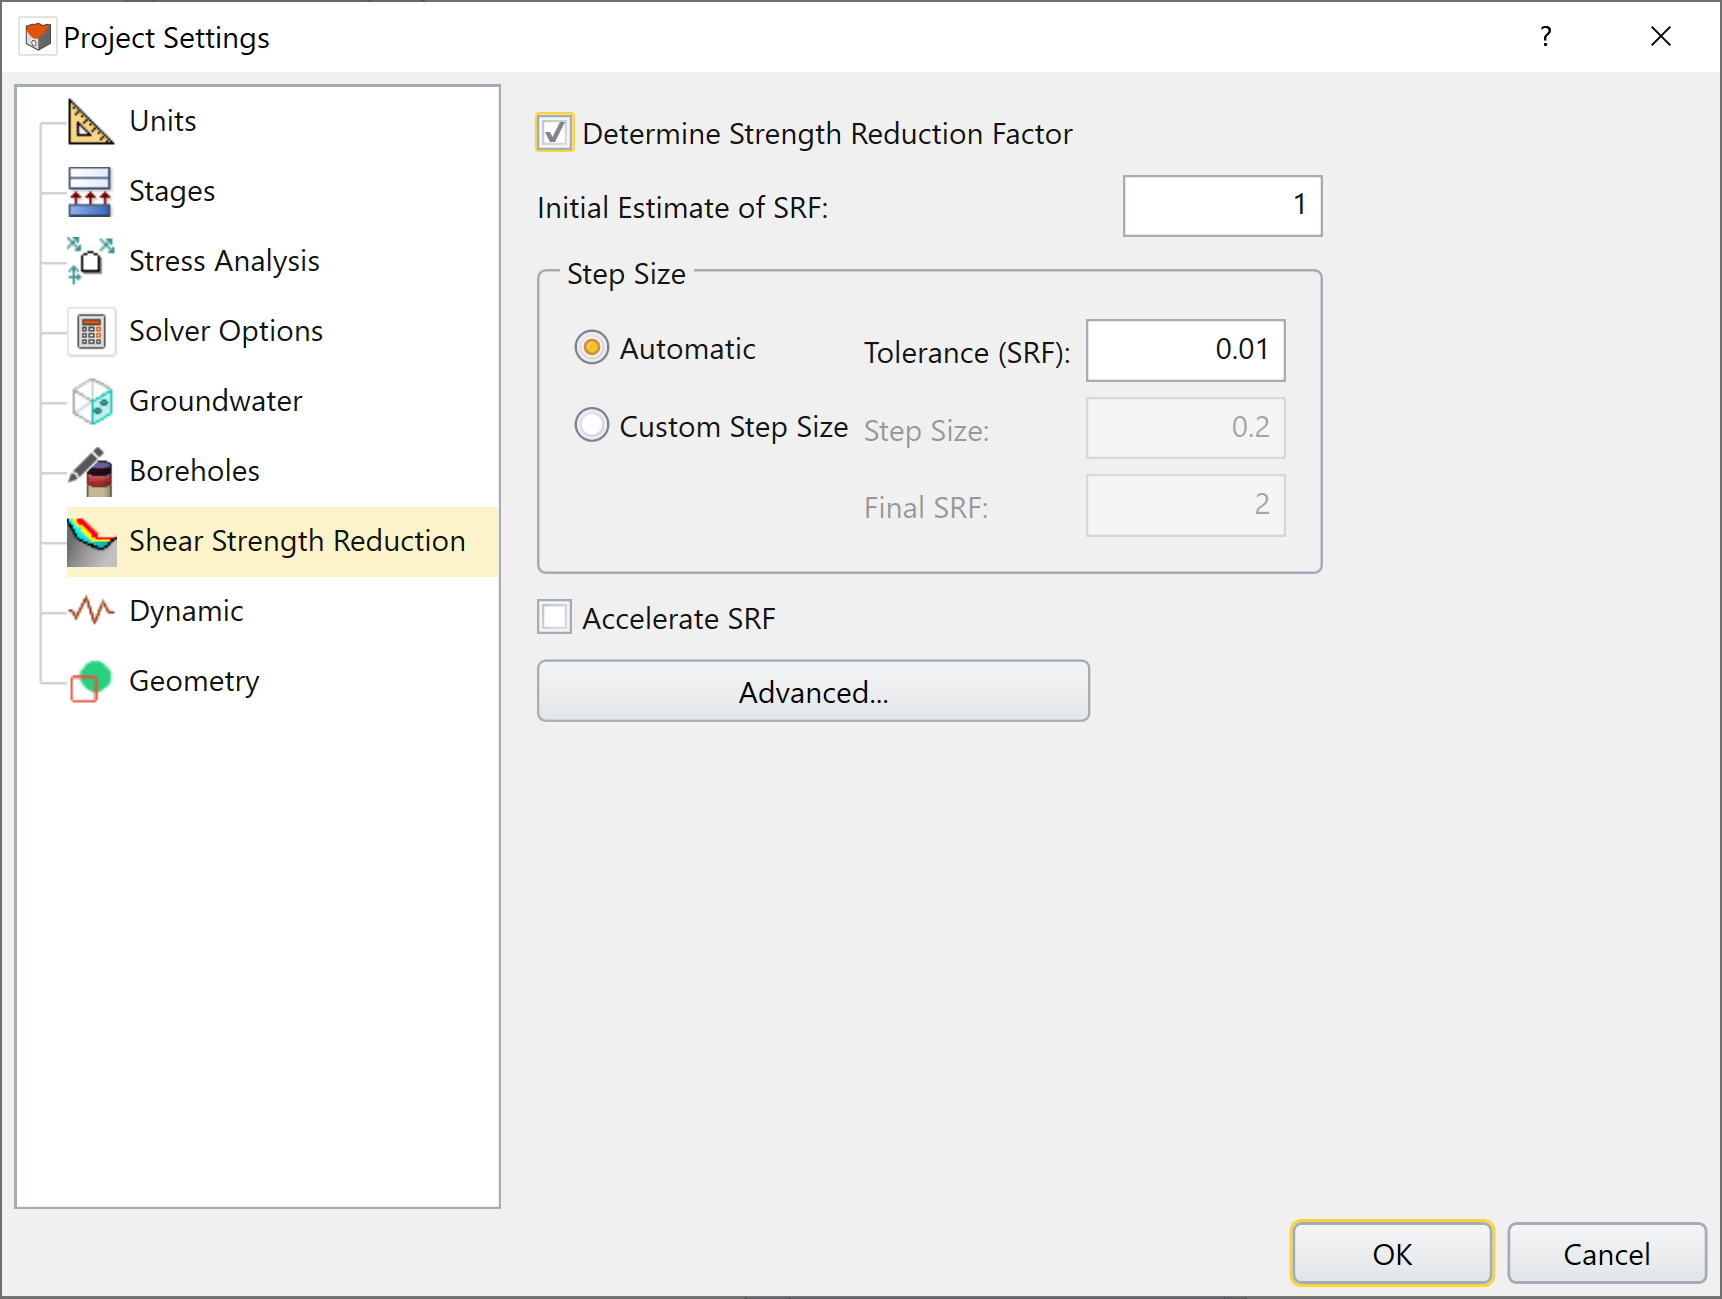
- Click OK to save and close the dialog.
3.0 Restraints
- Navigate to the Restraints workflow tab

- Select: Restraints > Auto Restrain (Surface)
 . The model should look as shown below:
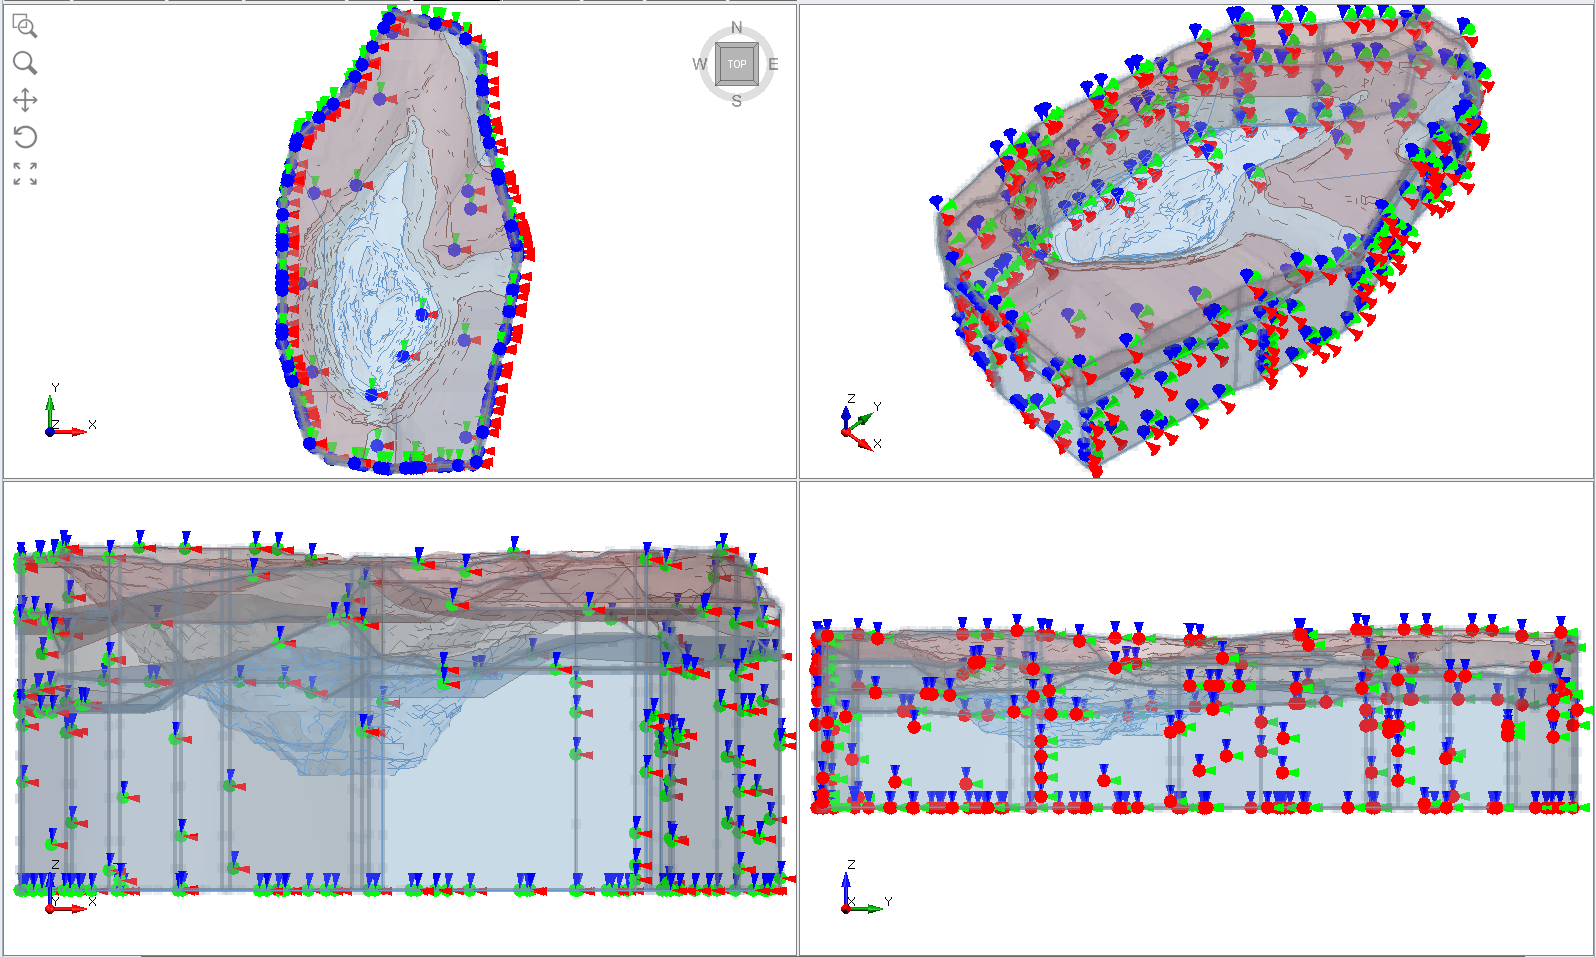
4.0 Mesh
- Navigate to the Mesh workflow tab

- Select: Mesh > Mesh Settings

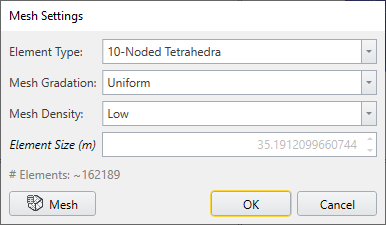
Mesh Settings Dialog - Keep the settings of:
- Element Type = 10-Noded Tetrahedra
- Mesh Gradation = Uniform
- Mesh Density = Low
- Select Mesh . You will see the following model with mesh:

5.0 Computing Results
Two options are available for this tutorial:
5.1 Compute the model
- Navigate to Compute workflow tab

- From this tab, we can compute the results of our model. First, save your model: File > Save As.
- Use the Save As dialog to save the file. Next, you need to save the compute file: File > Save Compute File. You are now ready to compute the results.
- Select: Compute > Compute

5.2 Download the model with computed results
The results can be downloaded through the link shown below to save time (highly recommended):
https://downloads.rocscience.com/RS3/Open Pit Stability Analysis-SSR.zip
6.0 Interpreting Results
- Select the Results workflow tab
 to view the failure surface on the model
 - Under the two drop down menus on legend, change the result to Total Displacement.
To compare the result to Slide failure surface model, we will import the failure surface obtained from Slide3.
- Select: Interpret > Import Slide3 Result.
- Import the file Open Pit Stability Analysis Global Min- GLE_result.slide3dresobj. You will import the failure surface obtained by Slide3 results on top of the RS3 result for comparison.
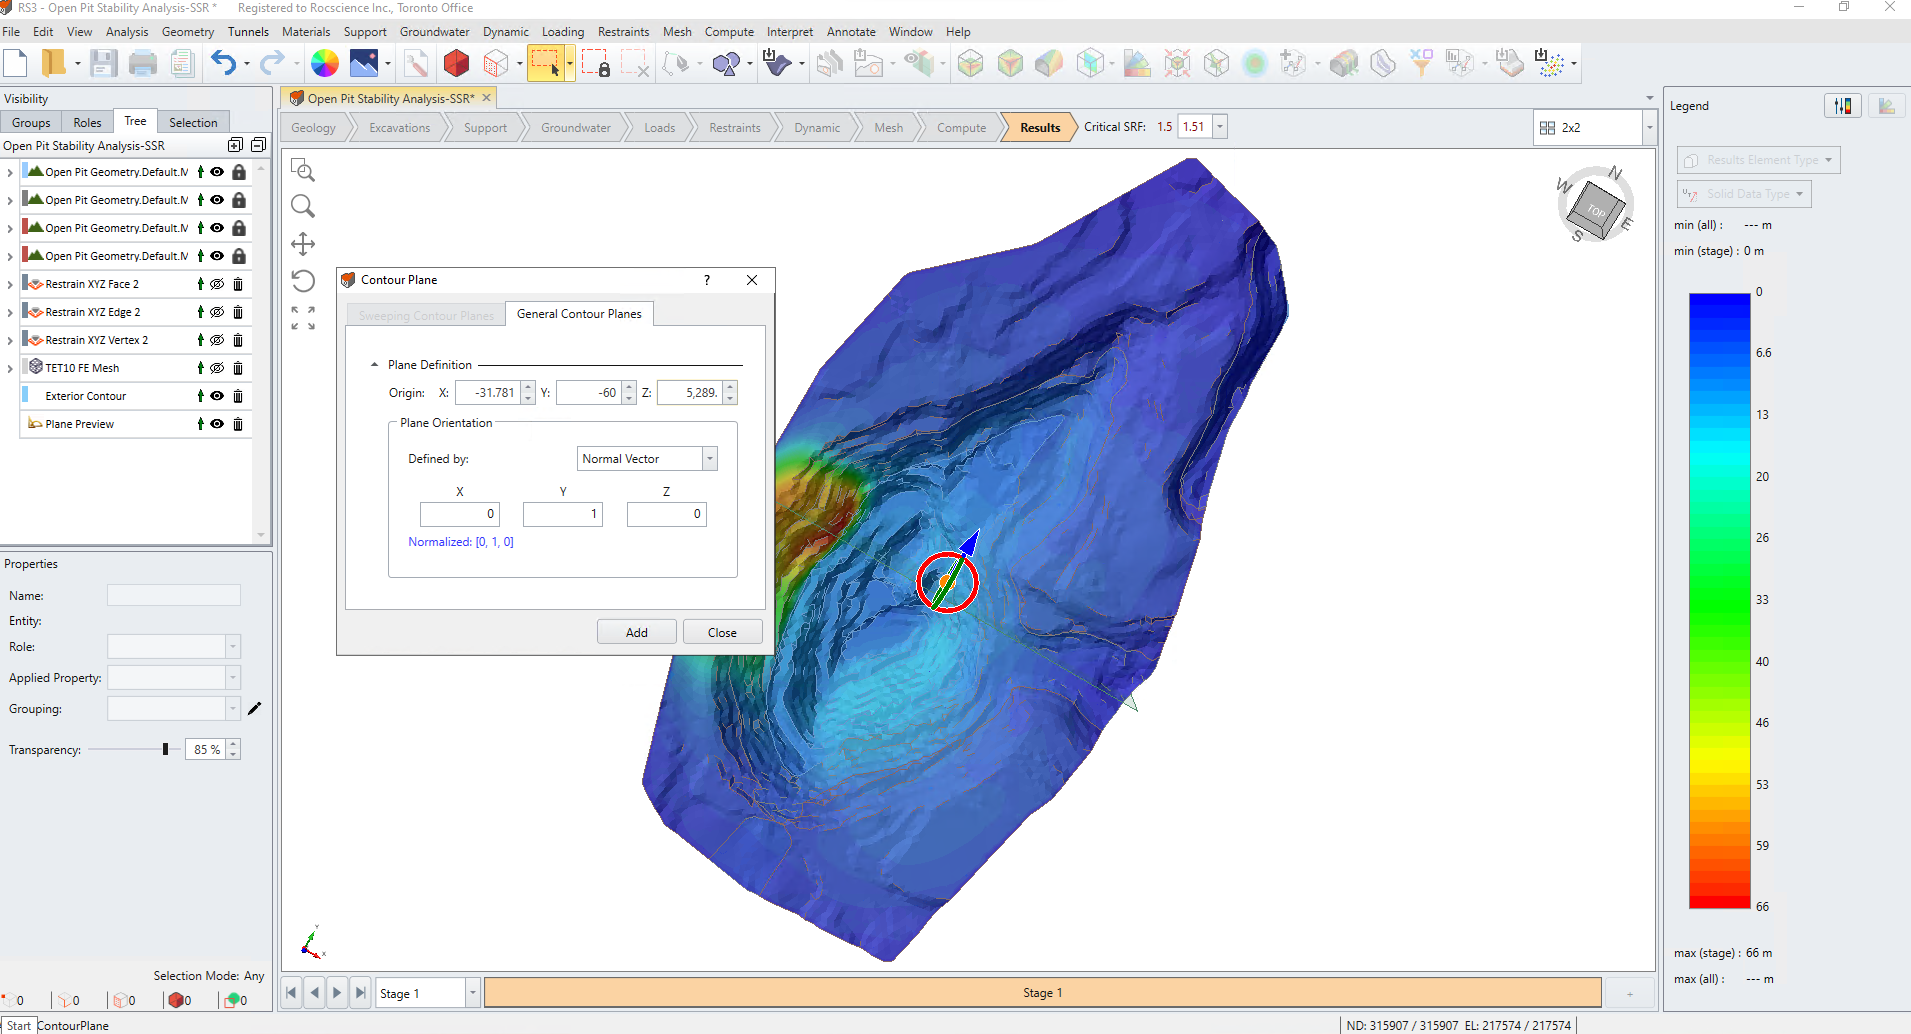
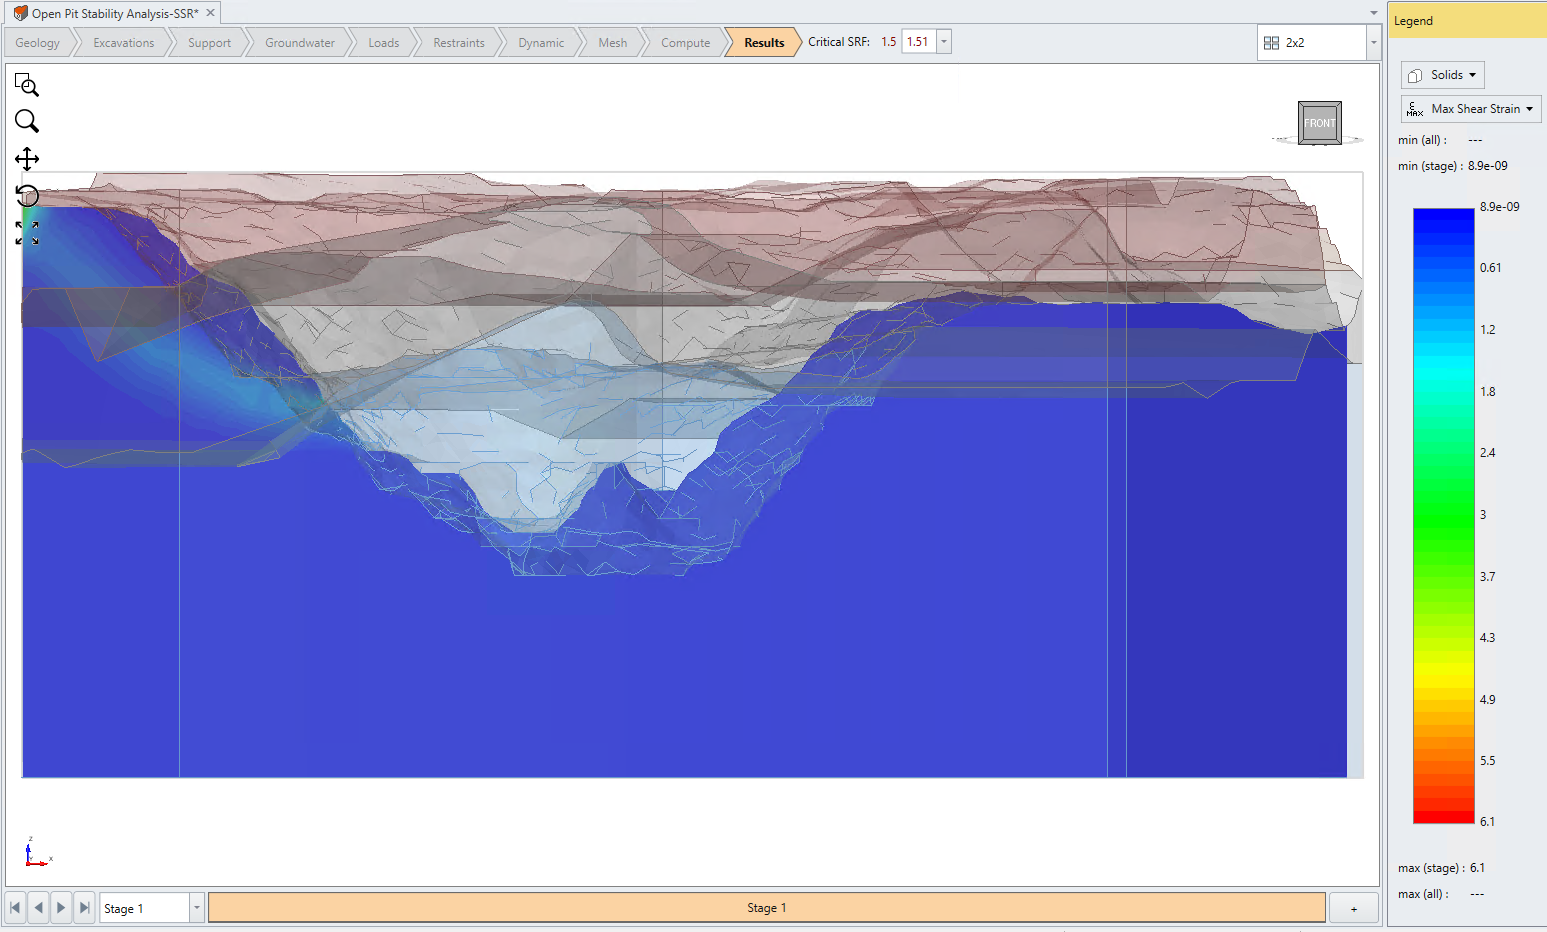
- Right beside the Results tab, you should see the Critical SRF (Strength Reduction Factor) of 1.50. Scroll down on the drop-down menu and select 1.51.
You will notice that the text colour is red after 1.50, which indicates slope failure after that specific SRF. The model should look as shown below:
Also, note that the displacement contour aligns well with the failure surface found by Slide3. This is a good indicator that the SSR method found a critical region of failure similar to Slide3.
In Slide3, the FOS is found to be 1.40 with the GLE method. The accuracy of SSR can improve if the number of mesh increases. For this tutorial, we will keep the mesh settings to this as the values are relatively within a good range for comparison.
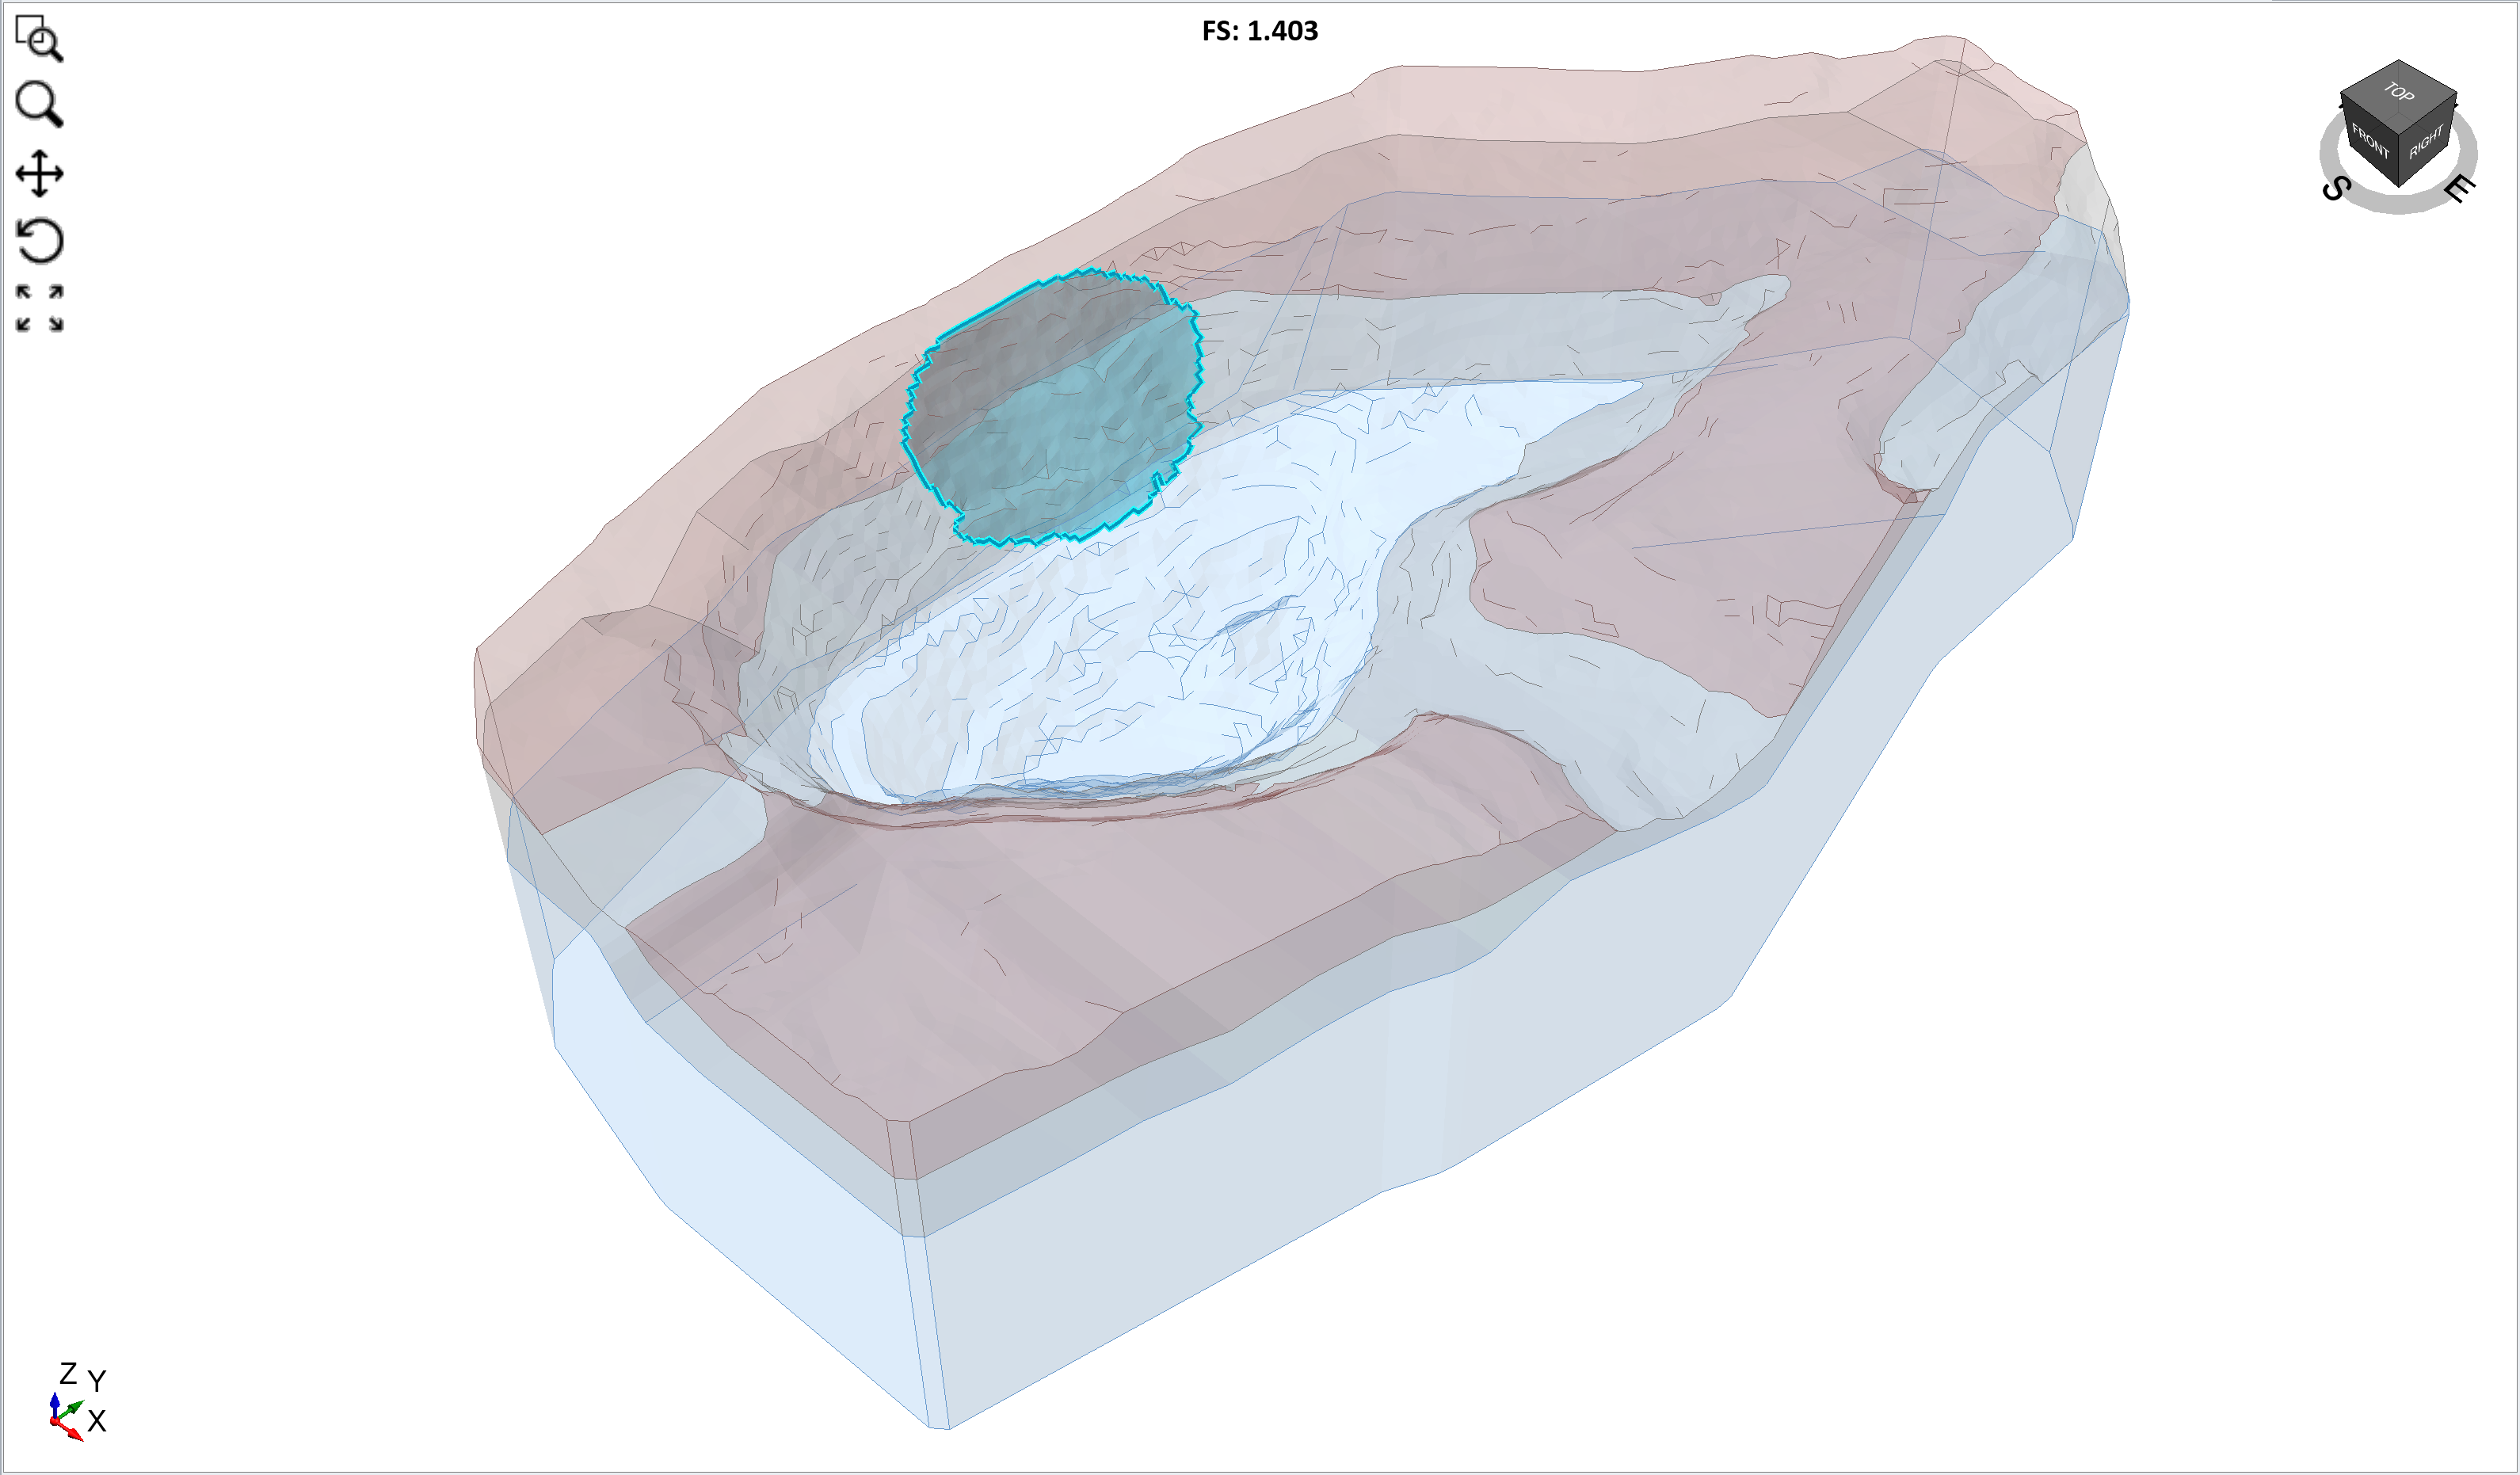
We will also look at the maximum shear strain of the model by cutting the section through the critical region of slope failure.
We can suggest a value of section to be cut through the section by the following values shown below, but you can move the section close to the failure surface.
- Select: Interpret > Show Data on Plane > XZ.
- Coordinates for Creating Plane Input:
- X = -31.781
- Y = -60
- Z = 5289
After the Contour Plane has been created, look for Exterior Contour in the visibility Tree and turn off the visibility by selecting off. Then, under the drop-down menus on legend, change the result to Solid Strain > Maximum Shear Strain. You should see the following result:
You can see from the result that the maximum shear strain of the contour plot follows the failure surface imported from Slide3.
7.0 Additional Exercise: SSR Search Region
Different SSR search regions can be added to the model. This is a useful feature where you can choose where you want to calculate the factor of safety for a specific region of interest. It can also reduce the time of computation as RS3 focuses on specific volumes for SSR analysis. We will try to apply the method to an open-pit model.
- First, save the file as Open Pit Stability Analysis_SSR_search.
- Select: Compute > Set SSR Area.
- A green box will appear which indicates the SSR area preview. We want to investigate the southeast direction of the open-pit mine. Move the vertices of the box by hovering over to each one and move the arrows to the locations similar to the one below:
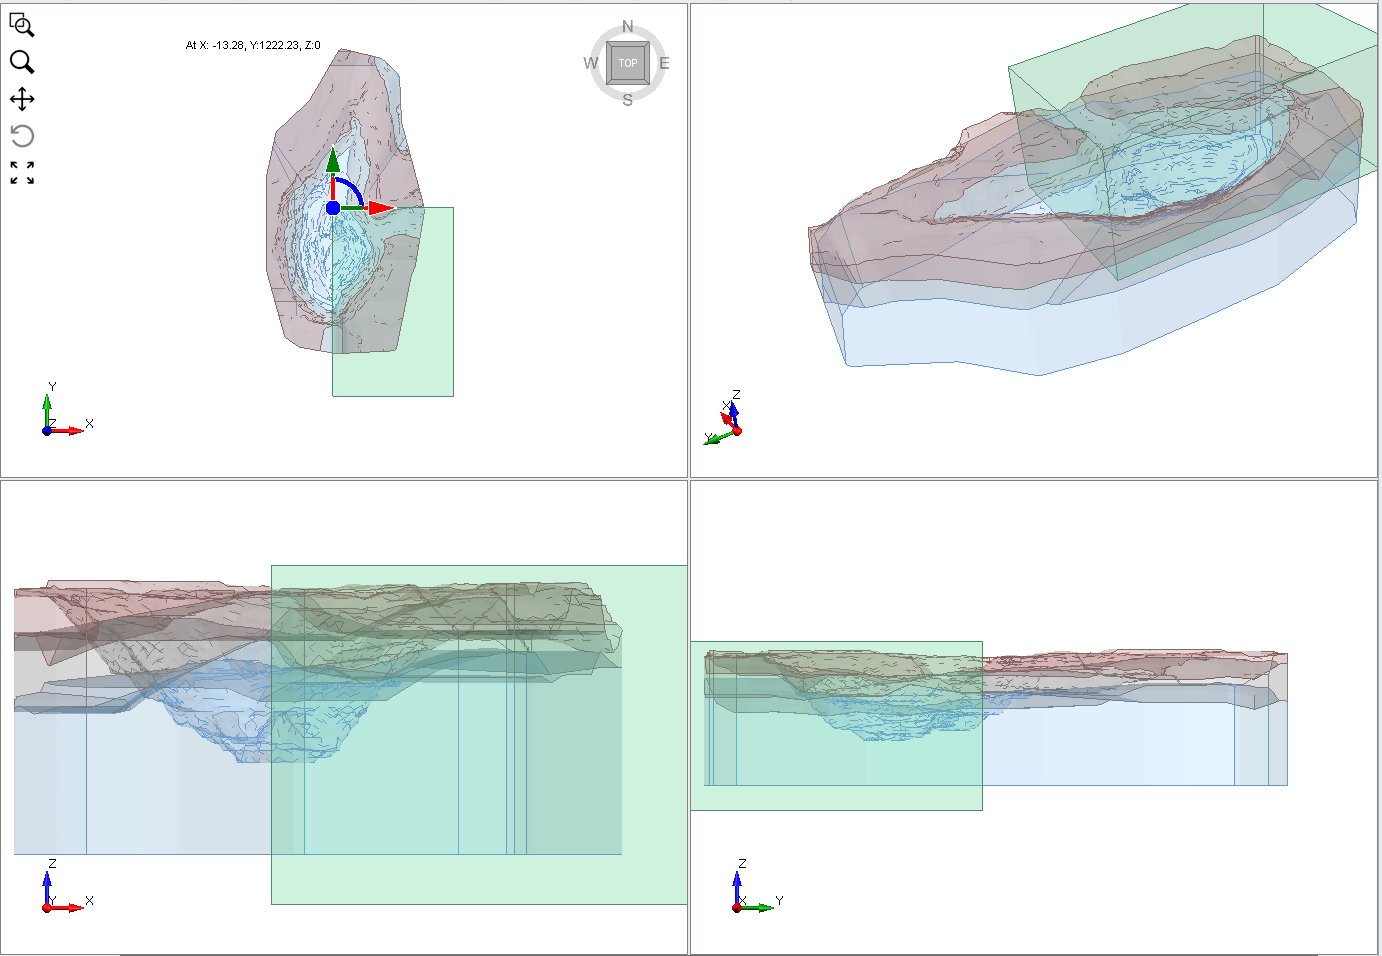
- Right-click on the modeller and select Done.
- Select: Compute > Compute.
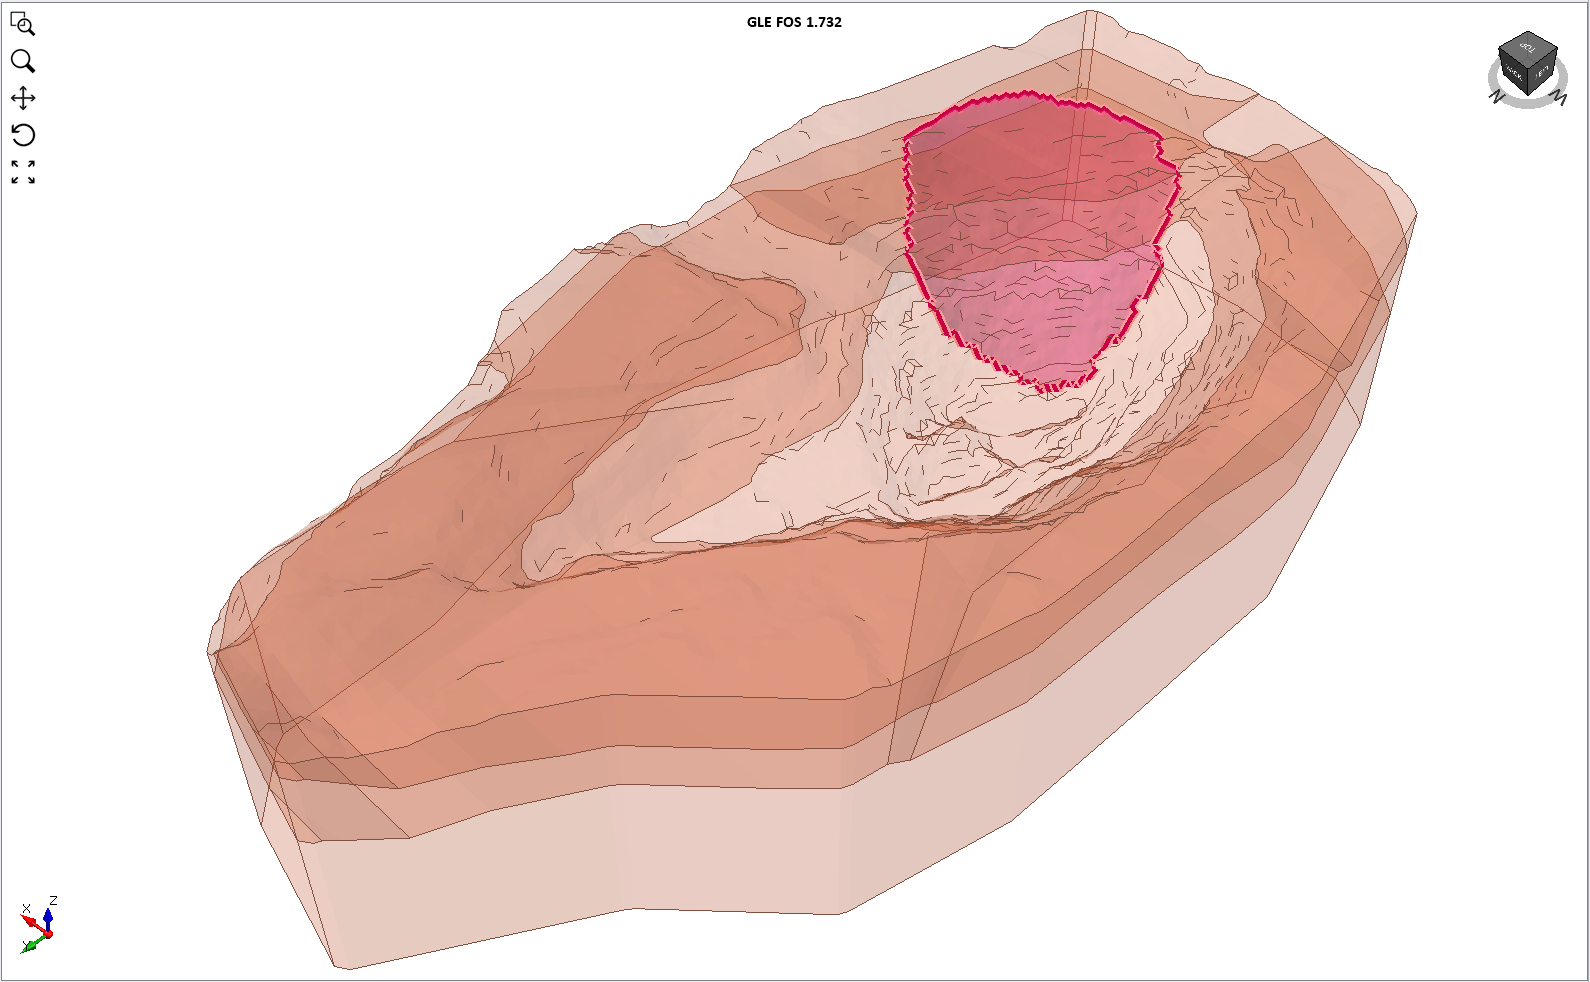
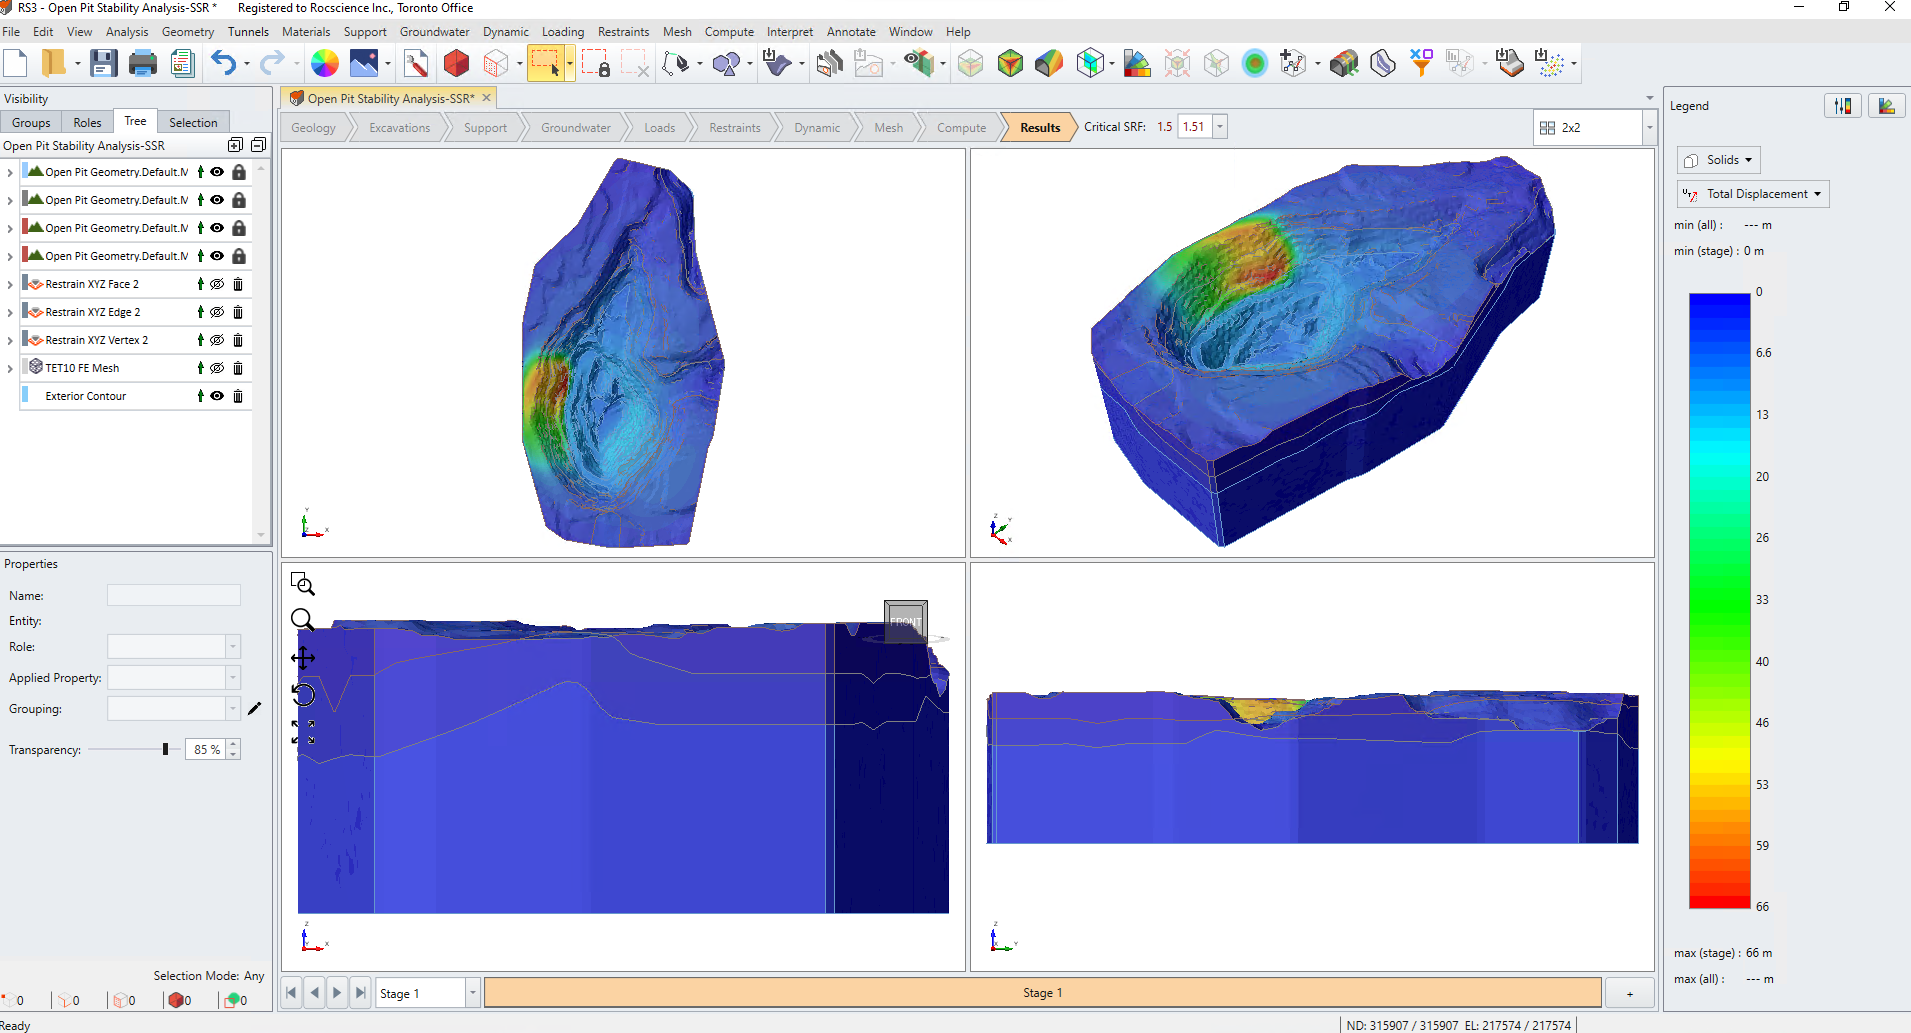
You will see a Critical SRF of around 1.7~1.8. This may vary based on the SSR search area. We will now import Slide3 results for comparison.
- Select: Interpret > Import Slide3 Result.
- Go to the following tutorial directory and Optional folder. Import the 'SSR_search- GLE_result.slide3dresobj'. You will import the failure surface obtained by Slide3 results on top of the RS3 result for comparison.
- In the visibility pane, hide every Global Min layer by toggling off the icon. At the same time, toggle on the Slide Result1 to see the following result as shown below:
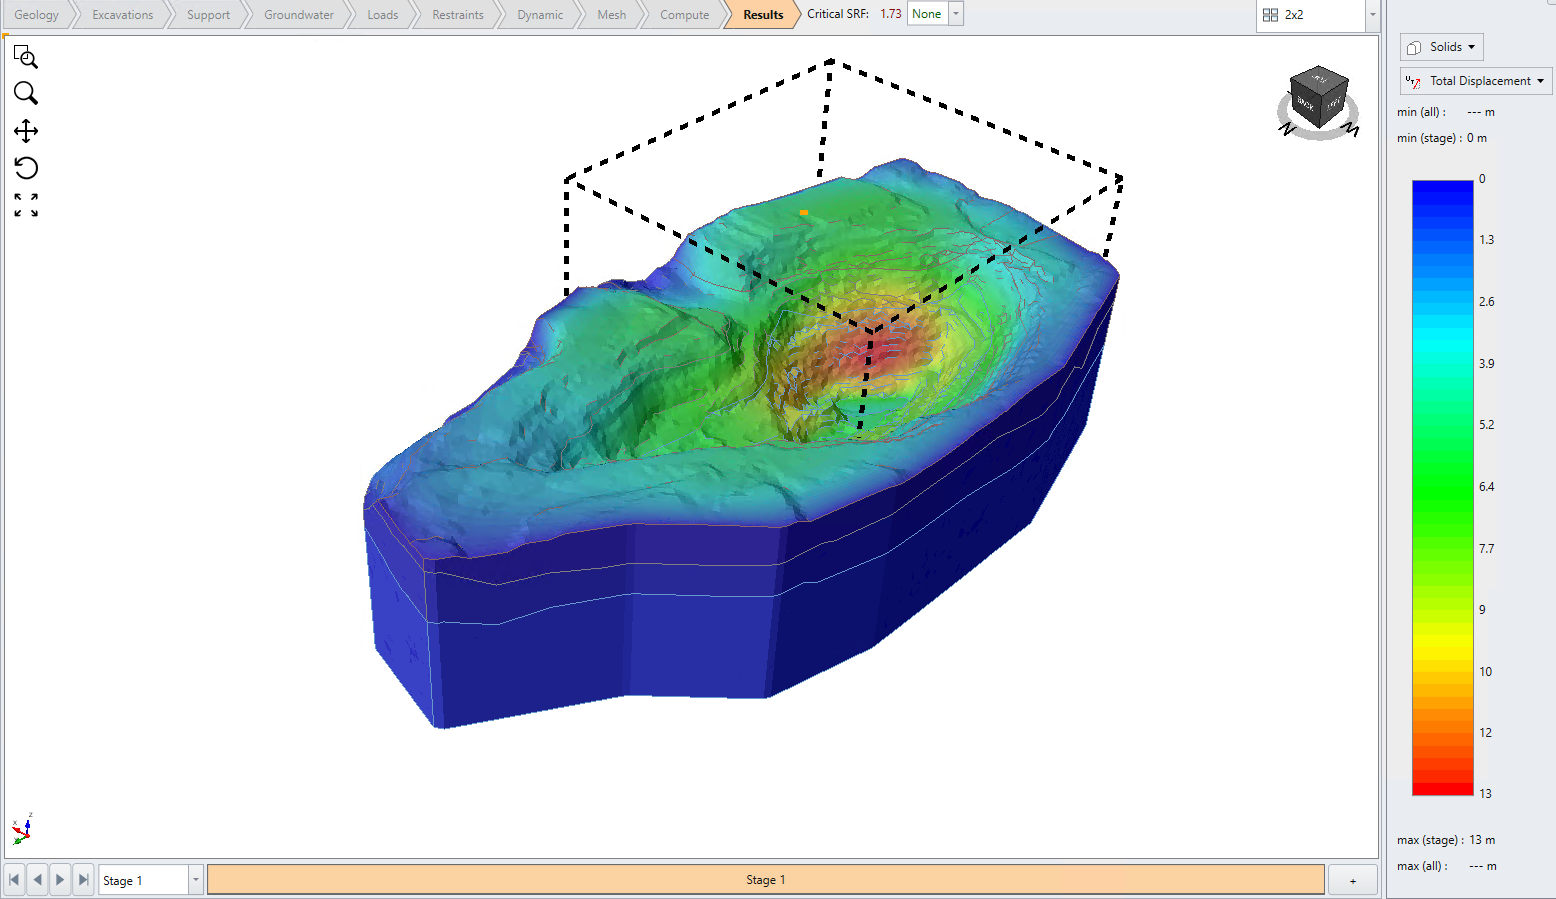
The black box indicates the SSR search region, and the contour plot shows the displacement result. As shown in the figure, the failure surface imported from Slide3 aligns with the critical region computed from RS3.
Comparing the Slide3 Open pit mine result, we can see that FOS (1.732 in Slide3) is also in good agreement.