12 - Liquefaction Analysis
1.0 Introduction
Topics Covered in this Tutorial:
- Liquefaction input data
- Liquefaction analysis options
- Graphing liquefaction results
Finished Product:
The finished product of this tutorial can be found in the Tutorial 12 Liquefaction Analysis.s3z file. All tutorial files installed with Settle3 can be accessed by selecting File > Recent Folders > Tutorials Folder from the Settle3 main menu.
2.0 Model Setup
Start the Settle3 program
2.1 Project Settings
Open the Project Settings dialog from the Analysis menu.
- Select Home > Project Settings

-
Keep the default Stress unit = Metric, stress as kPa and Settlement = Millimeters as shown.

- Select the Soil Profiles tab. Select the 'Depth below Ground surface' option.
- Click on the Liquefaction tab. Turn Liquefaction on. A dialog will pop up indicating that the Groundwater option will be turned on since it is required for liquefaction analyses. Click OK.
-
Leave the Insitu Data as Standard Penetration Test (SPT).
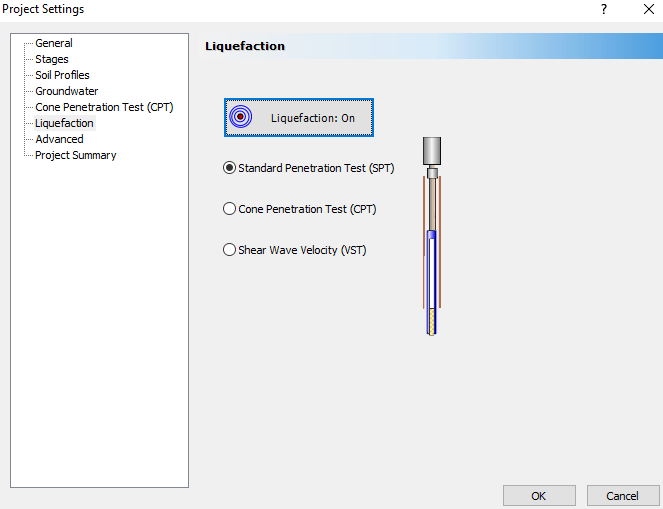
- Click OK to close the dialog.
2.2 Soil Properties & Liquefaction
A liquefaction analysis can be run independently of the total settlement analysis. In this tutorial, we will use four different materials to illustrate the graphing options, but we will keep the default material properties for each.
- Select Liquefaction > Liquefaction Options

- A dialog will pop up. Go to the Materials tab from the left-hand side.
In this tab, you can specify Fines Content (%) and D50 (mm) values. There is also a Prone to Liquefaction checkbox which indicates whether or not to include the layer in the liquefaction calculations. We will keep the default values for all layers in this tutorial. - Click OK to close the dialog.
2.3 Soil Layers
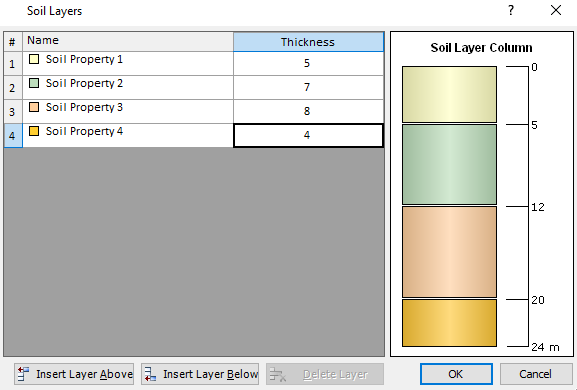
- Select Soils > Layers

- Click on Insert Layer Below three times. The layers will fill in with the correct names automatically.
- Specify the following layer thicknesses:
- Soil Property 1 = 5
- Soil Property 2 = 7
- Soil Property 3 = 8
- Soil Property 4 = 4
2.4 Groundwater Input Data
- Select Groundwater > Add Piezometric Line from the menu.
- In the dialog box that appears, set Depth (m) = 1 and click OK.
- A new dialog will appear. Select Soil Property 1.
- For Piezo to use, select 1 from the drop down list.
- Click Apply To All to apply the piezo selection to all soil properties.
- Click OK to close the dialog.

3.0 Liquefaction Analysis
Now that we have defined the soil strata we will enter the input required for the liquefaction analysis.
3.1 Input Data
- Select Liquefaction > Liquefaction Options from the menu and the Liquefaction Options dialog will pop up. This dialog is tailored to the Insitu Data type selected in the Project Settings.
- In the General tab, we will use the default earthquake data:
- Max. Earthquake Acceleration = 0.5g
- Earthquake Magnitude = 7.5
- Slope Angle = 0 degrees

Depth (m) |
SPT (N) |
Depth (m) |
SPT (N) |
0.5 |
5 |
12.5 |
30 |
1 |
8 |
13 |
27 |
1.5 |
12 |
13.5 |
23 |
2 |
10 |
14 |
25 |
2.5 |
13 |
14.5 |
27 |
3 |
15 |
15 |
28 |
3.5 |
20 |
15.5 |
33 |
4 |
28 |
16 |
35 |
4.5 |
32 |
16.5 |
37 |
5 |
30 |
17 |
34 |
5.5 |
30 |
17.5 |
31 |
6 |
25 |
18 |
35 |
6.5 |
26 |
18.5 |
30 |
7 |
24 |
19 |
33 |
7.5 |
22 |
19.5 |
36 |
8 |
25 |
20 |
38 |
8.5 |
26 |
20.5 |
40 |
9 |
22 |
21 |
36 |
9.5 |
25 |
21.5 |
40 |
10 |
25 |
22 |
35 |
10.5 |
27 |
22.5 |
42 |
11 |
28 |
23 |
37 |
11.5 |
30 |
23.5 |
40 |
12 |
35 |
24 |
45 |
The dialog should appear as below:

In the Depth Correction tab you specify the sampling method used as well as the depth correction method to use.
Correction factors are also provided for Borehole Diameter (Cb) and Hammer Energy Ratio (Ce). Click on the icons beside each factor and a dialog of typical values for each factor will pop up.
If you select Use Cetin et al. (Cr), the Rod Length Above Ground input will be greyed out.

- Magnitude Scaling Factor (MSF) = None
- Stress Reduction Factor (Rd) = Cetin et al. (2018)
- Relative Density Estimation from SPT (Dr) = Skempton (1986)
- Fines Content Correction = None
- K Sigma = Cetin et al. (2018)
- K Alpha = None
- Vs 12m = 160 m/s

3.2 Liquefaction Analysis Options
- Select Liquefaction > Analysis Options from the menu.
- In the dialog that pops up, you will select the Triggering, Settlement, and Lateral Displacement calculation methods. It can be useful to use the Select All option for each of these since in the liquefaction graph you can hide any of the analysis options that you don’t want to see.
- Click Select All for all three, and click OK to close the dialog.
3.3 Graphing Liquefaction Data
In Settle3 you need to insert a Query Point in order to be able to carry out liquefaction analyses.
- Select Query > Add Point

- For Number of Vertical Points keep the default choice of Automatic selected.
- Click OK to close the dialog.
- Click anywhere in the center of the screen to insert the query point.
- Right-click on the query and select Graph Liquefaction. The Plot Liquefaction dialog will appear.
- Keep the default settings, but notice that you can choose to plot liquefaction for more than one stage.
- Click OK to graph the liquefaction results.
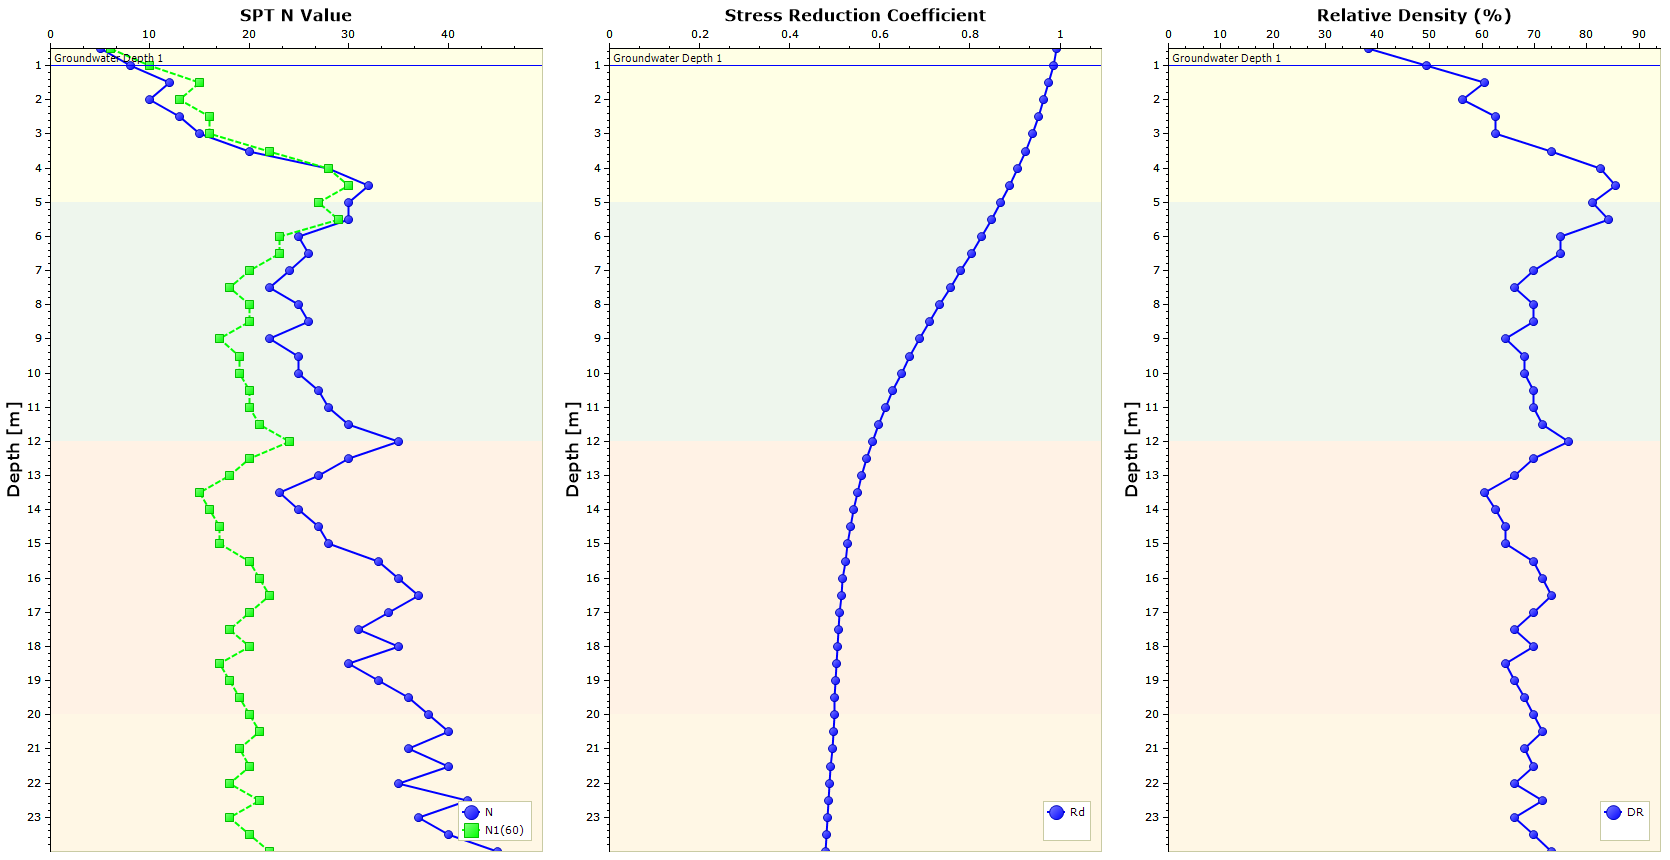
Another window will open with the liquefaction analysis results. There will be three tabs: Data, Triggering, and Post Triggering. Each of these tabs has three graphs. The graphs are all fully customizable. On the right side of the tab is Chart Controls, where all the customization options are located.
In the Chart Options section of Chart Controls notice the Show Soil Layers checkbox. When this is selected, the soil layers are displayed behind the plotted results.
In the Data tab, the SPT N Value, Stress Reduction Coefficient, and Relative Density (%) are graphed.
Click on the Triggering tab to view graphs of CSR and CRR, Factor of Safety, and Probability of Liquefaction.
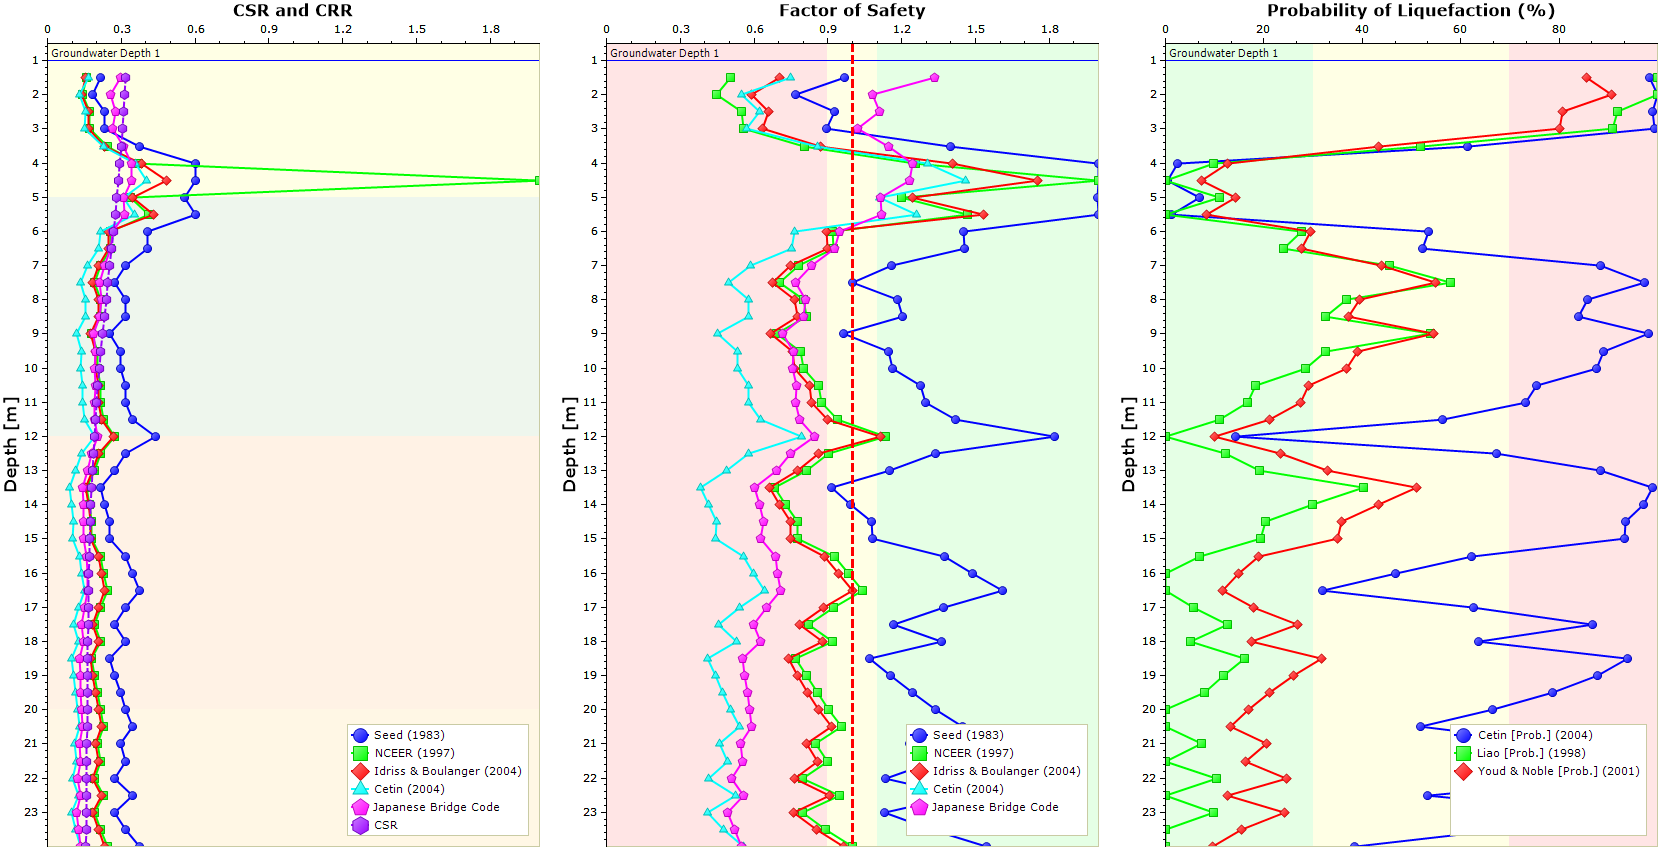
When you open the Triggering tab, the Triggering Series options in Chart Controls appear.
First look at the Factor of Safety Value (default value = 1) and the red dotted line that is drawn on the Factor of Safety graph. Change the Factor of Safety to 0.8 and notice that the dotted line moves to that value. Set the Factor of Safety to 1. The next option, Factor of Safety Threshold, is used to draw the Factor of Safety Bands. The Factor of Safety Bands extends from (Factor of Safety Value – Factor of Safety Threshold) to (Factor of Safety Value + Factor of Safety Threshold). Change the Factor of Safety Threshold a few times to see what happens.
Looking at the Probability of Liquefaction (%) graph, you have the option to turn on/off the Probability of Liquefaction Bands. By default, these bands are turned on, and Probability of Liquefaction Upper Limit = 70% while Probability of Liquefaction Lower Limit = 30%. You can change these values, but we will keep the default values in this tutorial.
The remainder of the options in the Triggering Series section of Chart Controls are for the different calculation methods.
Click on the Post Triggering tab to view graphs of Max Shear Strain (%), Lateral Displacement Index (cm), and Settlement (cm).

The Post Liquefaction Series display options are now shown in Chart Controls.
The first option is the Method to Calculate Post Liquefaction Parameters. Click on the currently used option Seed (1983) to open the dropdown menu. A total of five methods are available.
The rest of the options are checkboxes which control the plotted calculation methods.
This concludes the Liquefaction Tutorial.
4.0 Additional Exercise
In this tutorial, we examined liquefaction without any load. Add a load, and observe the effect it has on the analysis results.
5.0 References
Idriss, I.M., and Boulanger, R.W. 2008 Soil Liquefaction During Earthquakes. EERI.