Strength Graphs
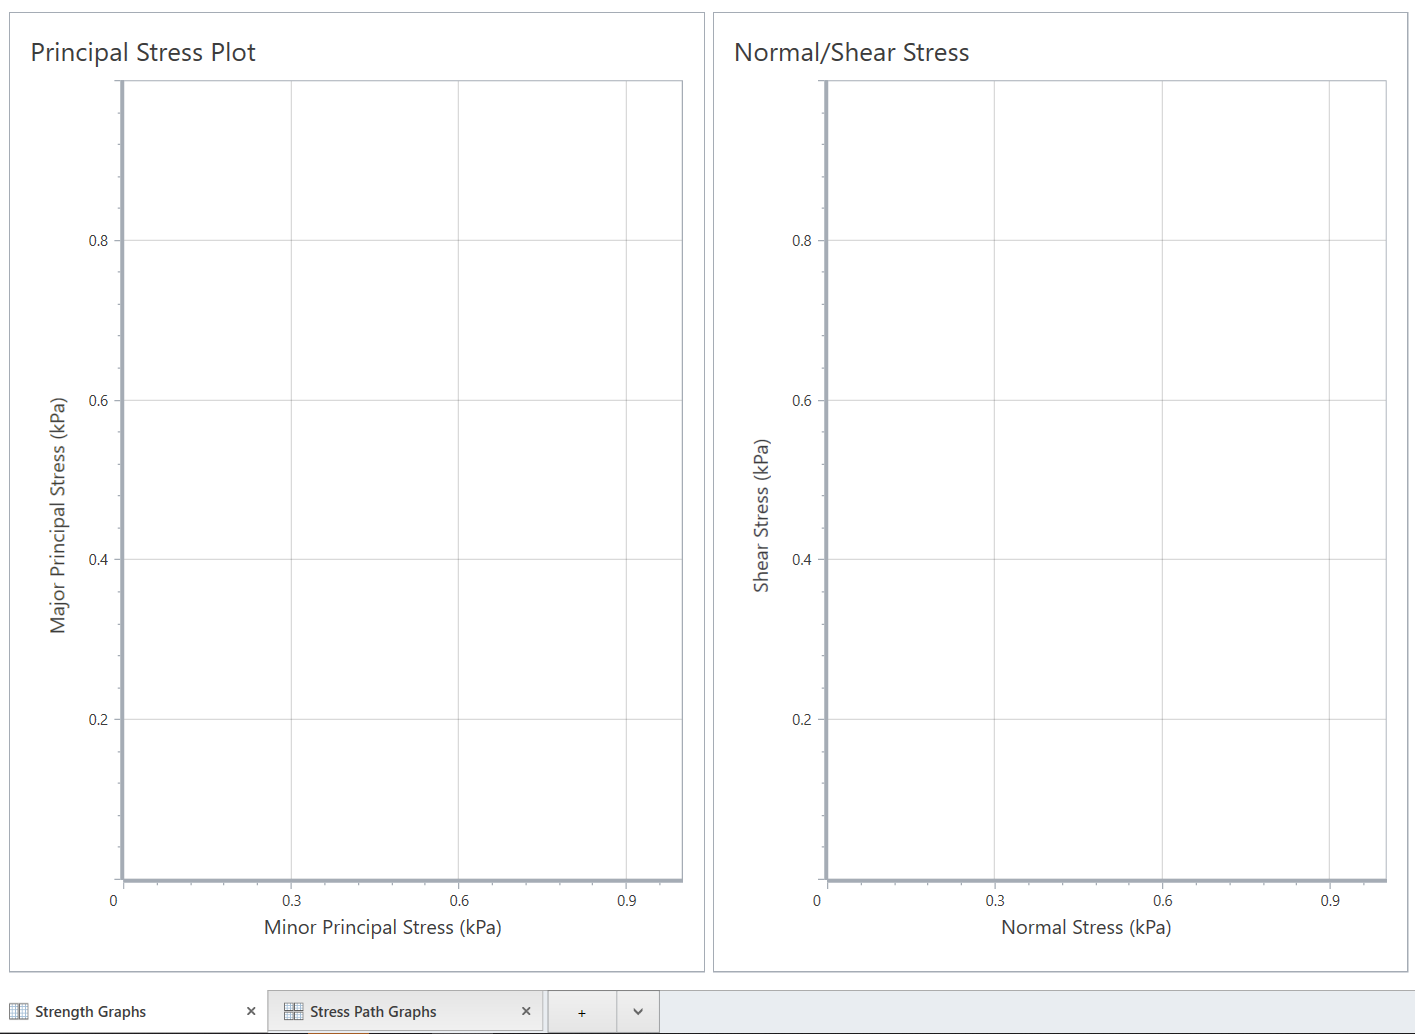
Strength graphs allows you to see the principal stress and Normal/Shear Stress plot as shown below:
The principal stress plot shows major principal stress and minor principal stresses, whereas normal/shear stress graph shows shear stress and normal stresses for the axis. Below shows an example of the two graphs updated with Mohr-Coulomb and generlized Hoek-brown models.
