This tutorial will demonstrate the Crest Loss option in RocFall2. Crest Loss allows you to account for the loss of bench width that occurs when material is lost at the crest of slope benches due to localized failure. Statistical input allows you to account for the random nature of the bench failure.
Topics Covered in this Tutorial:
Defining Crest Loss
Statistical Distributions
Animating paths
Crest Loss display
Finished Product
The finished product of this tutorial can be found in the Tutorial 06 Crest Loss data file. All tutorial files installed with RocFall2 can be accessed by selecting File > Recent Folders > Tutorials Folder from the RocFall2 main menu.
2.0 Model
Let's start by opening the file for the tutorial:
Select: File > Recent Folders > Tutorials Folder and open the Tutorial 06 initial file.
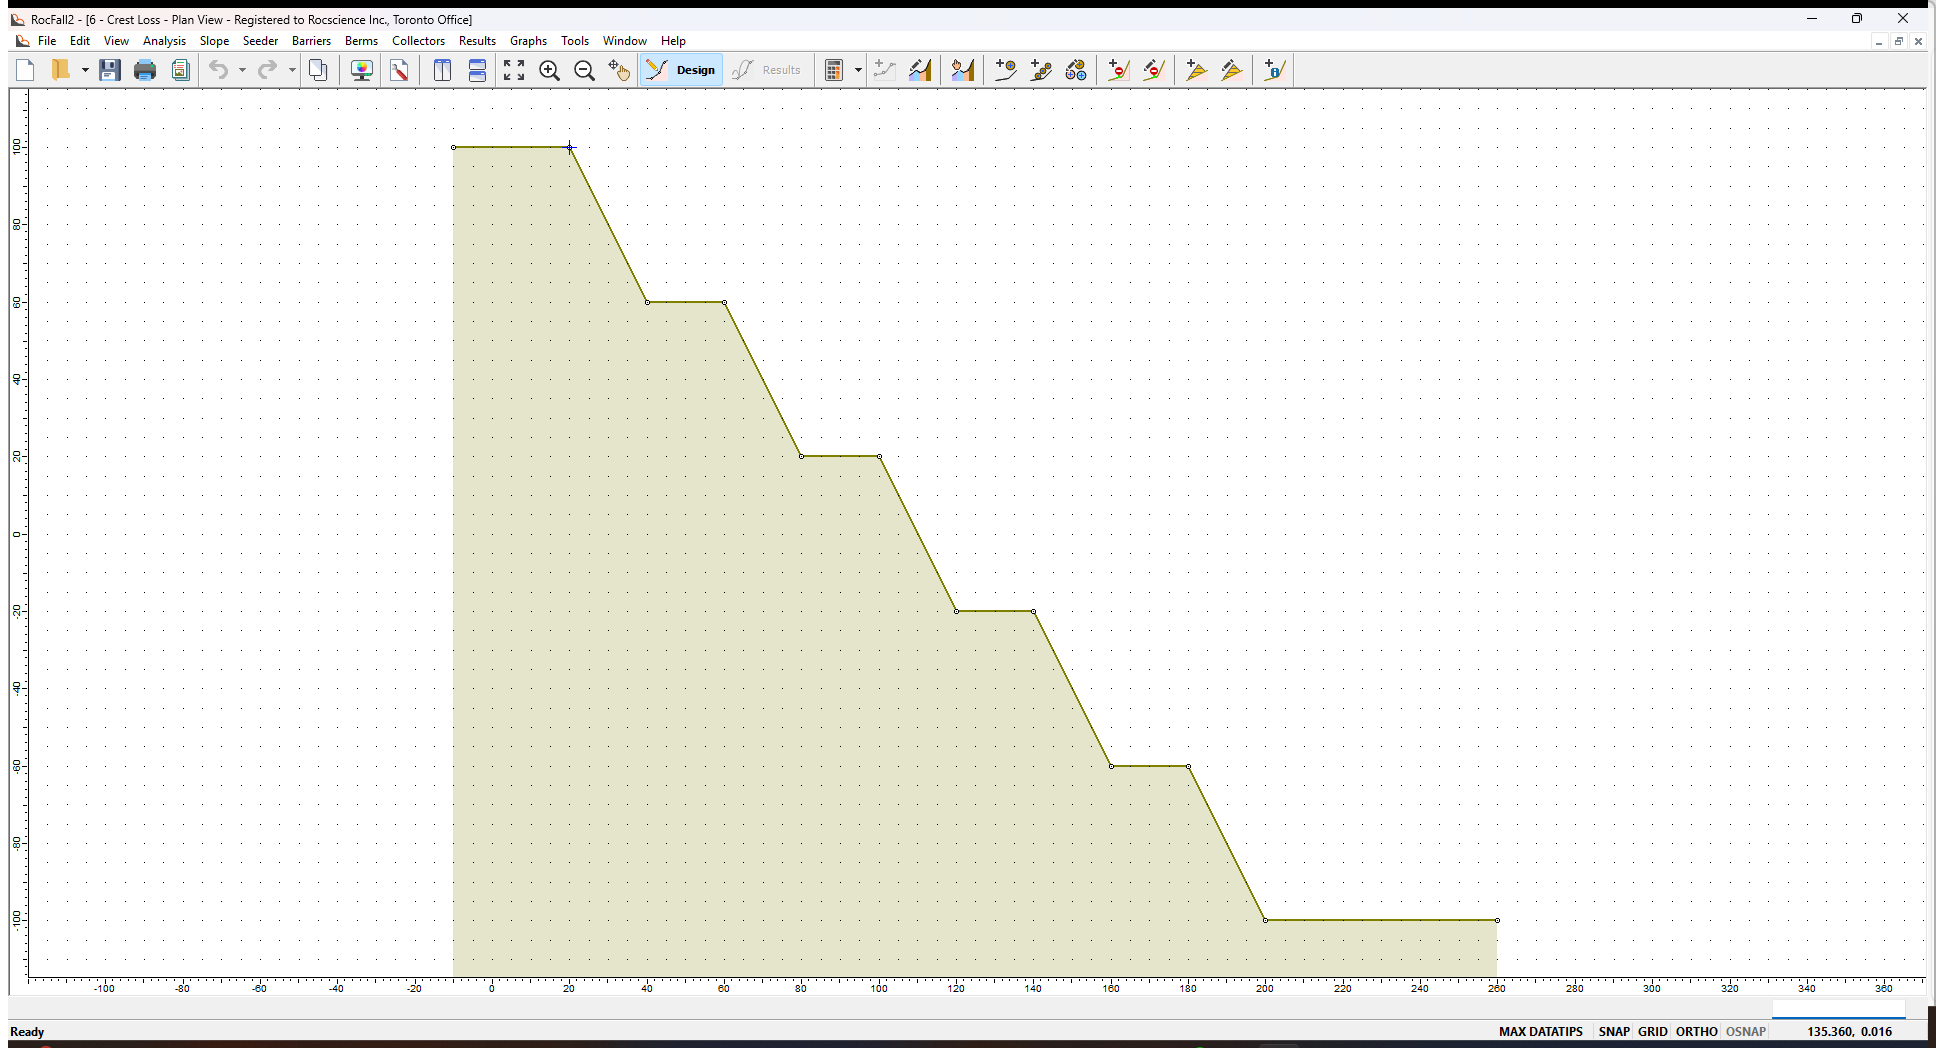
You should see the following model.
Initial RocFall2 model
This model already has all slope properties defined except for the Crest Loss:
There is one point seeder defined at the top of the crest of the slope
We are using Rigid Body analysis with rounded rock shapes
Number of Rocks = 250 rocks
3.0 Results
Now we'll Compute and see results without Crest Loss.
Click the Compute button from the toolbar or the Analysis menu.
RocFall2 Results view without crest loss
For this model, the rocks travel down the first bench face and all rocks come to rest on the first bench below the seeder. Zoom in to better view the rock paths.
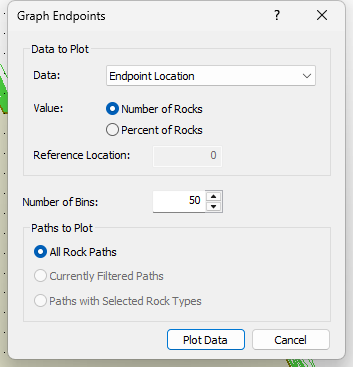
3.1 GRAPH ENDPOINTS
Next we'll generate an Endpoints graph of results.
Select Graph Endpointson the toolbar or the Graphs menu. The Graph Endpoints dialog should appear.
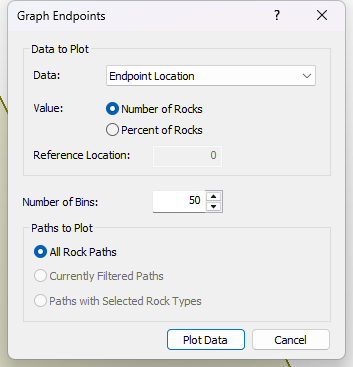
Set Data = Endpoint Location.
Set Value = Number of Rocks.
Set Number of Bins = 50.
Set Paths to Plot = All Rock Paths.Graph Endpoints dialog
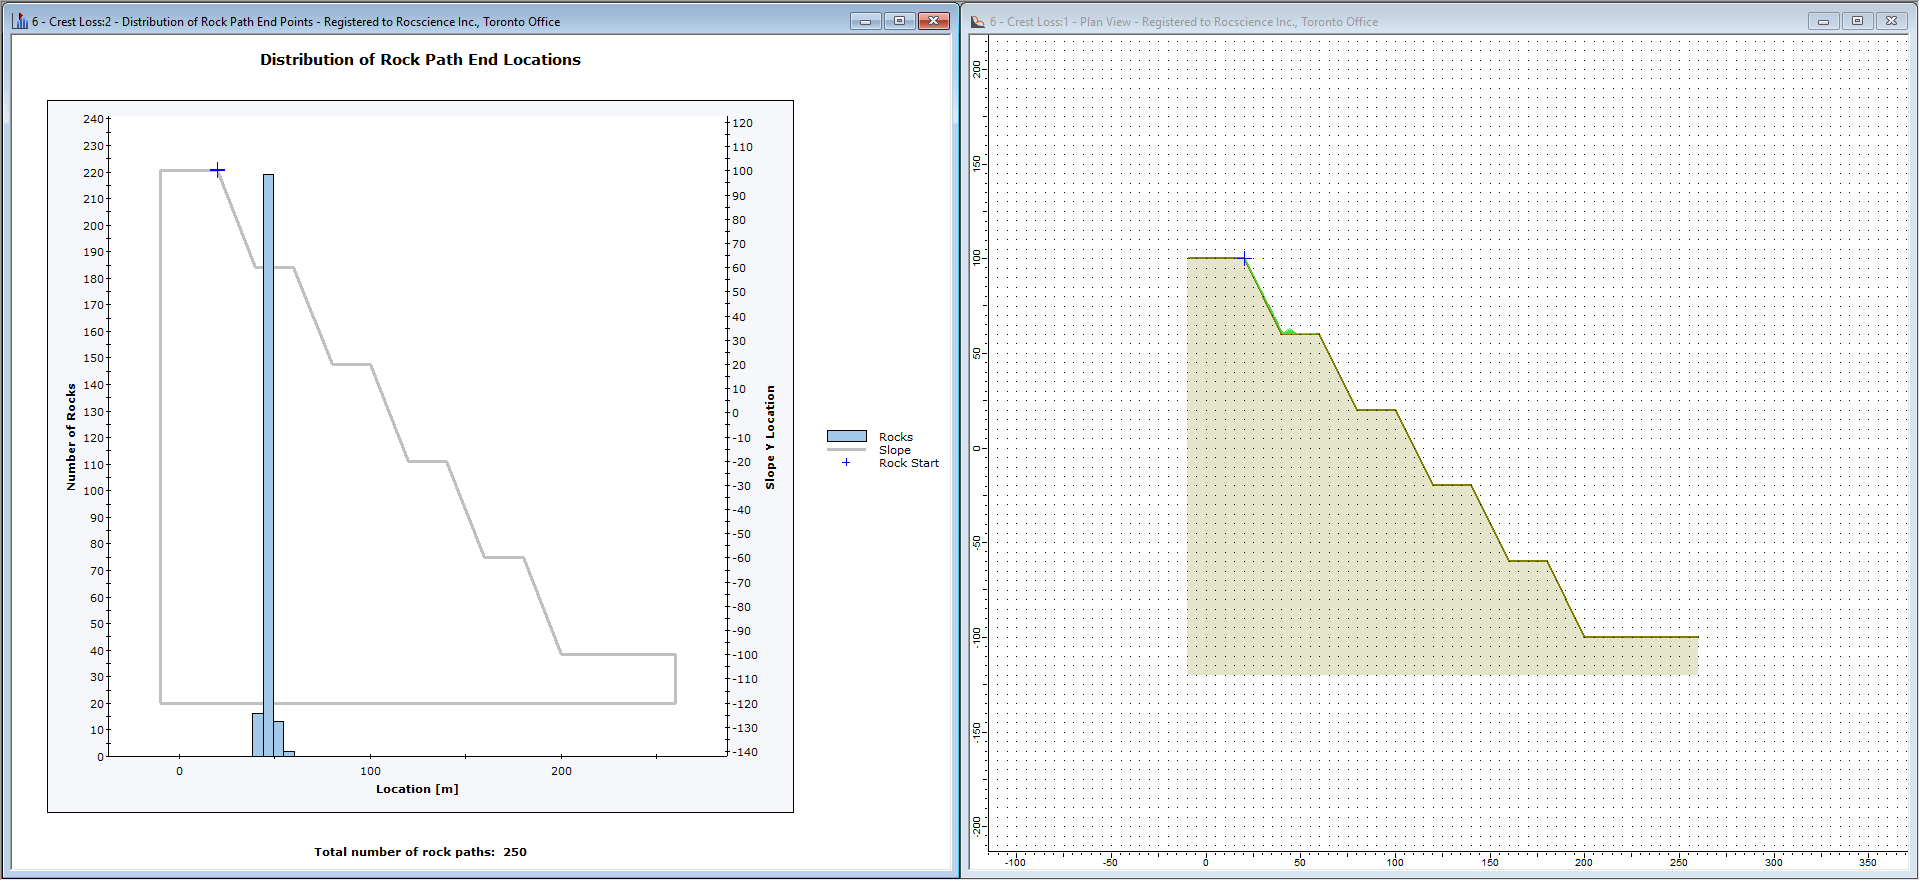
Select Plot Data to generate the Distribution of Rock Path End Locations graph.
Select Tile Vertically on the Window menu to see both views at once.
As you can see all rocks stop on the first bench.
4.0 Crest Loss
Now we will apply the Crest Loss option and re-run the analysis.
Close the Endpoints graph and maximize the slope view.
Select Designon the toolbar to switch back to Design mode.
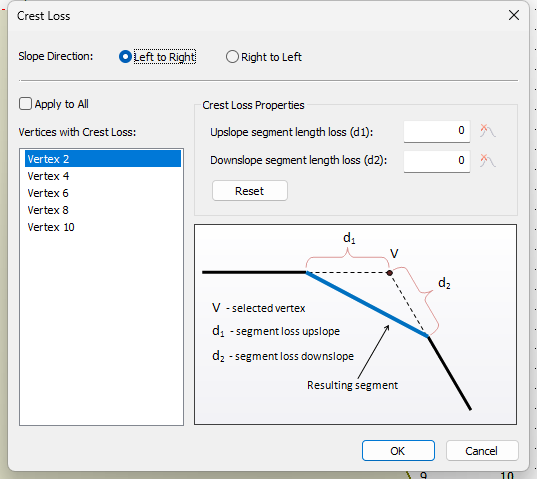
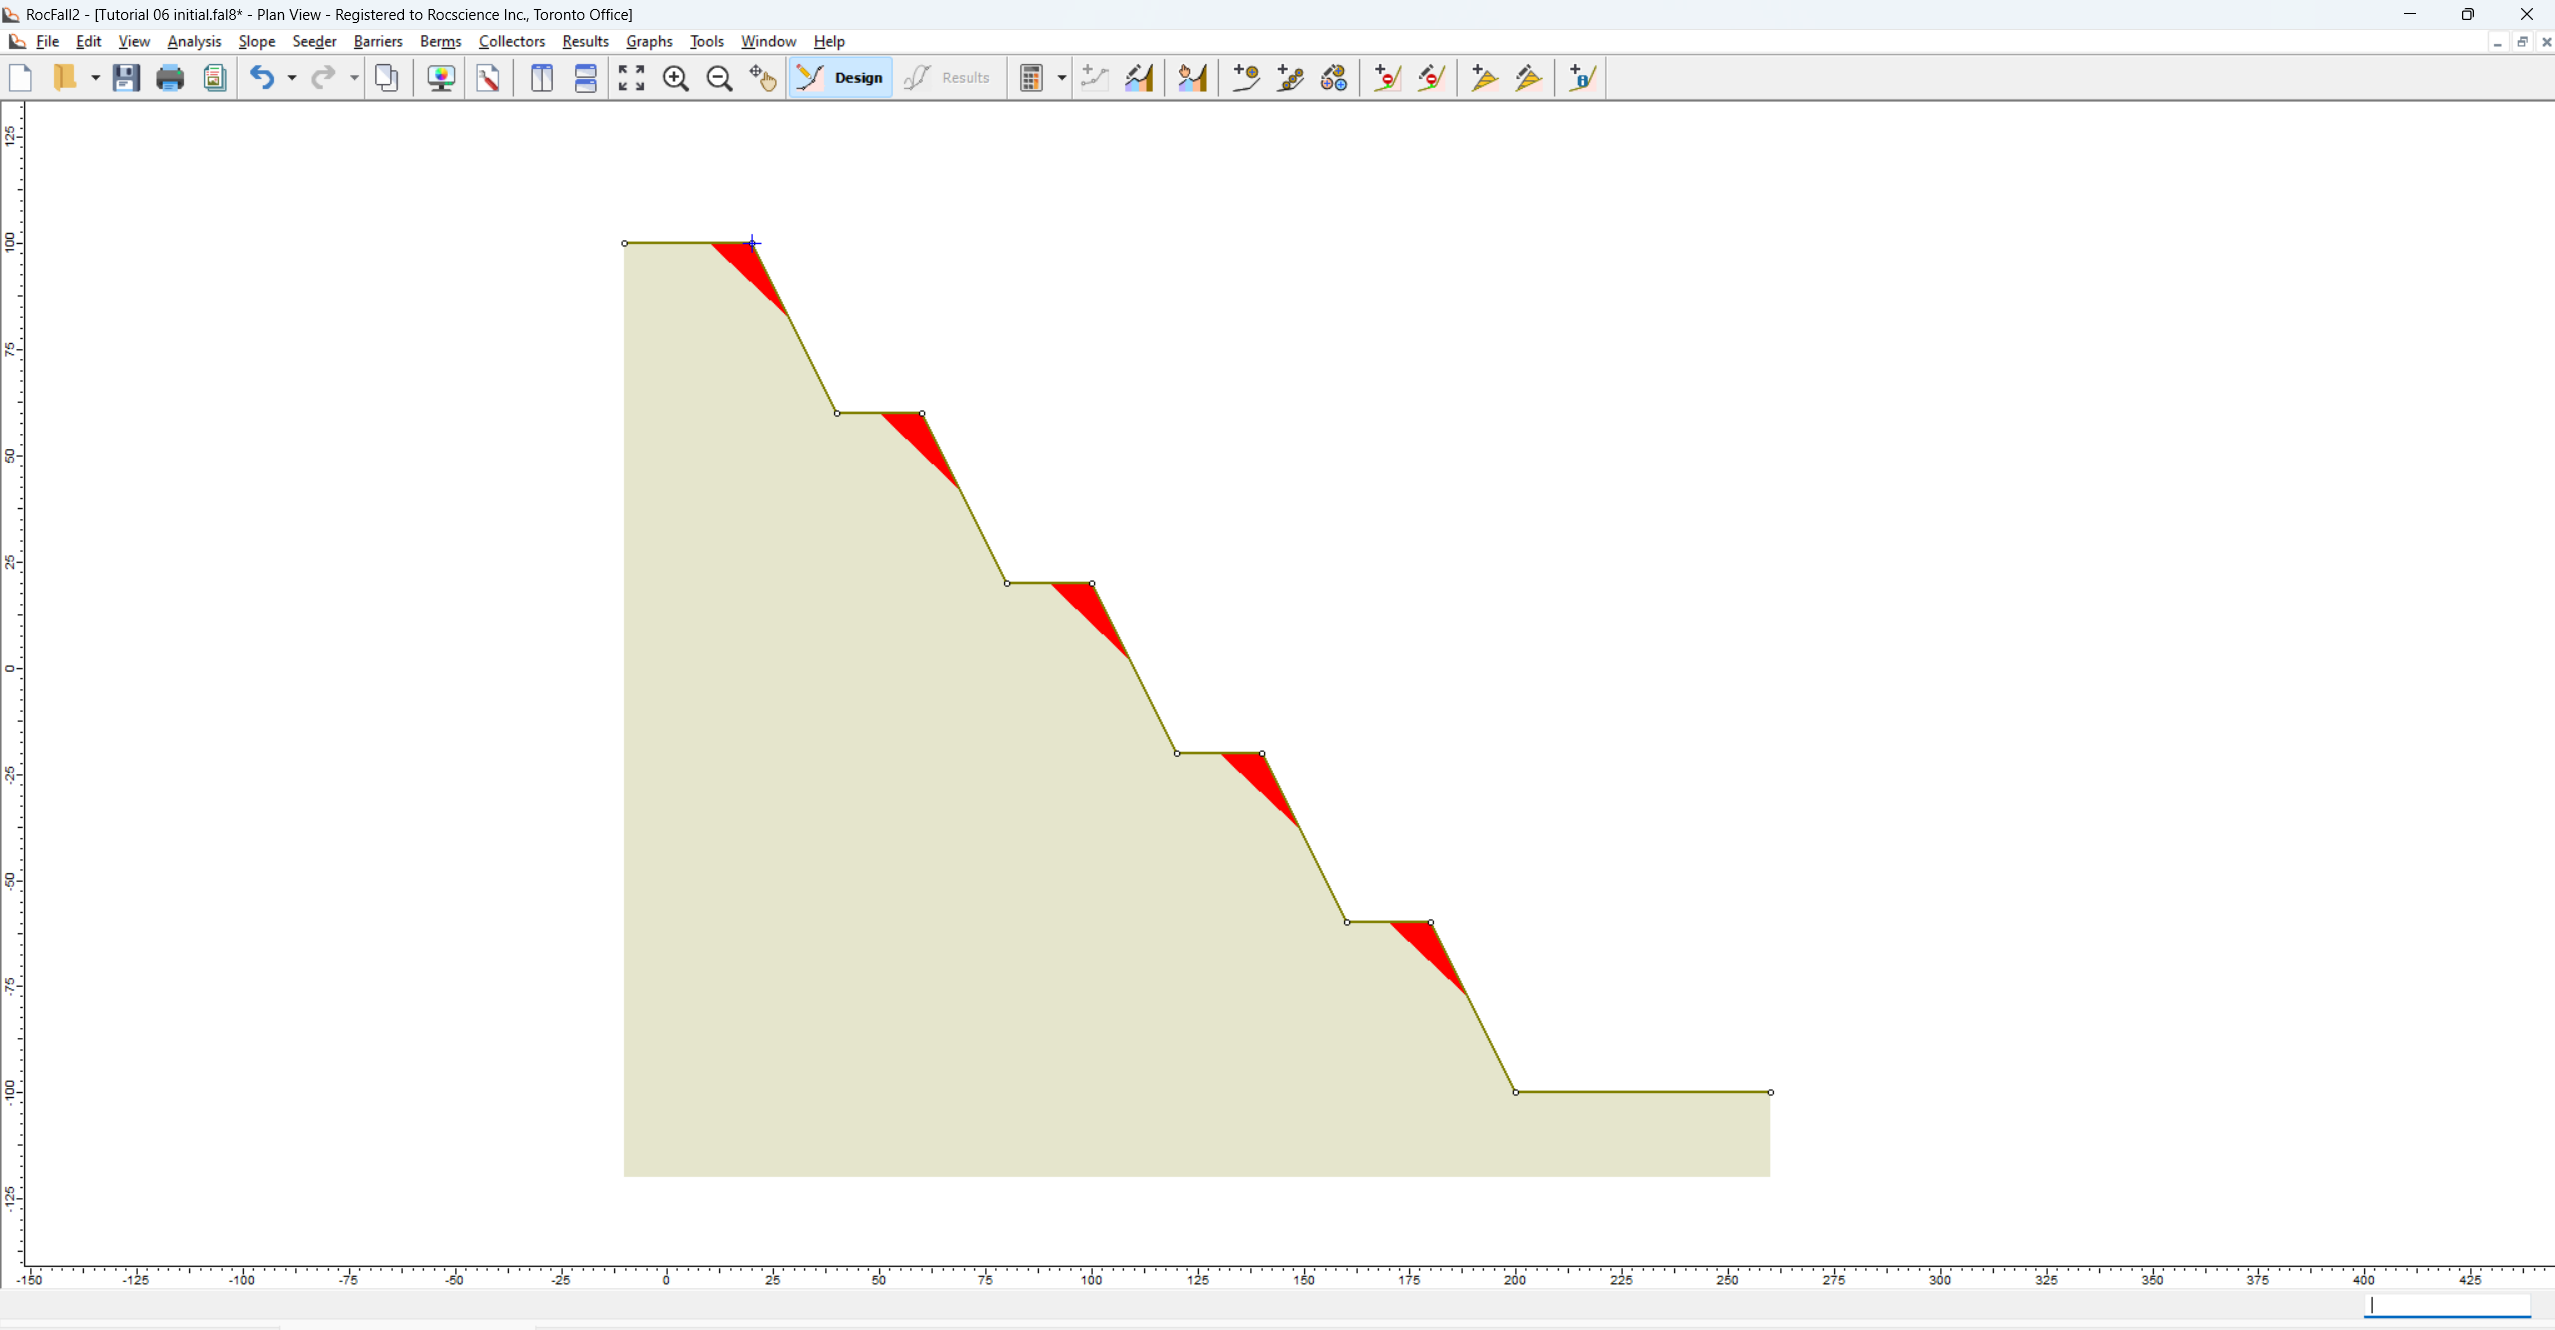
Select Crest Loss on the Slope menu. You will be prompted to select vertices. Crest Loss is applied to crest vertices of a slope.
Use the mouse to select the FIVE crest vertices of the benched slope as shown below. RocFall2 Design view while selecting slope crest vertices for modeling crest loss
Right-click and select Done Selection. The Crest Loss dialog appears. Crest Loss Dialog
NOTES:
As illustrated in the dialog, notice how Crest Loss is defined in RocFall2 – by defining a length loss on the bench (upslope) and on the bench face (downslope). Statistics can be applied to both length variables.
You can define crest loss independently for each selected vertex. However for this tutorial we will apply the same statistical input for all selected vertices.
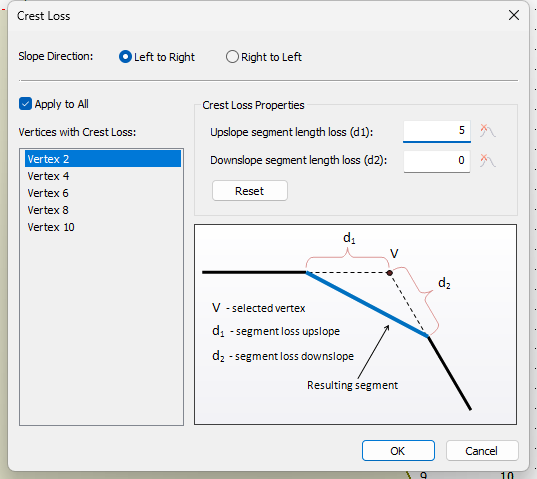
Select the Apply to All check box in the bottom-left of the dialog.
Set Upslope segment length loss (d1) = 5.
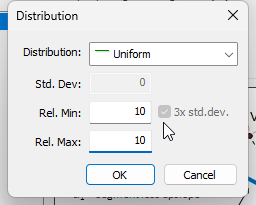
Click the Distribution button and set:
Distribution = Uniform
Rel. Min: = 5
Rel. Max: = 5 Crest Loss Distribution dialog
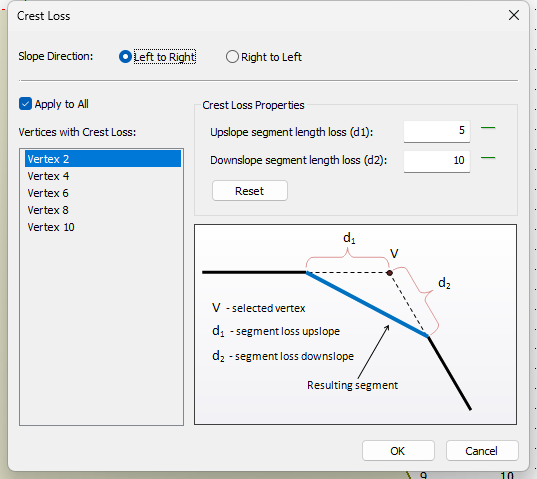
Set Downslope segment length loss (d2) = 10.
Click the Distribution button and set:
Distribution = Uniform
Rel. Min: = 10
Rel. Max: = 10
Click OK to save the changes and close the dialog.
Save the file with a new name.
4.1 CREST LOSS DISPLAY OPTIONS
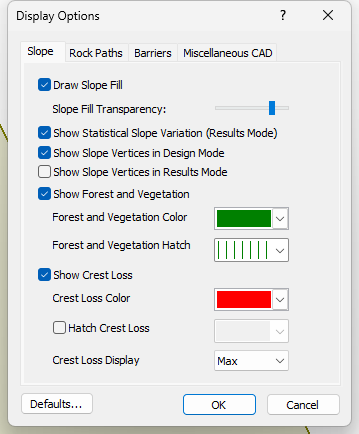
When you define Crest Loss, the input is automatically displayed on the model with highlighting using colour and/or hatch patterns. You can customize the crest loss display in the Display Options dialog.
Right-click the model and select Display Options .
Make sure Crest Loss Display = Max. Display Options dialog
This will display the maximum possible extent of the Crest Loss according to the maximum values you have defined for your statistical distributions. In this case, the Maximum Crest Loss corresponds to 5 + 5 = 10 meters on the bench and 10 + 10 = 20 meters on the bench face. The Crest Loss display (red highlights) should appear as follows:
5.0 Results
Now let's run the analysis.
Select the Compute button from the toolbar or the Analysis menu.
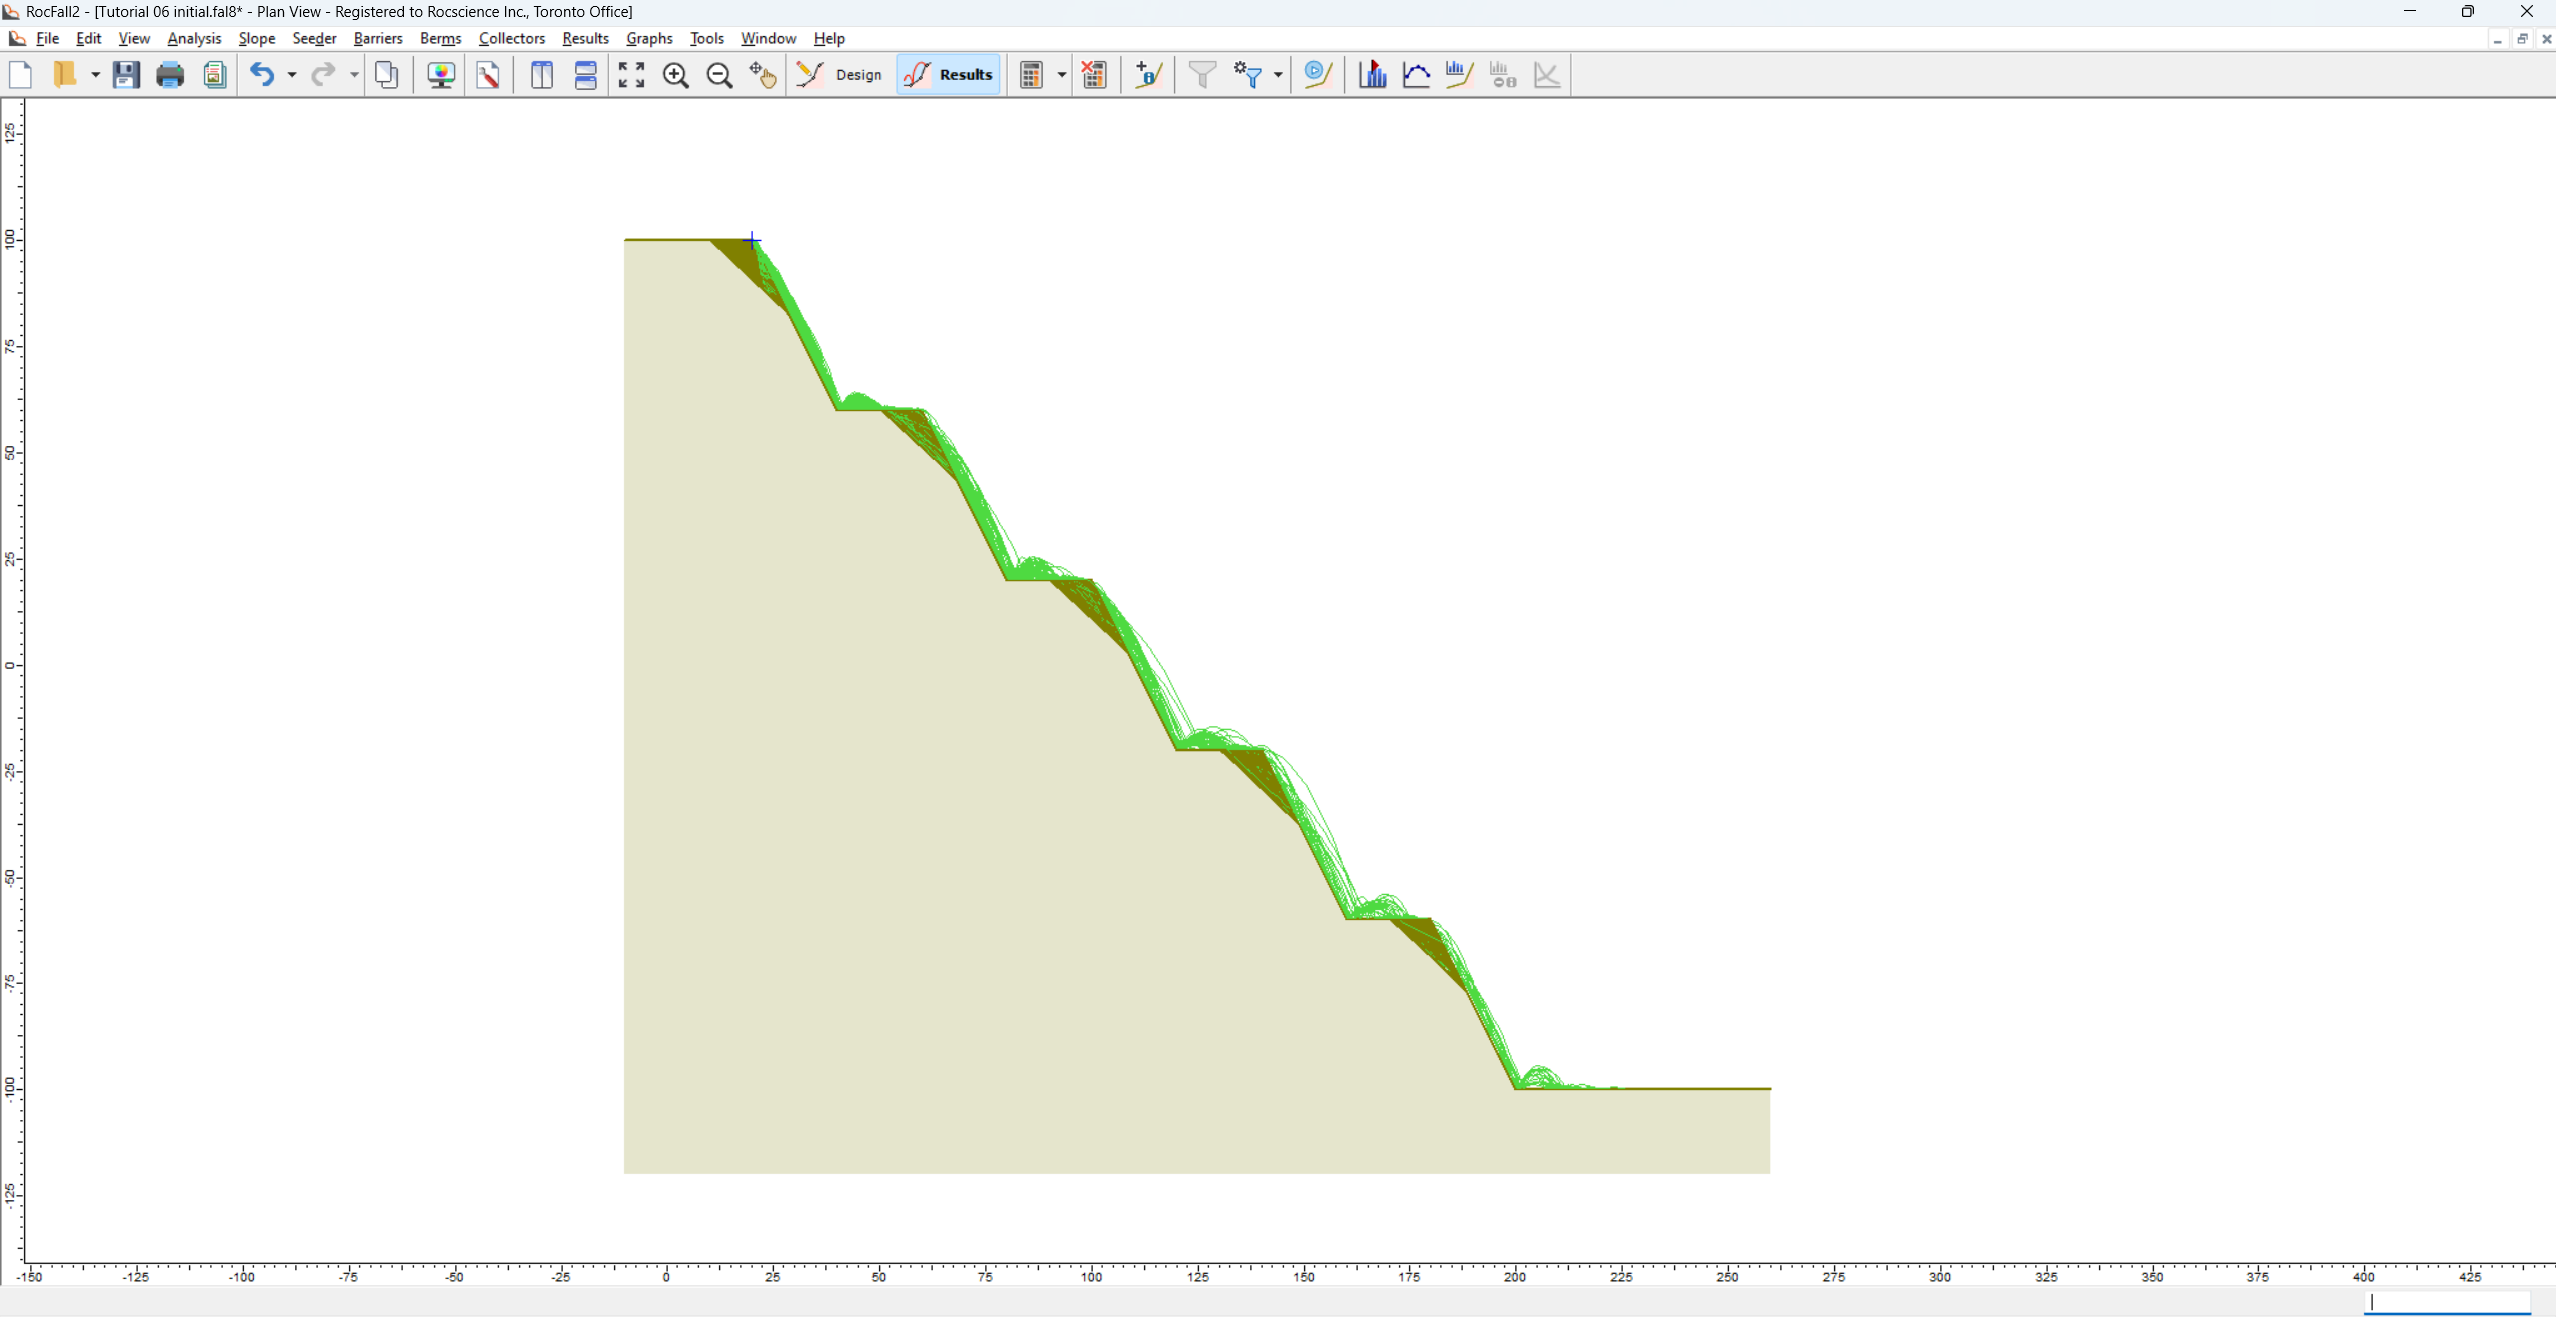
You should see the following:
NOTES:
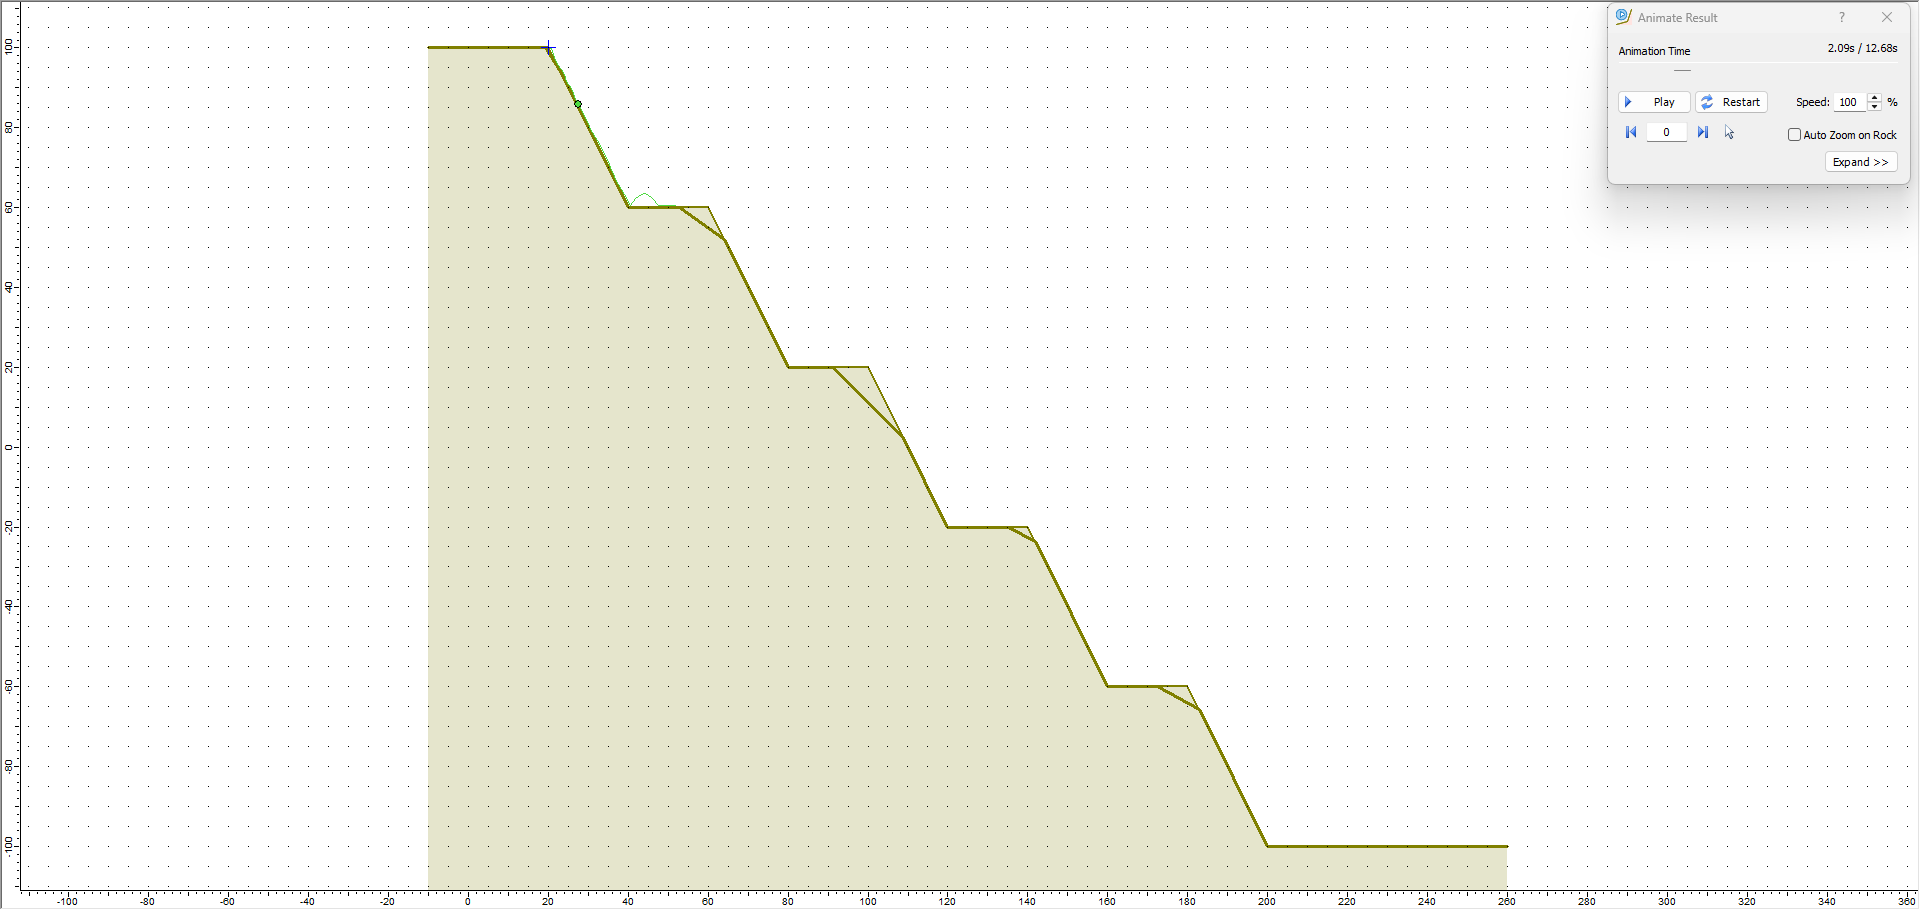
Notice that the rocks now travel much further down the slope because of the loss of bench width created by the Crest Loss option.
Also notice that the Crest Loss slope segments are drawn for all rock paths and show you the actual Crest Losses generated by your input data.
For each rock thrown down the slope, the slope geometry is re-generated using the randomly generated Crest Loss at each selected vertex.
5.1 ANIMATE PATHS
Now we'll use the Animate Path option to view the rock fall.
Select Animate Path on the toolbar or the Results menu and zoom in if necessary.
In the Animate Result dialog, click through each rock path using the forward arrow beside the rock ID number.
NOTES:
Notice that each time you view a new rock path, you can see the actual Crest Loss generated for each rock throw.
The Crest Loss is randomly generated according to your mean values and statistical distribution and parameters.
Close the Animate dialog.
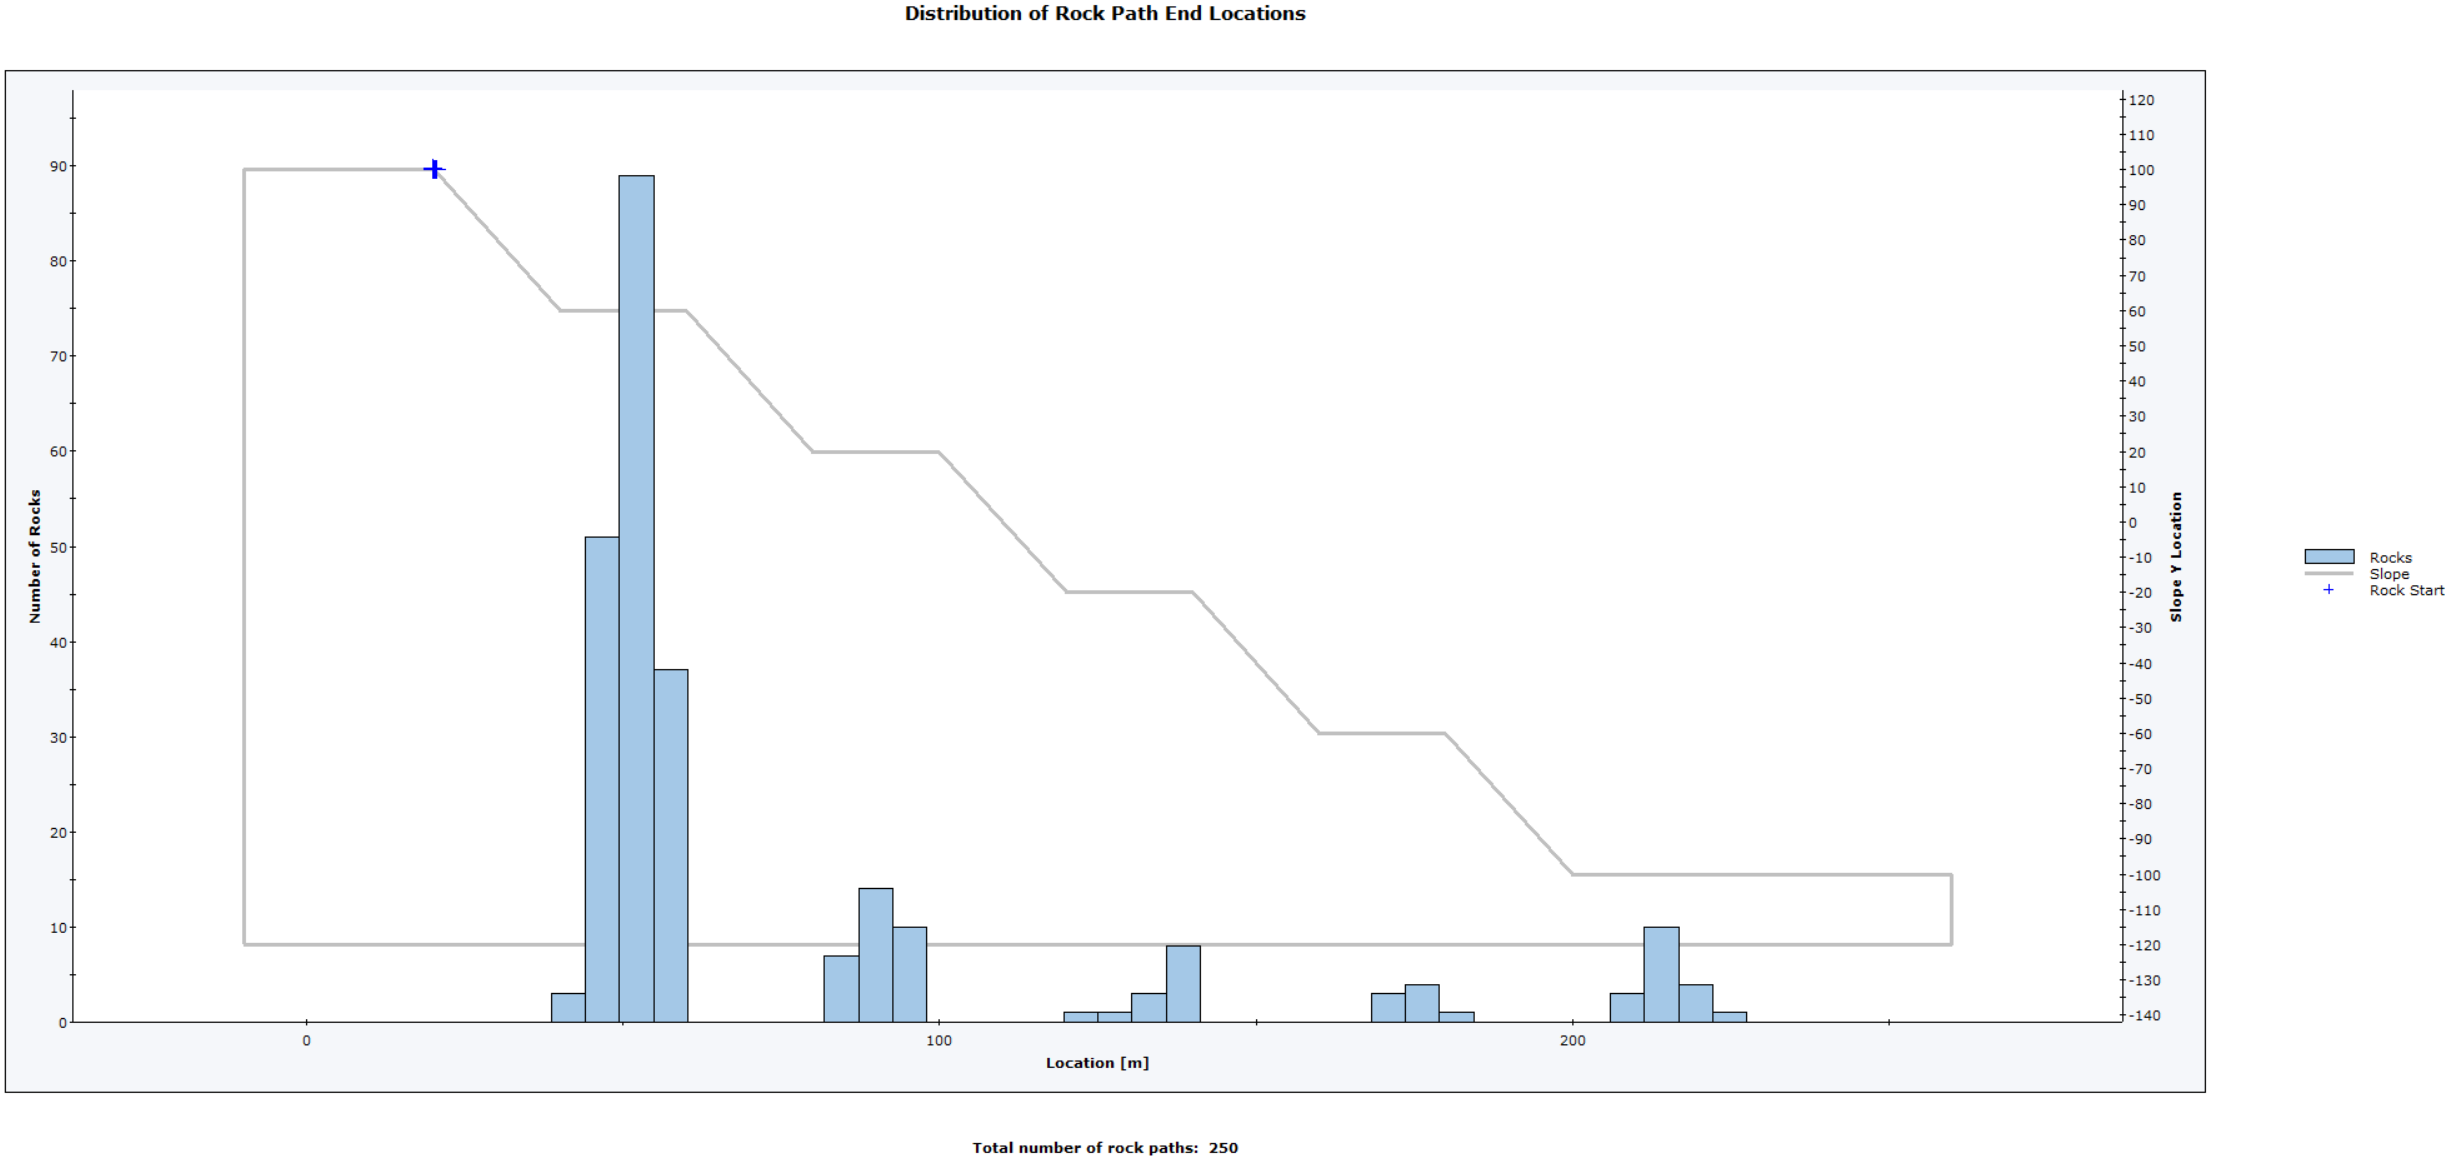
5.2 GRAPH ENDPOINTS
Next we'll generate an Endpoints graph of results with Crest Loss applied.
Select Graph Endpointson the toolbar or the Graphs menu. The Graph Endpoints dialog should appear.
Set Data = Endpoint Location.
Set Value = Number of Rocks.
Set Number of Bins = 50.
Set Paths to Plot = All Rock Paths.
Select Plot Data to generate the Distribution of Rock Path End Locations graph.
NOTES:
With the Crest Loss we have defined, most rocks still stop on the first bench. However, a significant number of rocks now travel farther down the slope, with some coming to rest on each of the downslope benches.
As you can see, the effect of the Crest Loss is significant compared to the model with no crest loss.
6.0 Additional Exercise
As an additional exercise, it is recommended that you experiment with different statistical distributions and input values of Crest Loss to see the effect on the generated crest loss. Since the upslope and downslope segment lengths are not correlated during the statistical sampling, you may wish to define larger values for the downslope Crest Loss compared to the upslope in order to generate more realistic Crest Loss geometry (i.e., steeper wedge failures at the crest).
Also try viewing the Mean Crest Loss display (in Display Options) and compare with the Max display. This will give a better idea of the range of values you have defined.
 button from the toolbar or the Analysis menu.
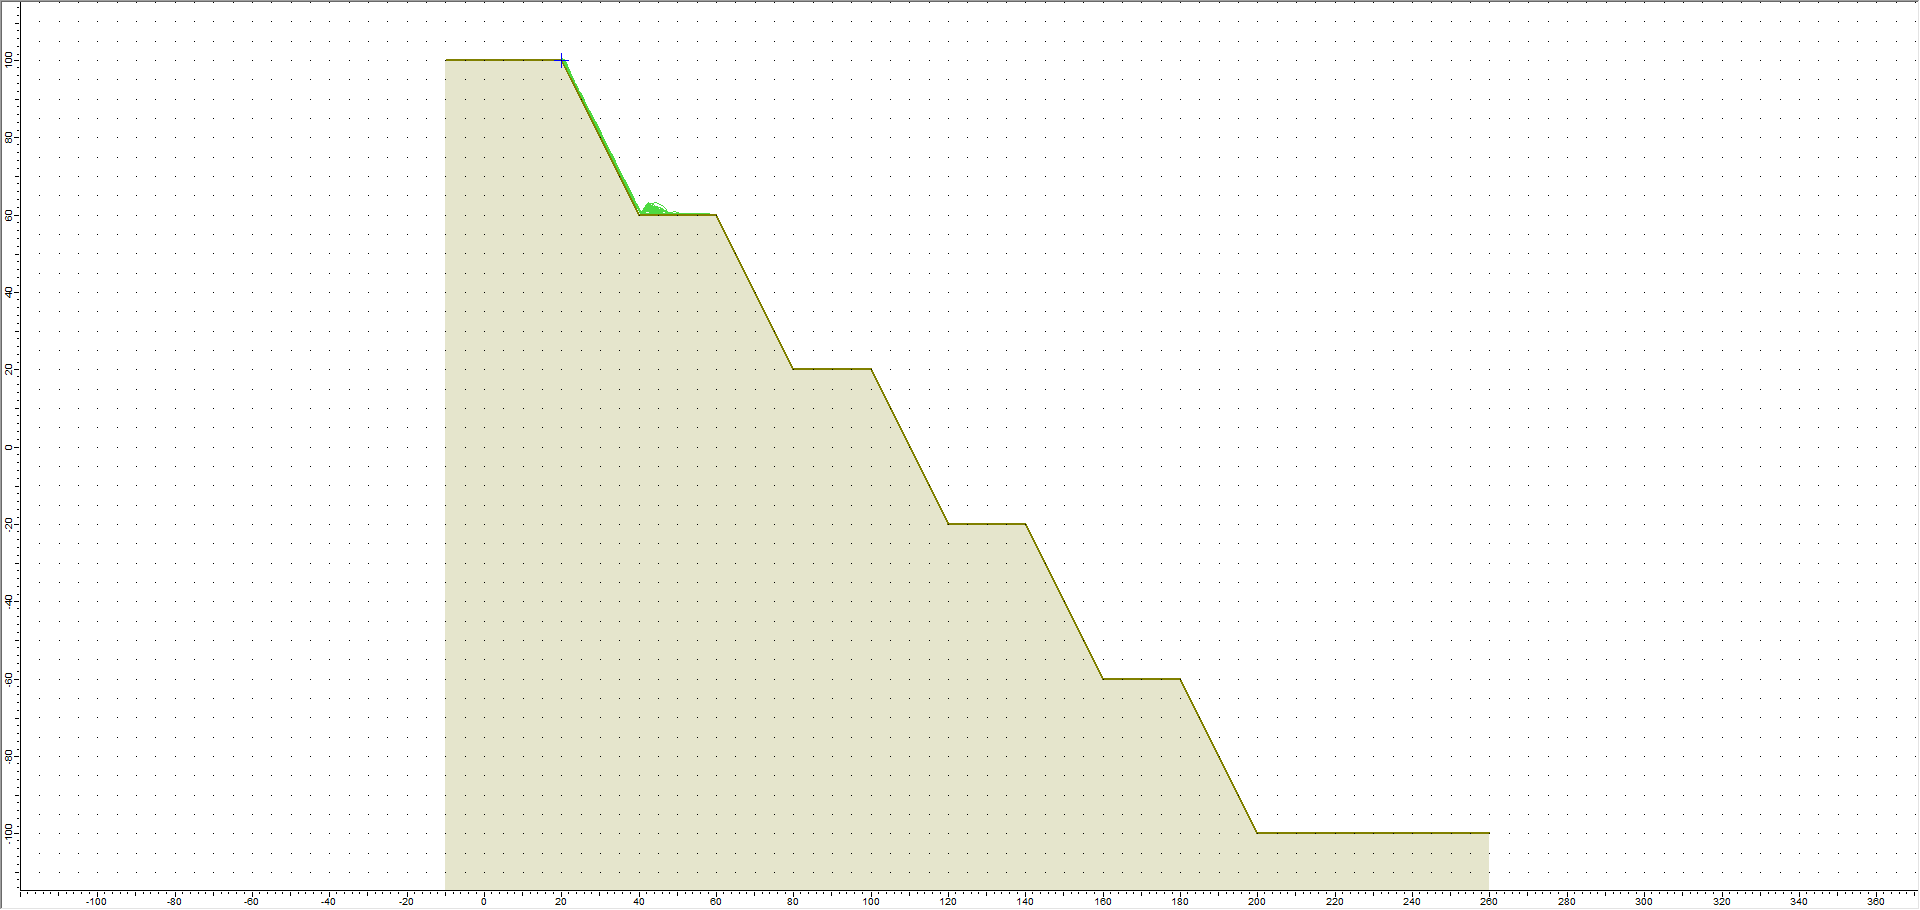


 on the Slope menu.
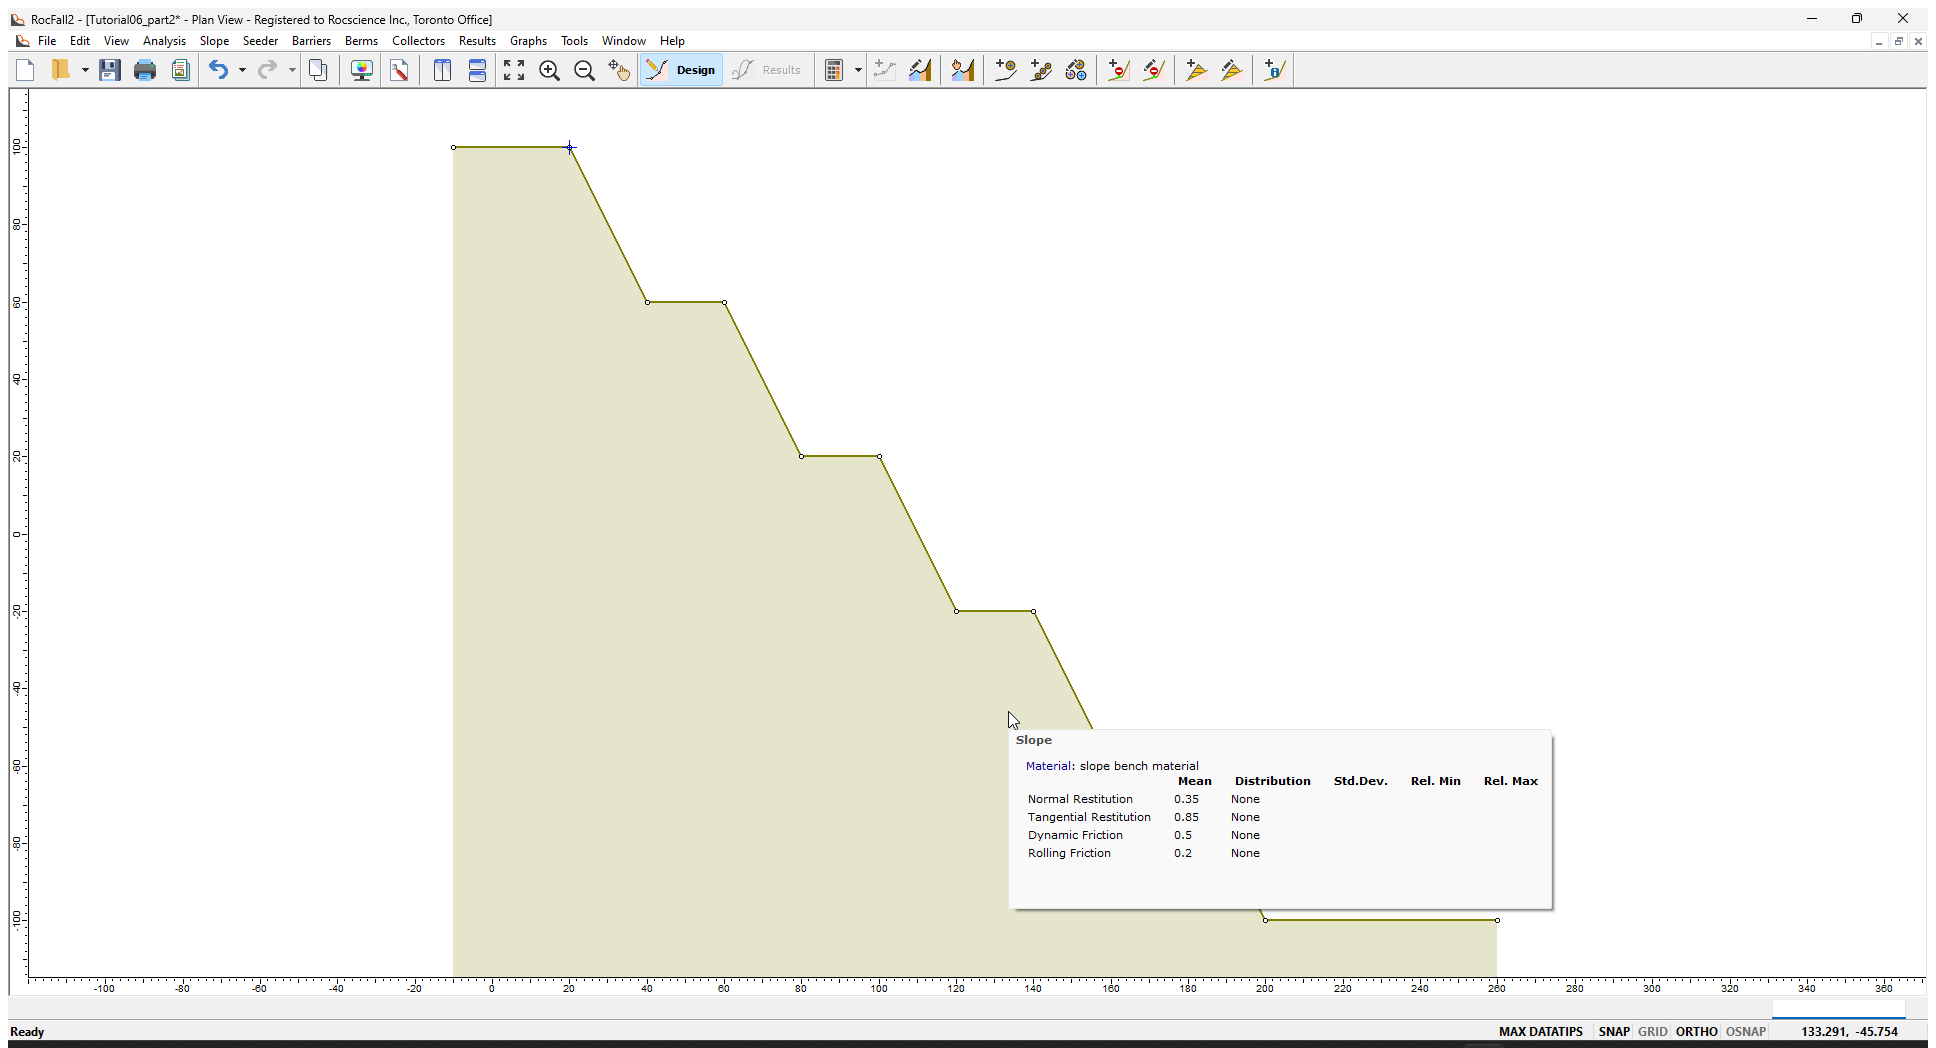

 .
.
 on the toolbar or the Results menu and zoom in if necessary.