This tutorial provides an introduction on how to add Barriers and Collectors to a RocFall2 model and interpret the results.
Topics Covered in this Tutorial:
Adding barriers and collectors
Graphing barrier results
Generating a Barrier Report
Barrier Sensitivity analysis
Report Generator
Finished Product:
The finished product of this tutorial can be found in the Tutorial 03 Barriers and Collectors data file. All tutorial files installed with RocFall2 can be accessed by selecting File > Recent Folders > Tutorials Folder from the RocFall2 main menu.
2.0 Model
2.1 OPEN THE TUTORIAL FILE
Let's start by opening the file for the tutorial:
Select: File > Recent Folders > Tutorials Folder and open the Tutorial 03 Initial file.
This file has all geometry and properties already pre-defined, except for the barrier and collector. File properties include:
Rigid Body Analysis
A single rock type and shape (sphere)
Single slope material with statistical variability of Normal coefficient of restitution
Point seeder with statistical variability of initial velocity
Number of rocks = 50
Note that the finished version of this tutorial is Tutorial 03 Barriers and Collectors.
2.2 BARRIER OVERVIEW
A barrier in RocFall2 is a line segment with one end on the slope surface, which can be placed anywhere along the slope to alter the paths of the rocks as they travel down the slope. Barrier properties include:
Capacity (option to specify as infinite)
Max Height
Min Height
Free Border
Max Elongation
Manufacturer
NOTE: Any number of barriers can be added to the slope. Barriers, however, cannot cross other barriers and cannot cross slope segments.
Let’s first look at the results with no barrier.
Select the Compute button from the toolbar or the Analysis menu to run the analysis. The view will be switched to Results mode automatically.
You should see the following:
2.3 ADD BARRIER
Now let's add a barrier.
Select the Design Mode on the toolbar.
Select Add Barrieron the toolbar or the Barriers menu. The first point of a barrier line segment must always be on an existing slope segment. The cursor appears as a cross when moving alone the slope; this marker indicates the point on the slope nearest the cursor location and helps when adding the first barrier vertex graphically.
Enter the following coordinates in the prompt line in the bottom right of the application window.
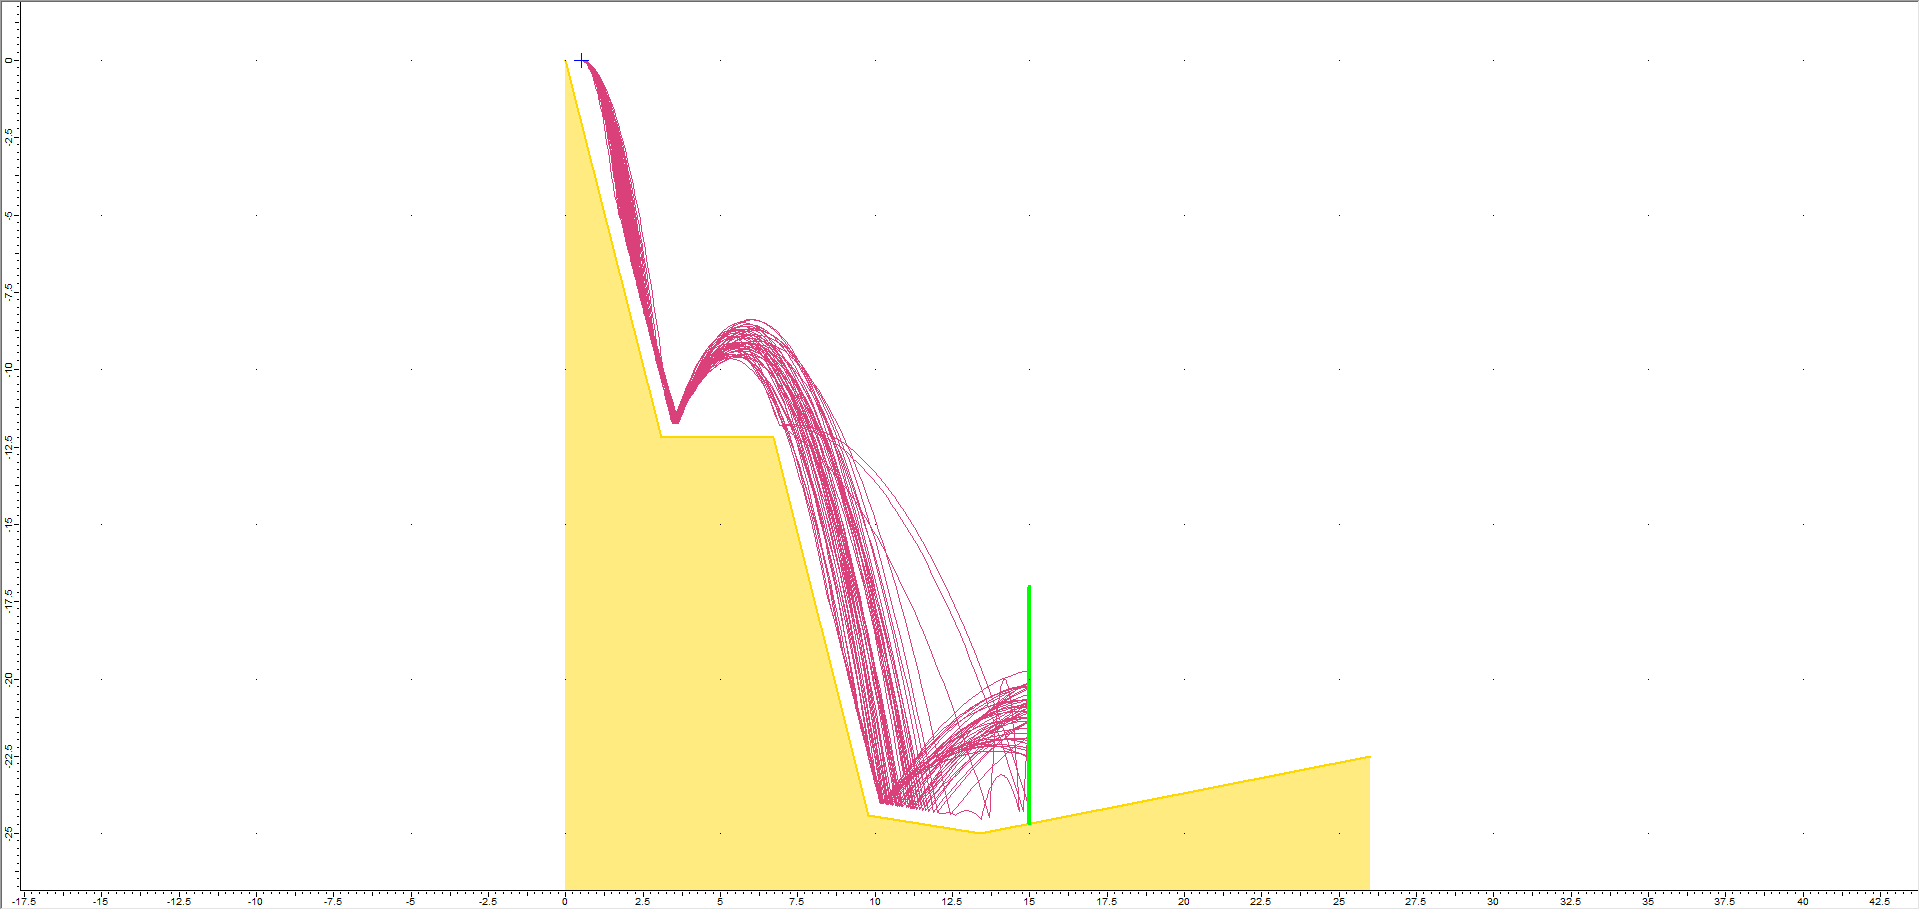
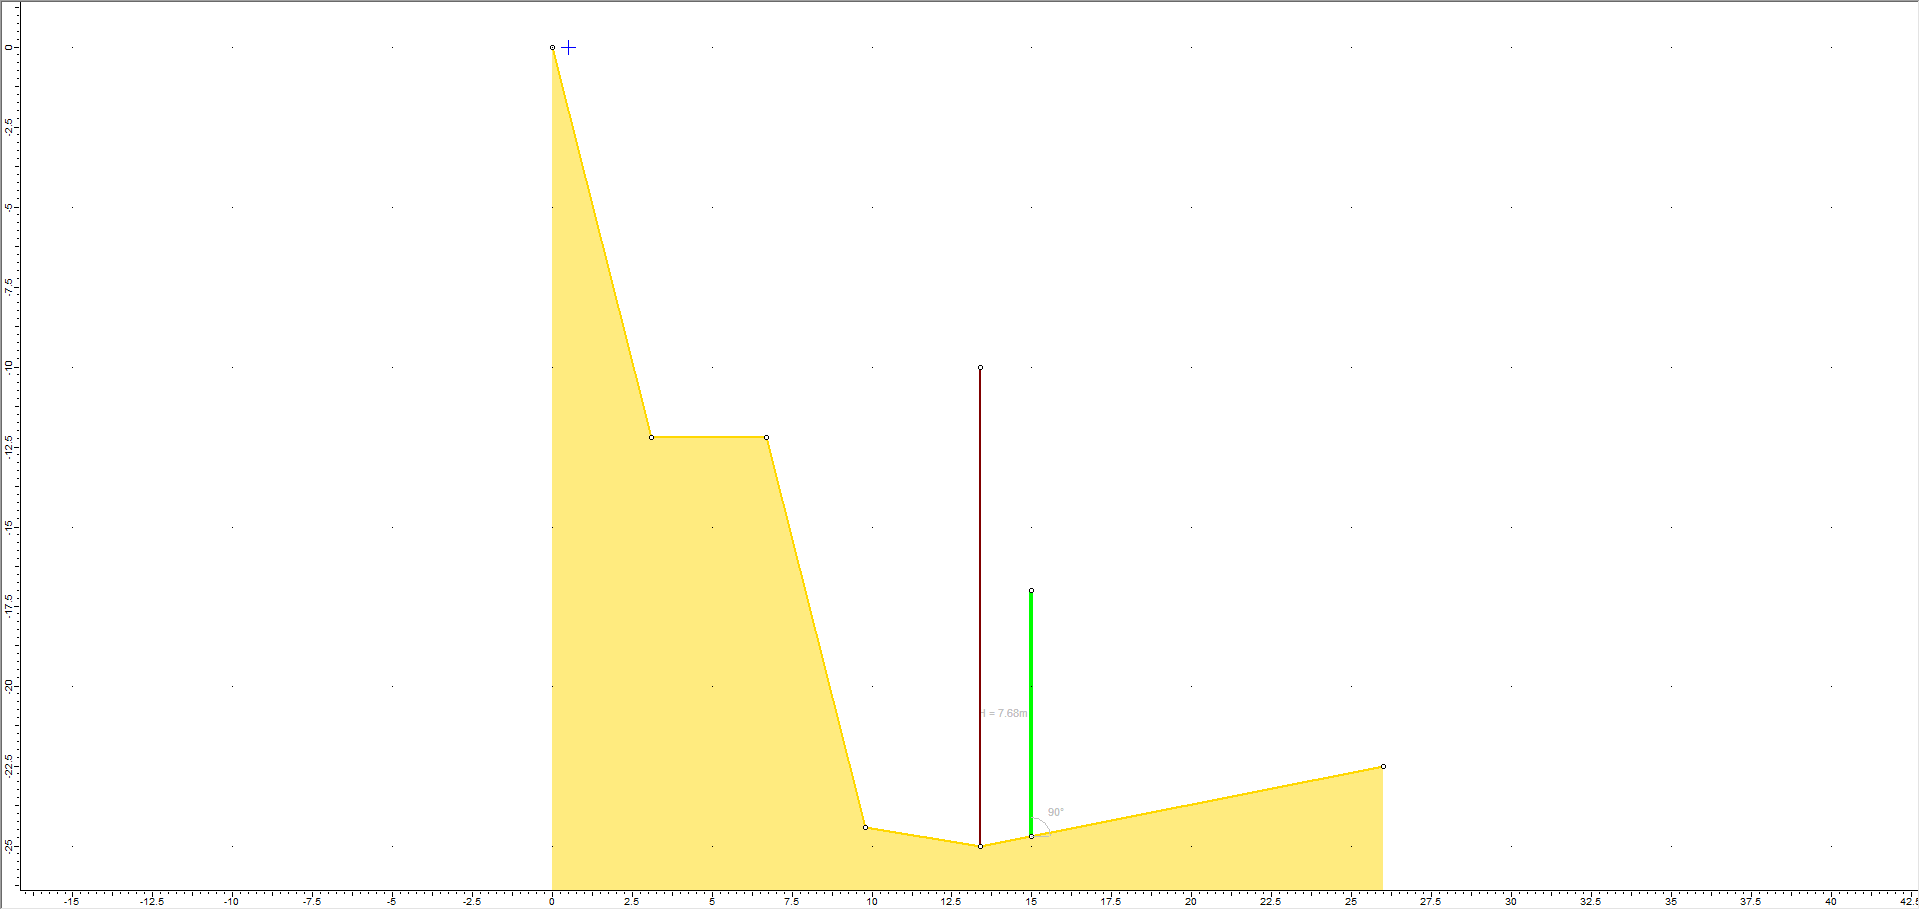
Enter starting point on the slope line: (15, -25)
Enter barrier height or endpoint: (15, -17)
The barrier is drawn on the slope and the Define Barrier dialog appears. Note that the barrier Height and Inclination can be changed in this dialog.
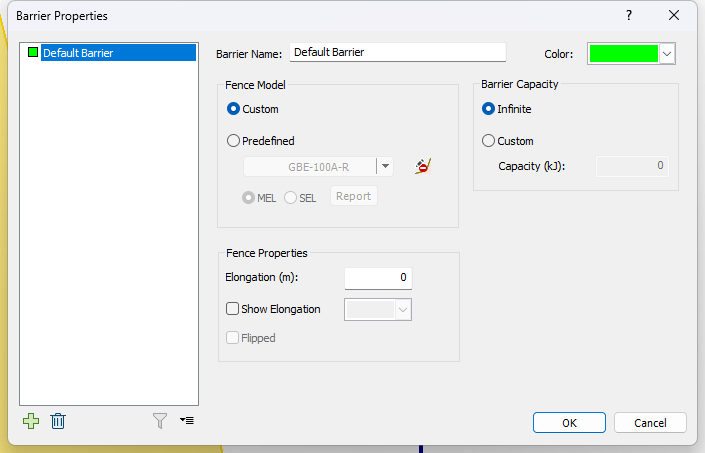
Click on the button to the right of Barrier Property. The Barrier Properties dialog appears. The Default Barrier material in RocFall2 is the Custom barrier (Fence Model) with Barrier Capacity = Infinite. This is the barrier we’ll use for this tutorial. In the Barrier Properties dialog, you can also specify a barrier capacity and elongation or choose from a list of Predefined Fence Models. Note that Fence Properties Elongation has no effect on the analysis.
Click OK in the Barrier Properties dialog.
Click OK in the Define Barrier dialog.
3.0 Results
Now let's run the analysis and view results.
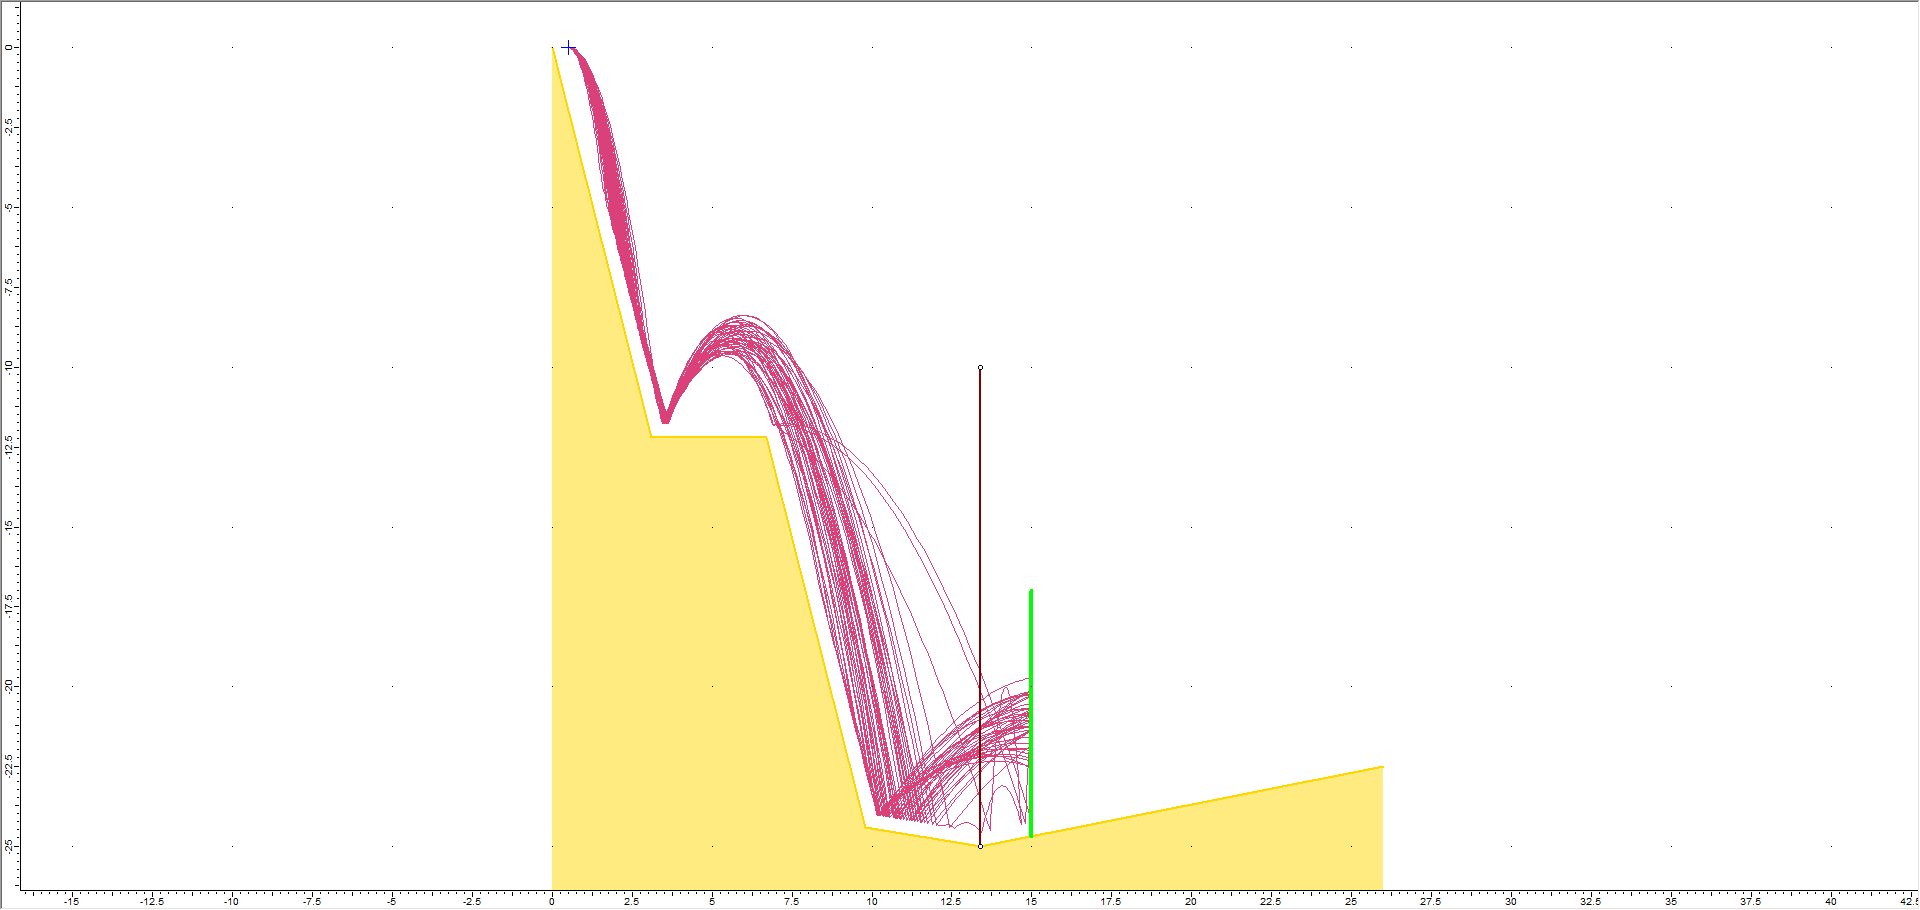
Select Compute button from the toolbar or the Analysis menu.
Notice that all the rocks are stopped by the barrier.
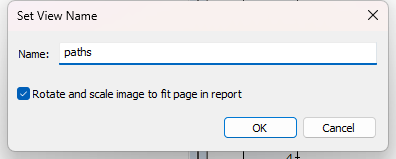
Right click anywhere blank (without any elements) in the view and select Add View to Report or go to Analysis > Add View to Report.
Enter a new view name or keep the default view name. Select OK.
3.1 ANIMATE ROCK PATHS
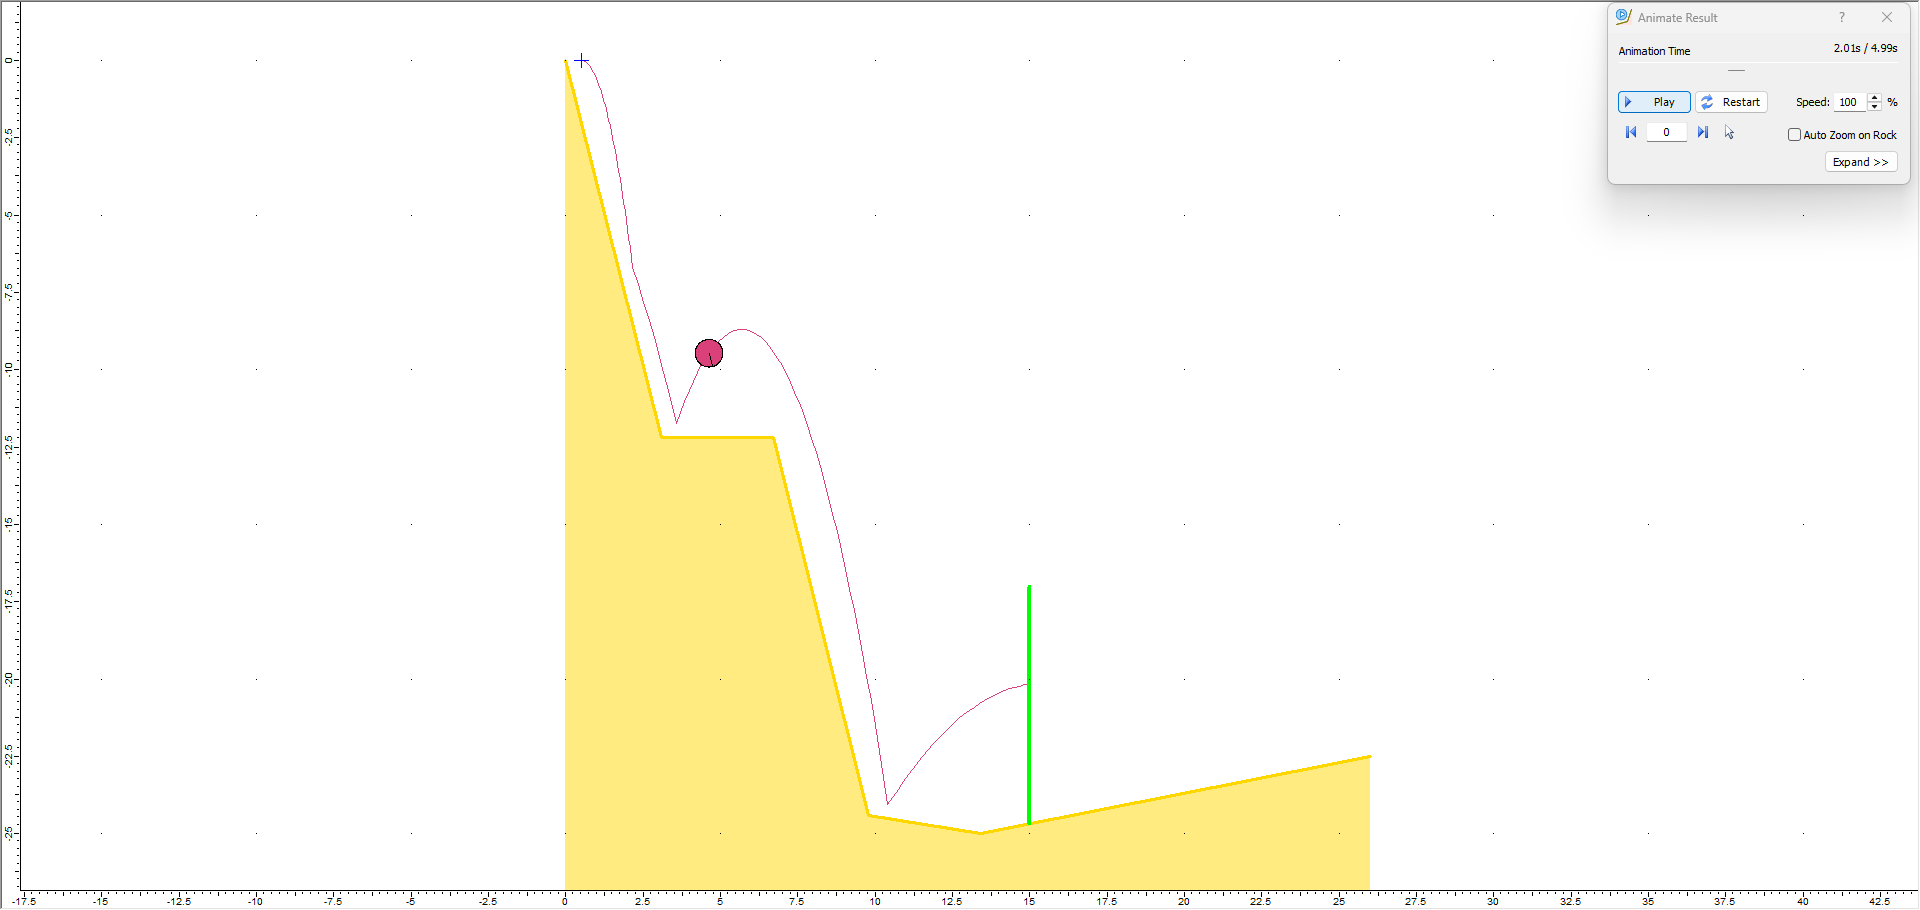
A very useful feature of RocFall2 is the ability to animate the path individual rocks on your model take as they fall using the Animate Result dialog.
To animate rock paths:
Right click on any rock path and select Animate Path
Notice that, when a Rigid Body rock shape (in this case a sphere) hits a barrier and stops, the rock stops when the centroid of the shape intersects the barrier. The radius or size of the rock is not accounted for when a rock shape collides with a barrier; only the centroid of the shape is used to determine the intersection, shown by the final position of the rock on the barrier.
Close the Animate Result dialog.
NOTE: When a rock hits a barrier in RocFall2, the rock either STOPS at the barrier or goes THROUGH the barrier (with reduced energy), depending on the capacity of the barrier and the energy of the rock. Rocks do not bounce off fence barriers in RocFall2.
3.2 GRAPH ENDPOINTS
Now we'll create a graph of the rock endpoint locations.
Select Graphs > Graph Endpoints to open the Graph Endpoints dialog.
Set Data = Endpoint Location.
Set Value = Number of Rocks.
Set Number of Bins = 50.
Set Paths to Plot = All Rock Paths.
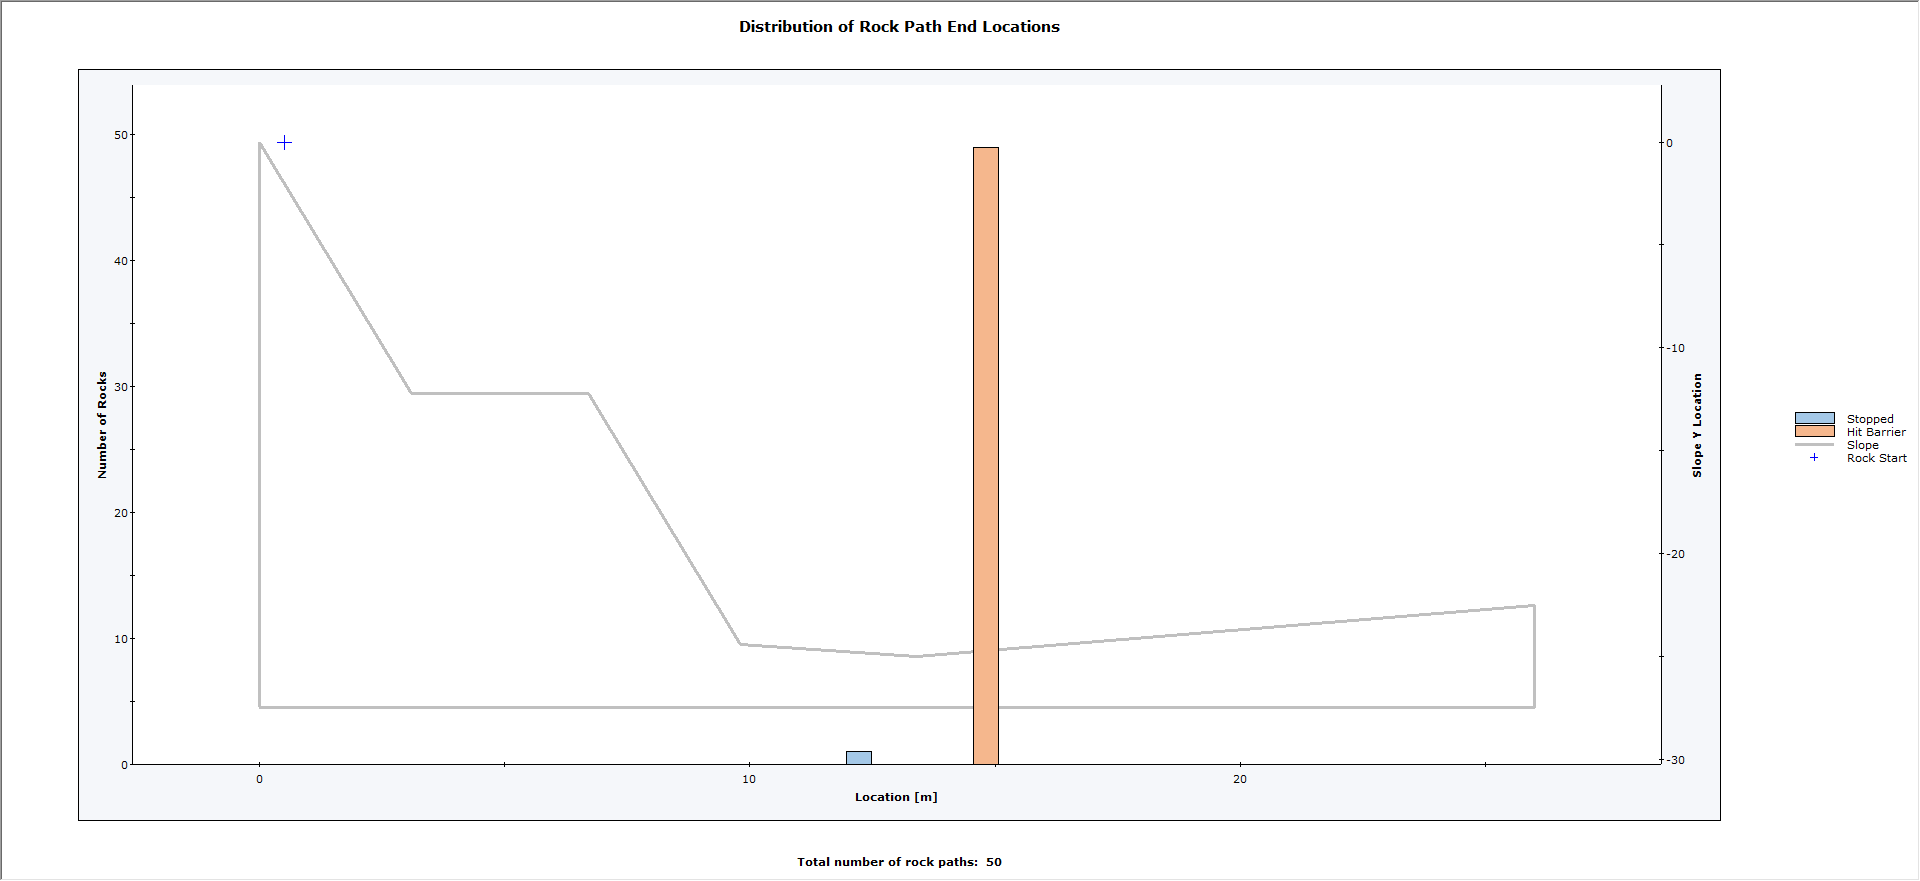
Select Plot Data to generate the Distribution of Rock Path End Locations graph.
Right-click in the graph and select Toggle End Reasons.
The single rock that does not hit the barrier bounces just in front of the barrier without touching it and settles at the lowest vertex in front of the barrier.
Right click anywhere in the chart and select Add View to Report or go to Chart > Add View to Report.
Enter a custom view name or keep the default view name. Select OK.
3.3 GRAPH BARRIER RESULTS
For each barrier in your model, you can plot the following graphs for rocks that strike the barrier:
Total Kinetic Energy
Translational Kinetic Energy
Rotational Kinetic Energy
Translational Velocity
Rotational Velocity
Impact Along Height
Impact Angle
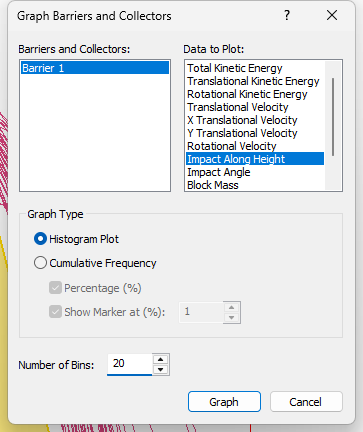
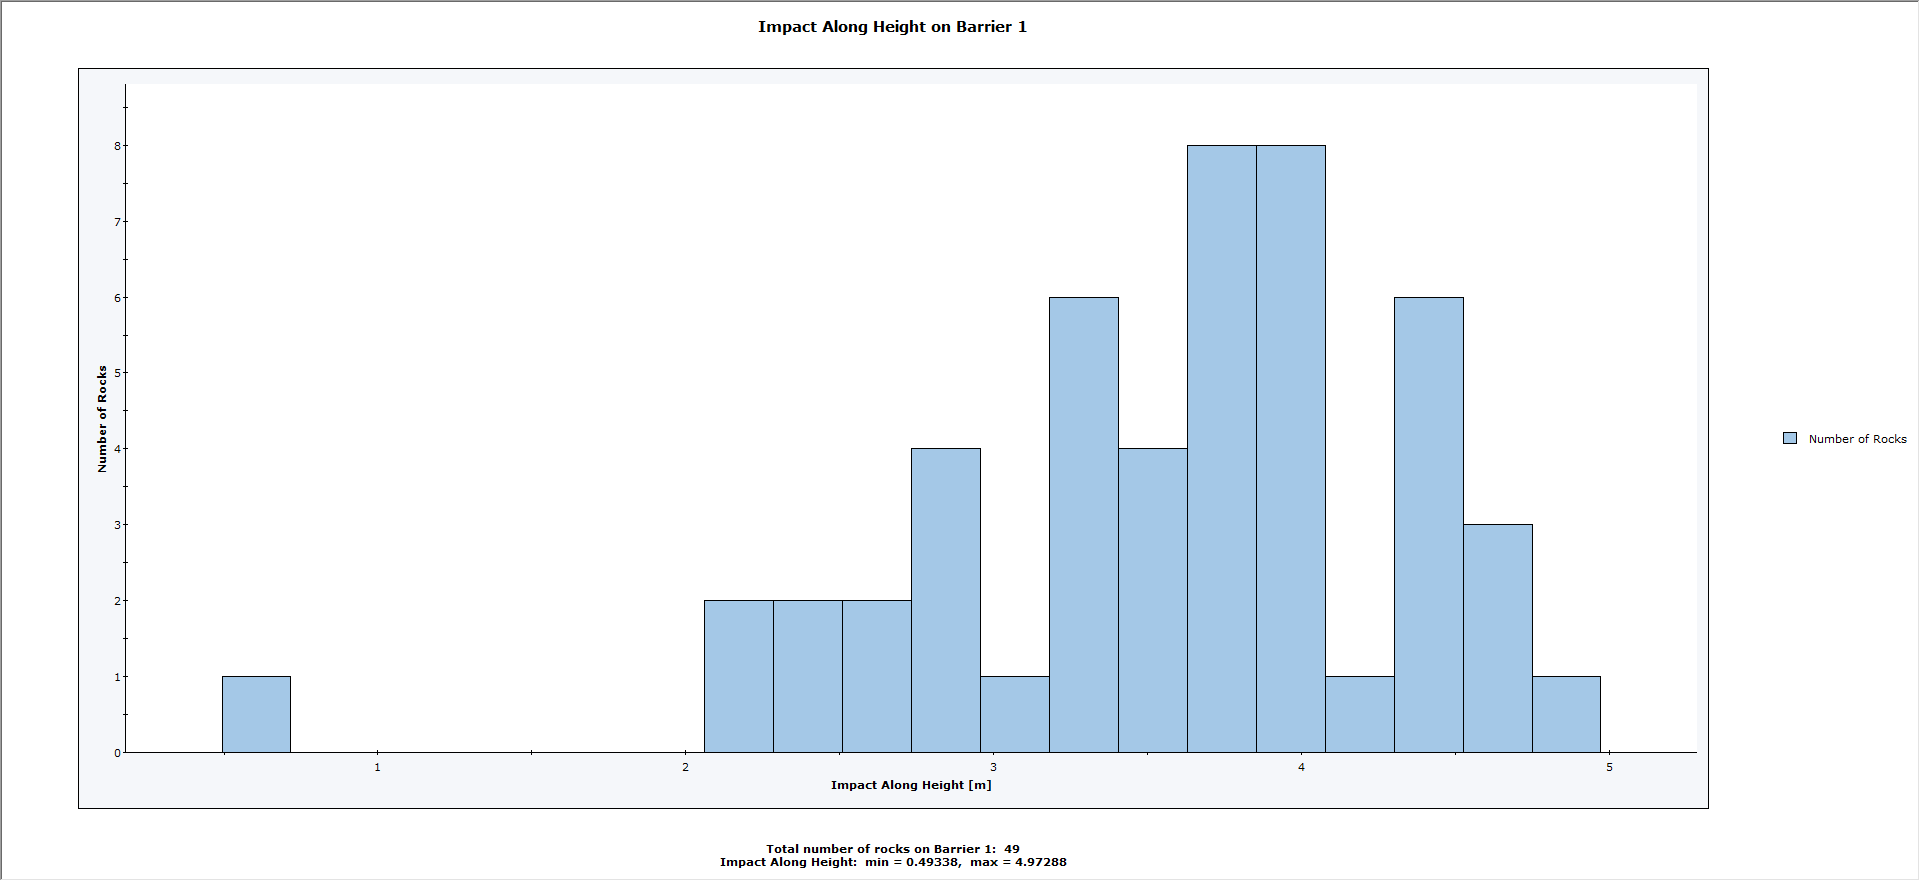
Let's first graph Impact Along Height, using the Graph Barriers and Collectors dialog. To open the dialog:
Select: Graphs > Graph Barriers/Collectors
In the dialog, select Impact Along Height under Data to Plot.
Select Histogram Plot as the Graph Type.
Set Number of Bins = 20.
Click Graph.
The impact locations are plotted in terms of the distance along the barrier, starting at 0 at the first barrier vertex.
Right click anywhere on the chart and select Add View to Report or go to Chart > Add View to Report.
Enter a new view name or keep the default view name. Select OK.
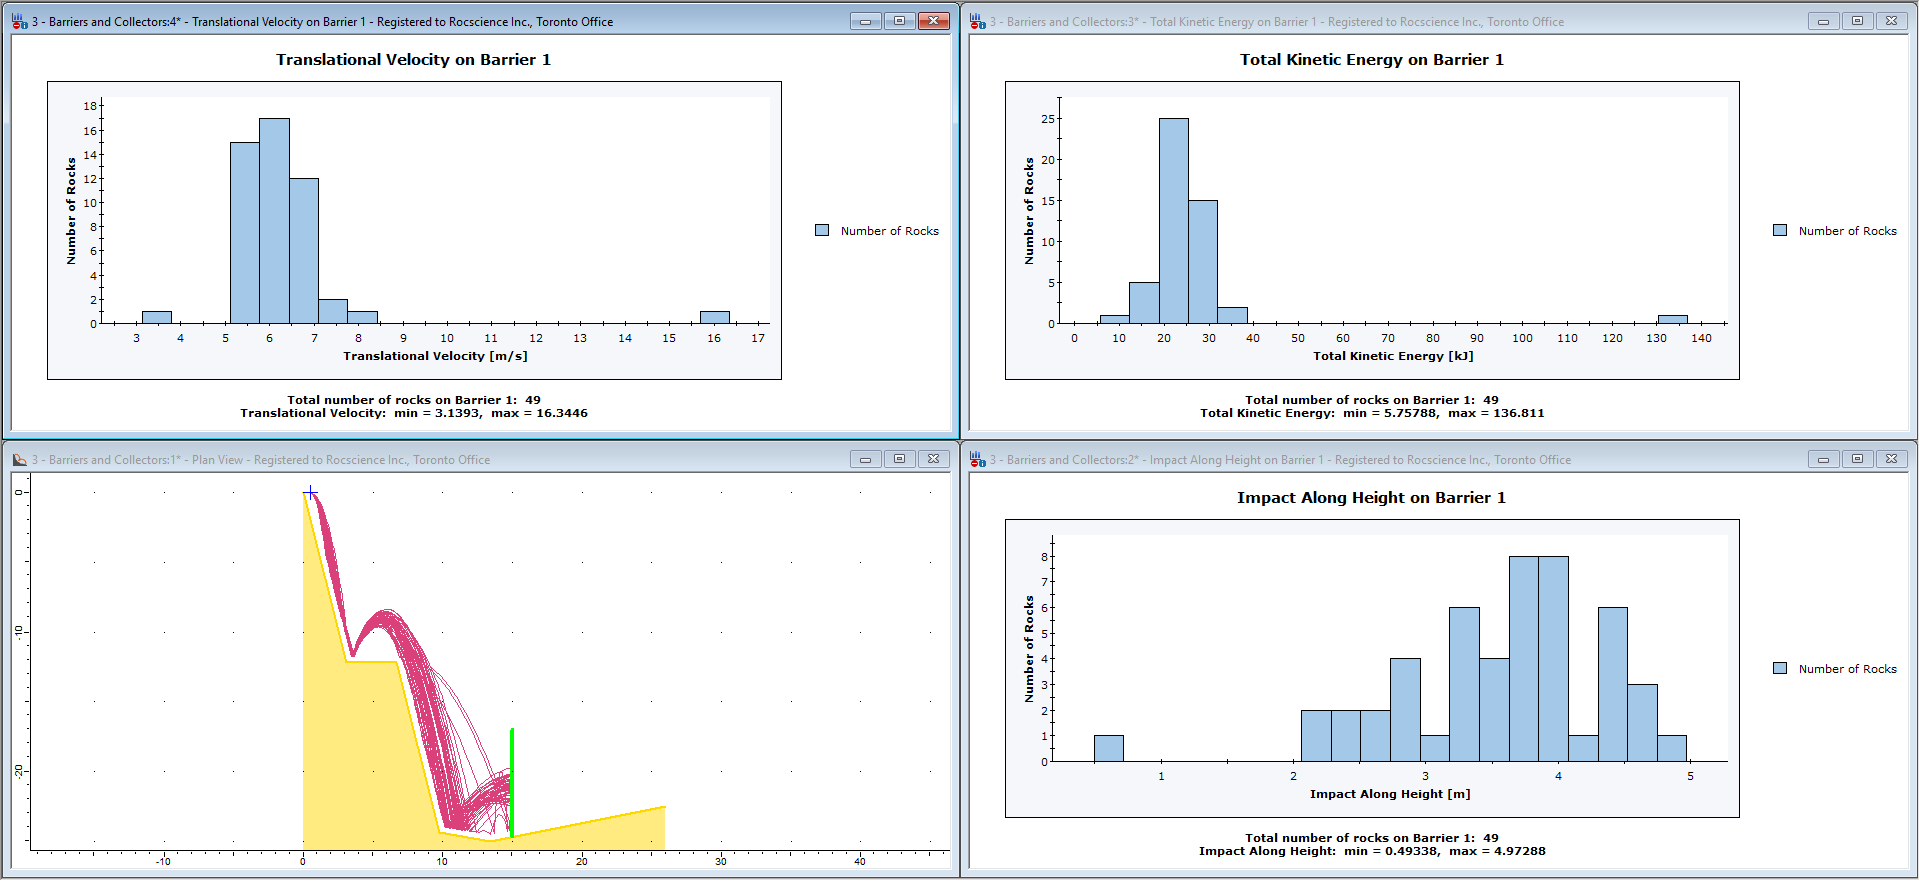
Similarly, you can use the dialog to plot graphs of Total Kinetic Energy and Translational Velocity. To view all the graphs generated so far, you can tile the views by selecting Tile Windows on the toolbar. You should see the figure below.
After analyzing the plots, close the three graph views, maximize the Slope view, and switch to Design mode.
4.0 Data Collectors
A data collector in RocFall2 is simply a line segment that gathers information about rocks passing through the segment while falling down the slope. It is not a physical entity. Data collectors record the velocity, kinetic energy, and location of all rocks that pass through as they travel down the slope.
NOTES:
Unlike barriers, data collectors do not affect the movement of the rocks in any way.
Data collectors do not have any properties associated with them (other than the endpoints defining their location) and do not have any directionality (i.e., it doesn’t matter which end is the starting point and which is the ending point).
There is no restriction on the number of data collectors or where they can be placed. They may intersect or cross the slope, barriers, or other data collectors at any location.
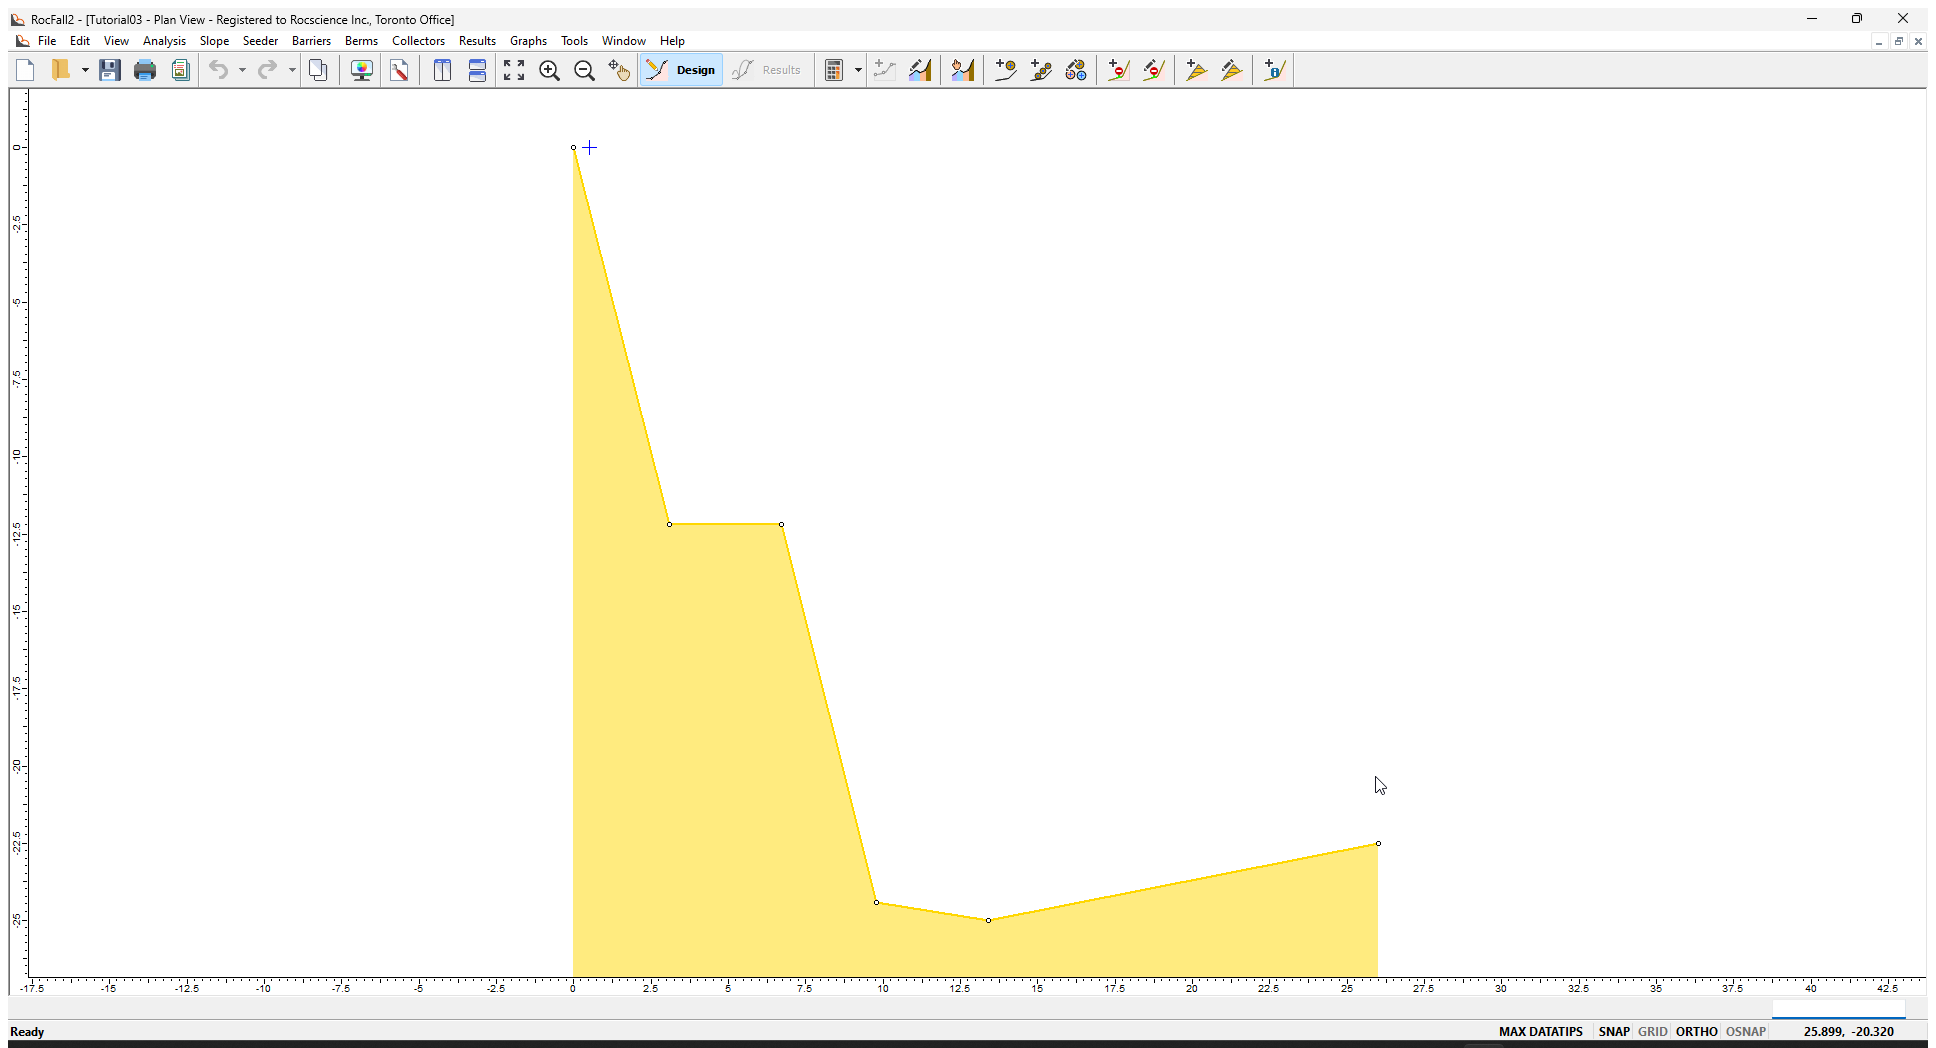
4.1 ADD DATA COLLECTOR
You add a data collector using the Add Collector option.
Select Collectors > Add Collector The cursor turns into cross hairs.
Move the cursor near the lowermost slope vertex at (13.4, –25). The cursor should snap to the exact location of the vertex.
Click the left mouse button to enter this as the first point of the data collector.
Enter the second point through the prompt line: (13.4, -10) .
The model should look as follows (note that the text boxes were added with the Text Box option in the Tools menu):
4.2 RESULTS
Select the Compute button from the toolbar or the Analysis menu.
Note that the data collector has no effect on the rock paths.
4.3 GRAPH DATA COLLECTOR RESULTS
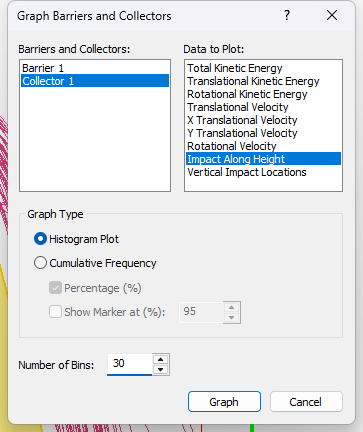
Now let's graph the data collector results, using the Graph Barriers and Collectors dialog.
Right-click on the collector and select Graph Collector Data in the popup menu.
Select Collector 1underBarriers and Collectors.
Select Impact Along HeightunderData to Plot.
Select Histogram Plotas the Graph Type.
Change Number of Bins to 30.
Click on Graph.
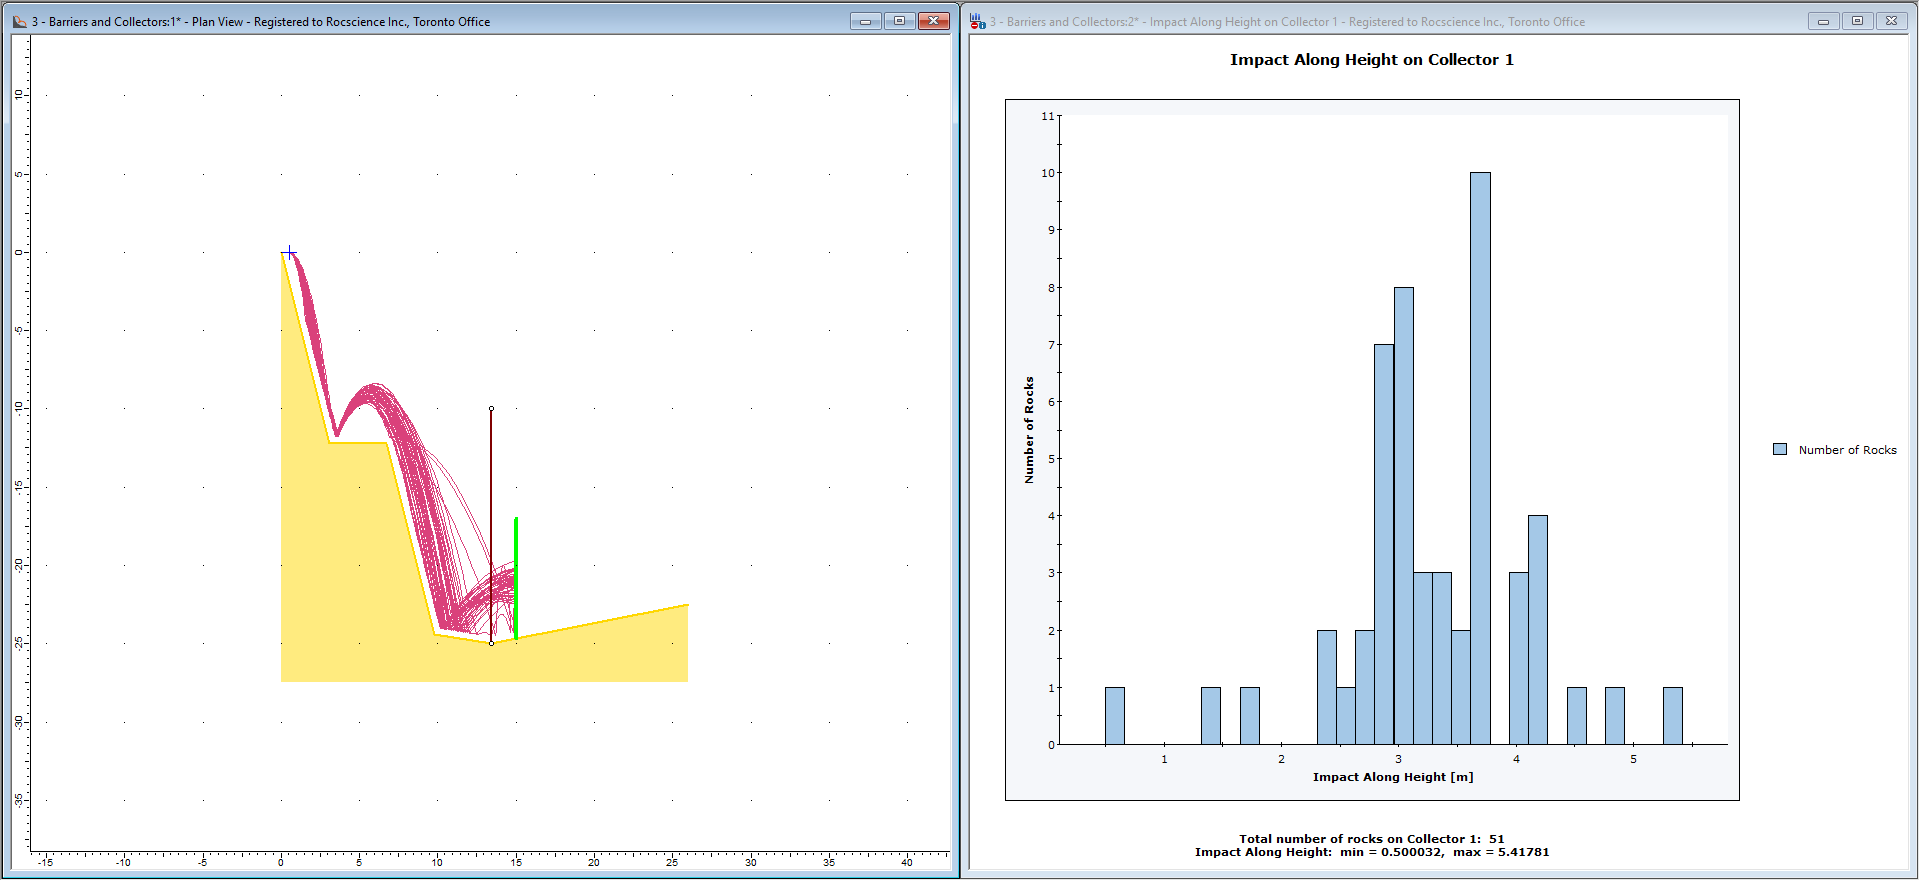
Tile the views.
To plot the impact locations in terms of the absolute Y-coordinates of the model, select Vertical Impact Location instead of Impact Along Length in the graph dialog.
It is interesting to note the Total Number of Rocks on Collector 1 = 51 listed at the bottom of the histogram plot, even though the Number of Rocks Thrown = 50. This is because data collectors register a rock every time it passes through a collector. If a rock bounces through a collector multiple times, each intersection is added to the total number of rocks for the collector. In this case, the difference is due to the single rock that did not hit the barrier and that bounces a few times through the collector.
4.4 DISTRIBUTION GRAPHS VS. COLLECTOR GRAPHS
In most cases, data collection is required along vertical lines at given X locations along the slope. For this purpose, the Graph Distribution option in the Graph menu allows the following plots to be created:
Bounce Height
Total Kinetic Energy
Translational Kinetic Energy
Rotational Kinetic Energy
Translational Velocity
Rotational Velocity
These graphs allow the user to quickly view distributions anywhere along the entire extent of the slope (see the Tutorial 01 - RocFall2 Quick Start for details). Distribution Graphs are actually derived from a series of equally spaced “invisible” vertical data collectors automatically generated by RocFall2. The spacing of these collectors is determined by the Number of Bins in the Graph Distribution dialog and the total X extent of the slope.
In most cases, the Distribution Graphs provide the user with the desired data. The Data Collectors option described in this tutorial should only be necessary in the case when you want to determine information (i.e., velocity, kinetic energy, vertical location, horizontal location) about the rocks passing through a specified location.
5.0 Barrier Report
A very useful feature of the RocFall2 barrier analysis is the ability to generate a Barrier Report. Based on the barrier input parameters and design criteria, this allows you to determine if a barrier meets the necessary design requirements.
Barrier design reports can also be added to the report generator from the right click pop-up menu or from the menu Edit > Add to Report .
6.0 Barrier Sensitivity Analysis
Barrier Sensitivity analysis allows the user to input ranges of values for a barrier location, height, inclination, or capacity and automatically carry out a sensitivity analysis and graph results. For details, see Tutorial 07 - Barrier Sensitivity Analysis in RocFall2.
7.0 Report Generator
Report Generator is the new reporting tool that replaces Info Viewer to provide more flexibility. So far we have added 3 different views to the report in the previous steps.
Note: Some sections and saved views are tied to run results. If results are cleared or unavailable, those items will not show up in the report. See the Report Generator topic for more details.
7.1 Add View to Report
With the Add Views feature, you can add specific views of your computed model to your report. In the respective view that you want to add to the report:
Select Analysis (model view), Chart (chart view) or Edit (barrier report) > Add View to Report from the menu or the right-click menu. The current view/report will be added to your report and can be seen when we open the Report Generator later.
Enter a name for your view.
Click OK.
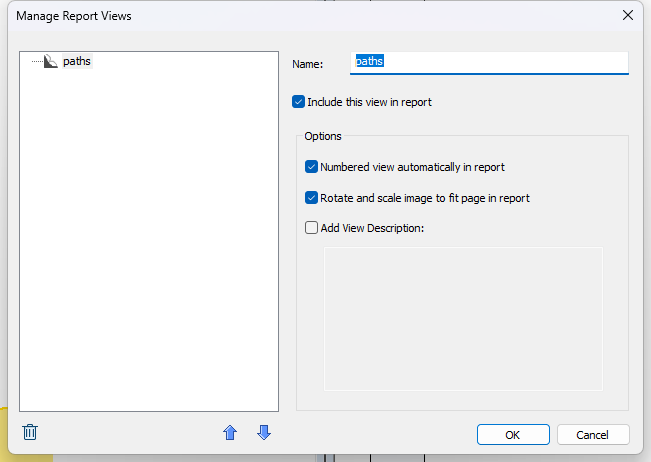
7.2 Manage Report Views
The Manage Report Views dialog allows you to review the views you have added to your report, add further details, and arrange the order of the views. To open the dialog:
Select Analysis > Manage Report Views from the menu in the model view. A new dialog will appear.
Use the check boxes to select what views to add to your report.
Use the Up and Down buttons to change the order of the views.
To add a description to your view, select the view in the list of views and enter the description in the Description box.
Click OK to close the dialog.
You can rename the views (to be shown in the report) and reorder them in this dialog. Images are rotated by default in the report (to be shown in the landscape orientation). Uncheck Rotate image in report for portrait orientation of the specific image.
7.3 Launching the Report Generator
Once you have added your views, it is now time to open the Report Generator. To launch the Report Generator:
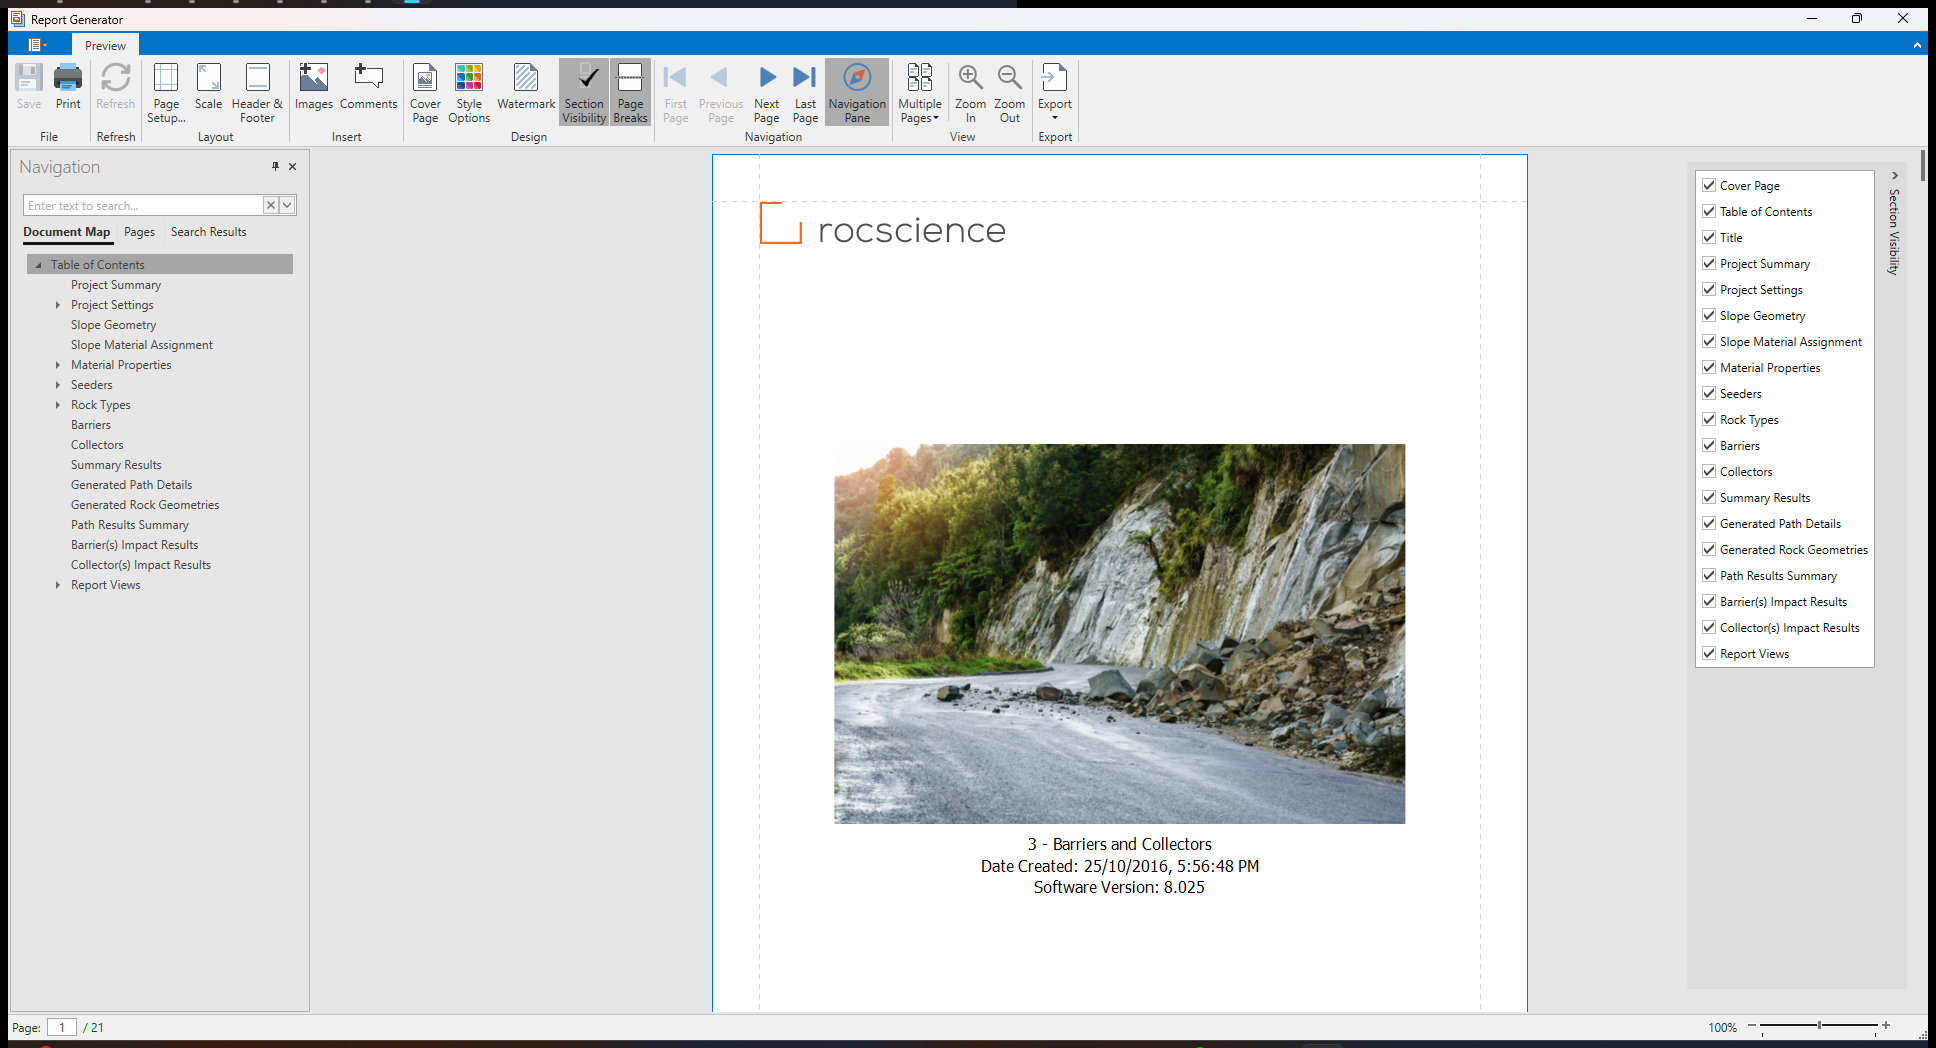
Select Analysis > Report Generator from the menu or click on the Report Generator icon in the tool bar.
A new window will open. Here is where you will see all the various options for customizing your report.
7.4 Navigating the Report
When you launch the Report Generator, the details of your project are automatically populated into the report. A table of contents and cover page are automatically created as well.
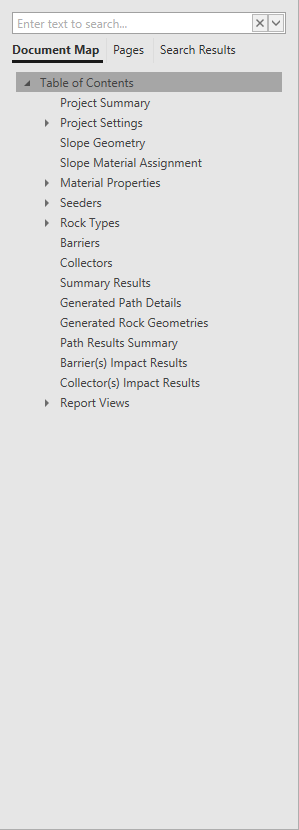
7.4.1 NAVIGATION BAR
Use the Navigation Bar on the left of the screen to quickly navigate to the different sections of the report. You will note that the added Views have been added to the end of your report under the Report Views section.
Use the Document Map tab to find specific sections.
Use the Pages tab to navigate to specific pages.
You can also use the Search Field to search for specific sections of your report.
Note: Clicking on a section in the Table of Contents will also take you to that section of the report.
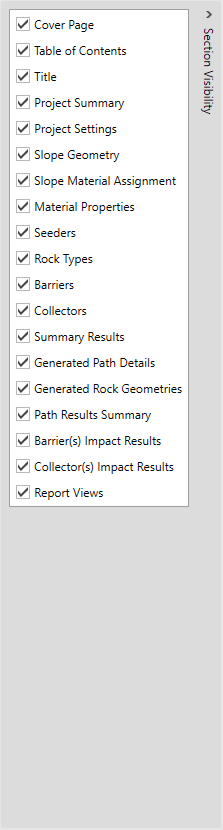
7.4.2 SECTION VISIBILITY
The Report Generator allows you to select which sections you wish to include in the report. By default, all sections are included. To add or remove a section from your report:
Click on the Section Visibility button in the tool bar. The list of sections will appear.
Un-check the boxes next to sections you do not want included in the report.
When you’re done, click on the Section Visibility button again to close the menu.
7.5 Adding Images and Comments
The Report Generator lets you add images and comments to any section of the report.
7.5.1 IMAGES
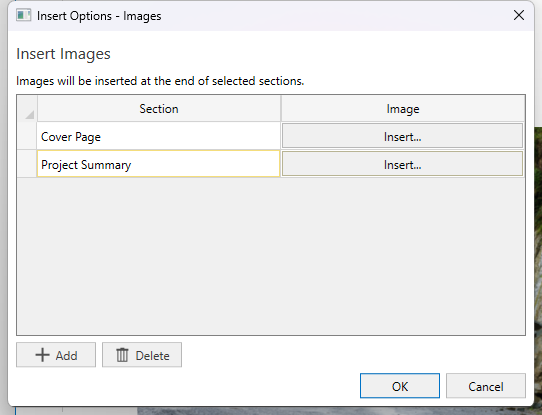
To add an image to your report:
Click the Images button in the tool bar. A new dialog will appear.
Click the +Add button to begin adding images.
Use the Section drop down to select the section where you want to add the image.
Click Insert to select file to add.
Repeat the above steps to add more images.
If you wish to remove an image, click on the line you wish to remove and then click Delete.
Click OK to close the dialog.
7.5.2 COMMENTS
To add comments to your report:
Click on the Comments button in the tool bar.
Click the +Add button to begin adding comments.
Use the Section drop down to select the section where you want to add the comment.
Click Insert. A window will appear where you can enter your comment.
Click OK.
Repeat the above steps to add more comments.
If you wish to remove a comment, click on the line you wish to remove and then click Delete.
Click OK to close the dialog.
7.6 Page Breaks
The Page Breaks button allows you add page breaks between all major sections in the report.
Toggle the Page Breaks button on or off to add or remove the page breaks between each section.
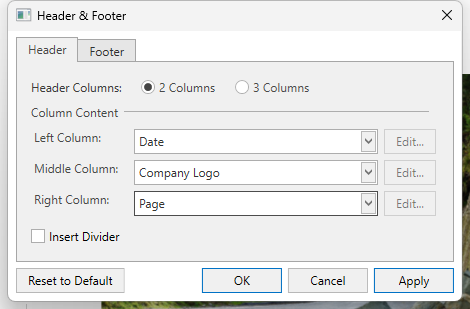
7.7 Header & Footer
A Header and Footer are automatically added to your report with relevant content including the Date, Project Name and other details.
To customize the content in your header and footer:
Click on the Header & Footer icon. A dialog will appear.
Click on the Header or Footer tab to select what section edit.
Use the radio buttons to decide the number of columns you wish to include in your header or footer.
Use the drop down menus to change what content appears.
Click Apply to apply the changes to your report.
Click Reset to Default to reset the header and footer to the default options.
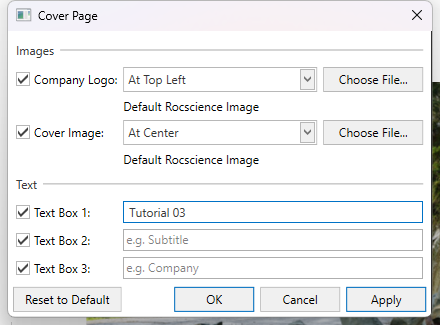
7.8 Cover Page options
When you launch the Report Generator a Cover Page is automatically created for your report.
To edit the contents of the Cover Page:
Click on the Cover Page button in the tool bar. A new dialog will appear.
Use the check boxes on the left to select what elements to include on the cover page.
Use the drop down menus to select the location and alignment of images.
Click the Choose File... button to change the logo and/or cover image and select your own image file.
You can edit the text in any of the three text boxes.
Once you have made the necessary changes, click OK to close the dialog and apply your changes.
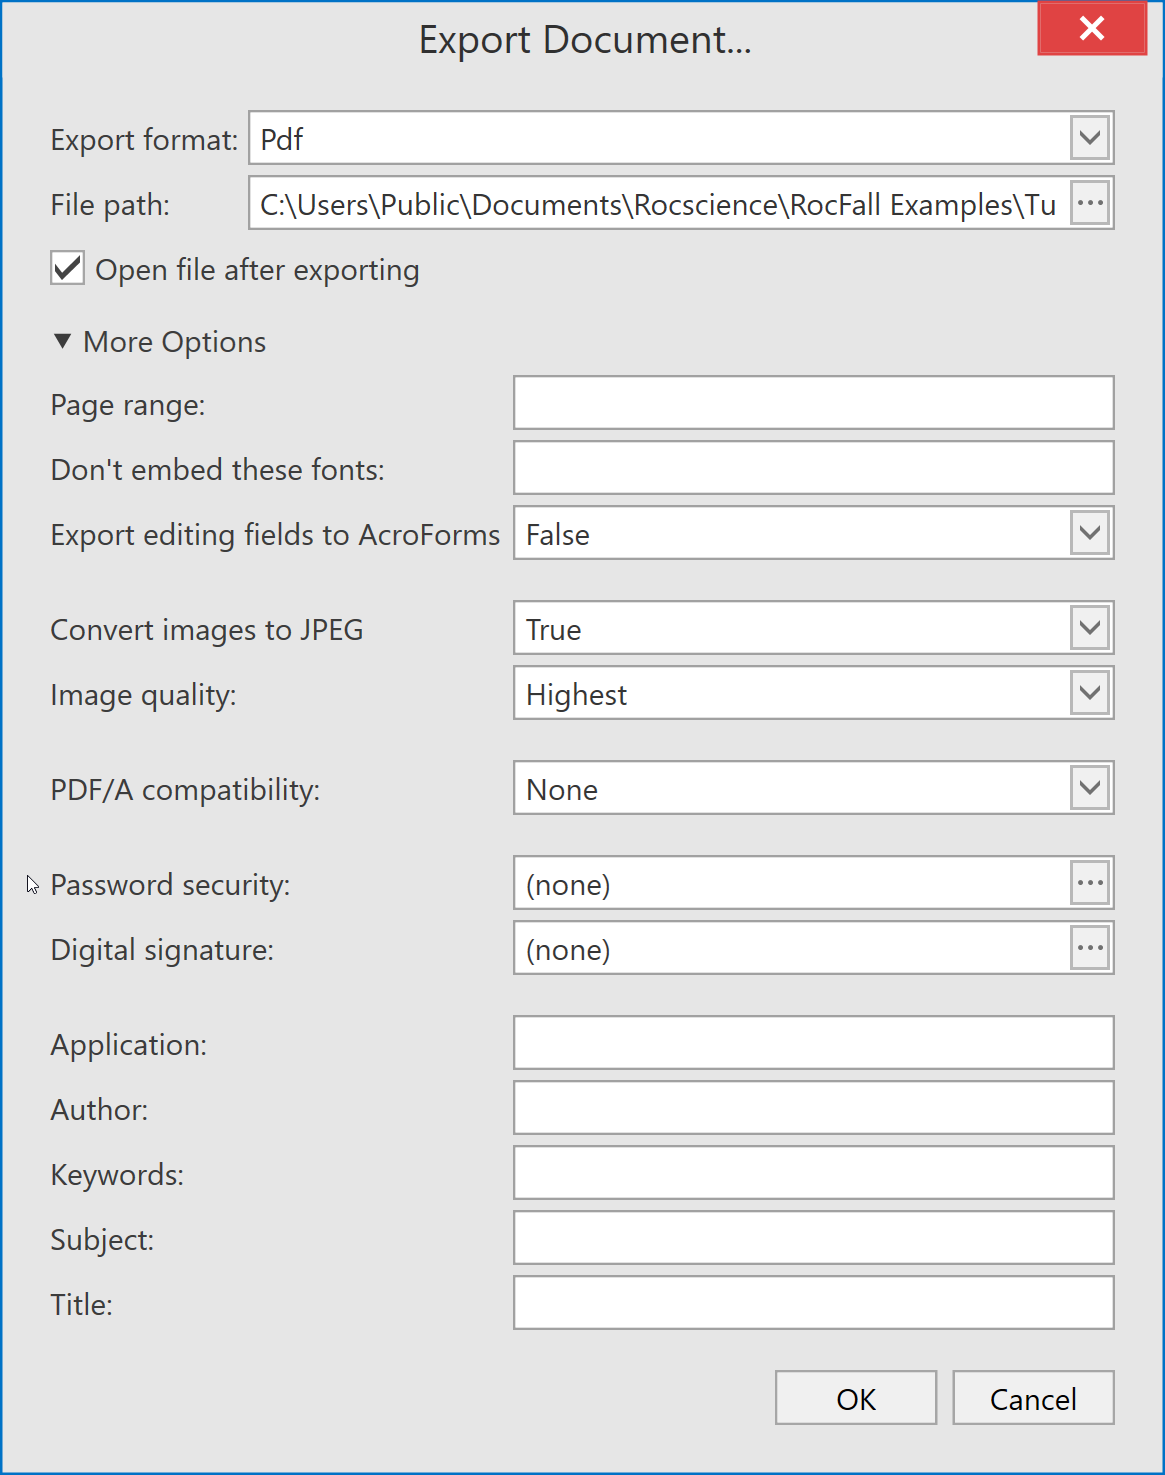
7.9 Export Options
When you have completed customizing your report, you have the option to export a digital copy of your report.
To export your report:
Click on the Export button in the tool bar.
Select PDF. A new dialog will appear. Export Document Dialog
Select the File path for your report.
Enter any additional details you wish to include by clicking More Options.
 button from the toolbar or the Analysis menu to run the analysis. The view will be switched to Results
  mode automatically.
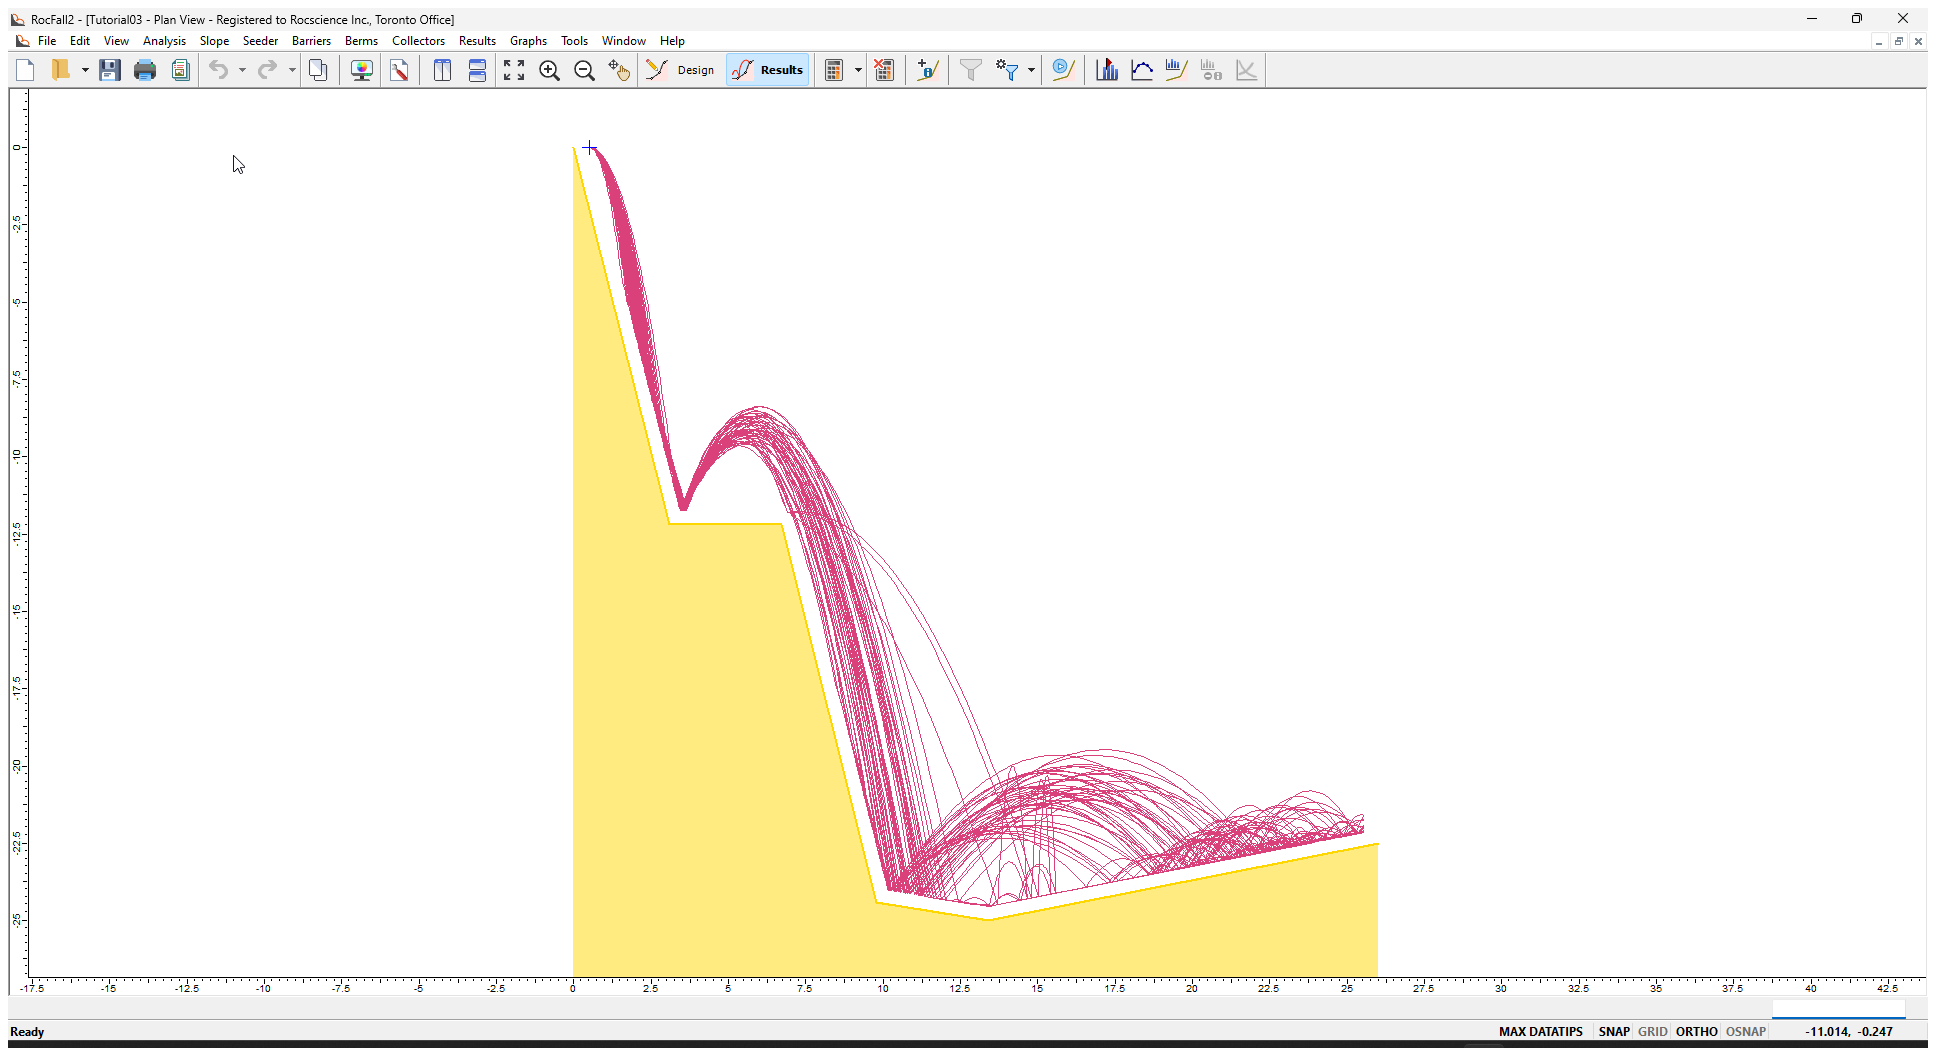
 on the toolbar.

 to open the Graph Endpoints dialog.
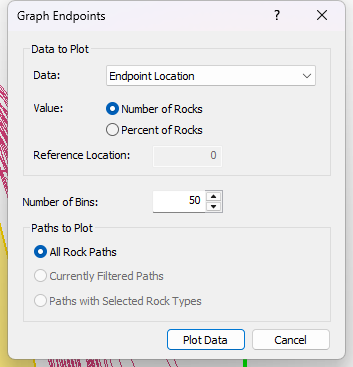


 icon in the tool bar.