In this tutorial we will demonstrate the Slope Roughness option for Rigid Body analysis in RocFall2. The Slope Roughness option allows you to generate physical geometric roughness along selected slope segments by defining spacing and amplitude statistical distributions for selected materials.
Topics Covered in this Tutorial:
Rigid Body analysis
Slope Roughness
Endpoint graphs
Finished Product:
The finished product of this tutorial can be found in the Tutorial 05 Slope Roughness data file. All tutorial files installed with RocFall2 can be accessed by selecting File > Recent Folders > Tutorials Folder from the RocFall2 main menu.
2.0 Model (NO Slope Roughness)
Let's start by opening the file for the tutorial:
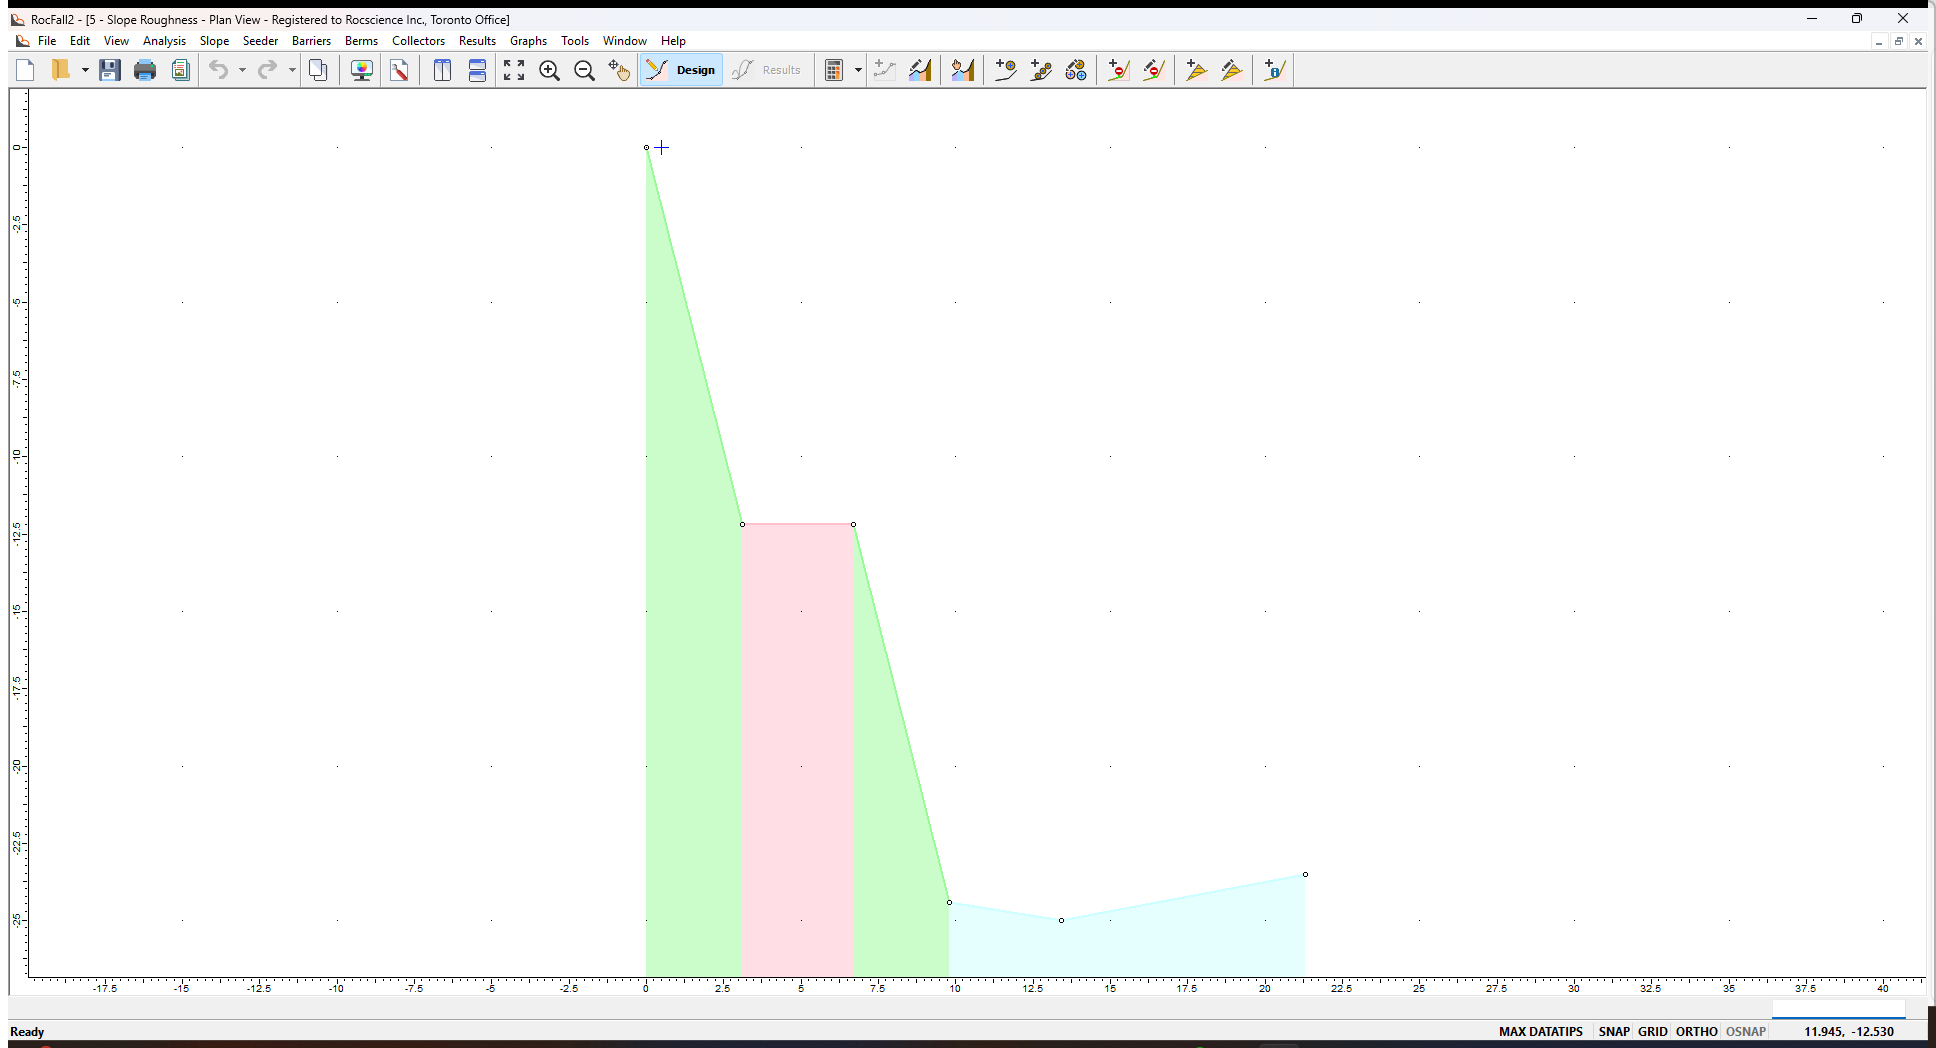
SelectFile > Recent Folders > Tutorials Folder and open the Tutorial 05 initial file. You should see the following model.
Initial RocFall2 model
All slope and rock properties have already been defined.
The Rigid Body rock shape is a 1000 kg sphere
Number of Rocks = 50
Slope Roughness is NOT enabled
Initial Horizontal Velocity = 1.5 m/s
Distribution = Normal
Std. Dev = 0.15 m/s
Rel. Min = 0.45 m/s
Rel. Max = 0.45 m/s
3.0 Results (NO Slope Roughness)
Now we'll compute to run the analysis and see results without any Slope Roughness assigned.
Select the Compute button from the toolbar or the Analysis menu.
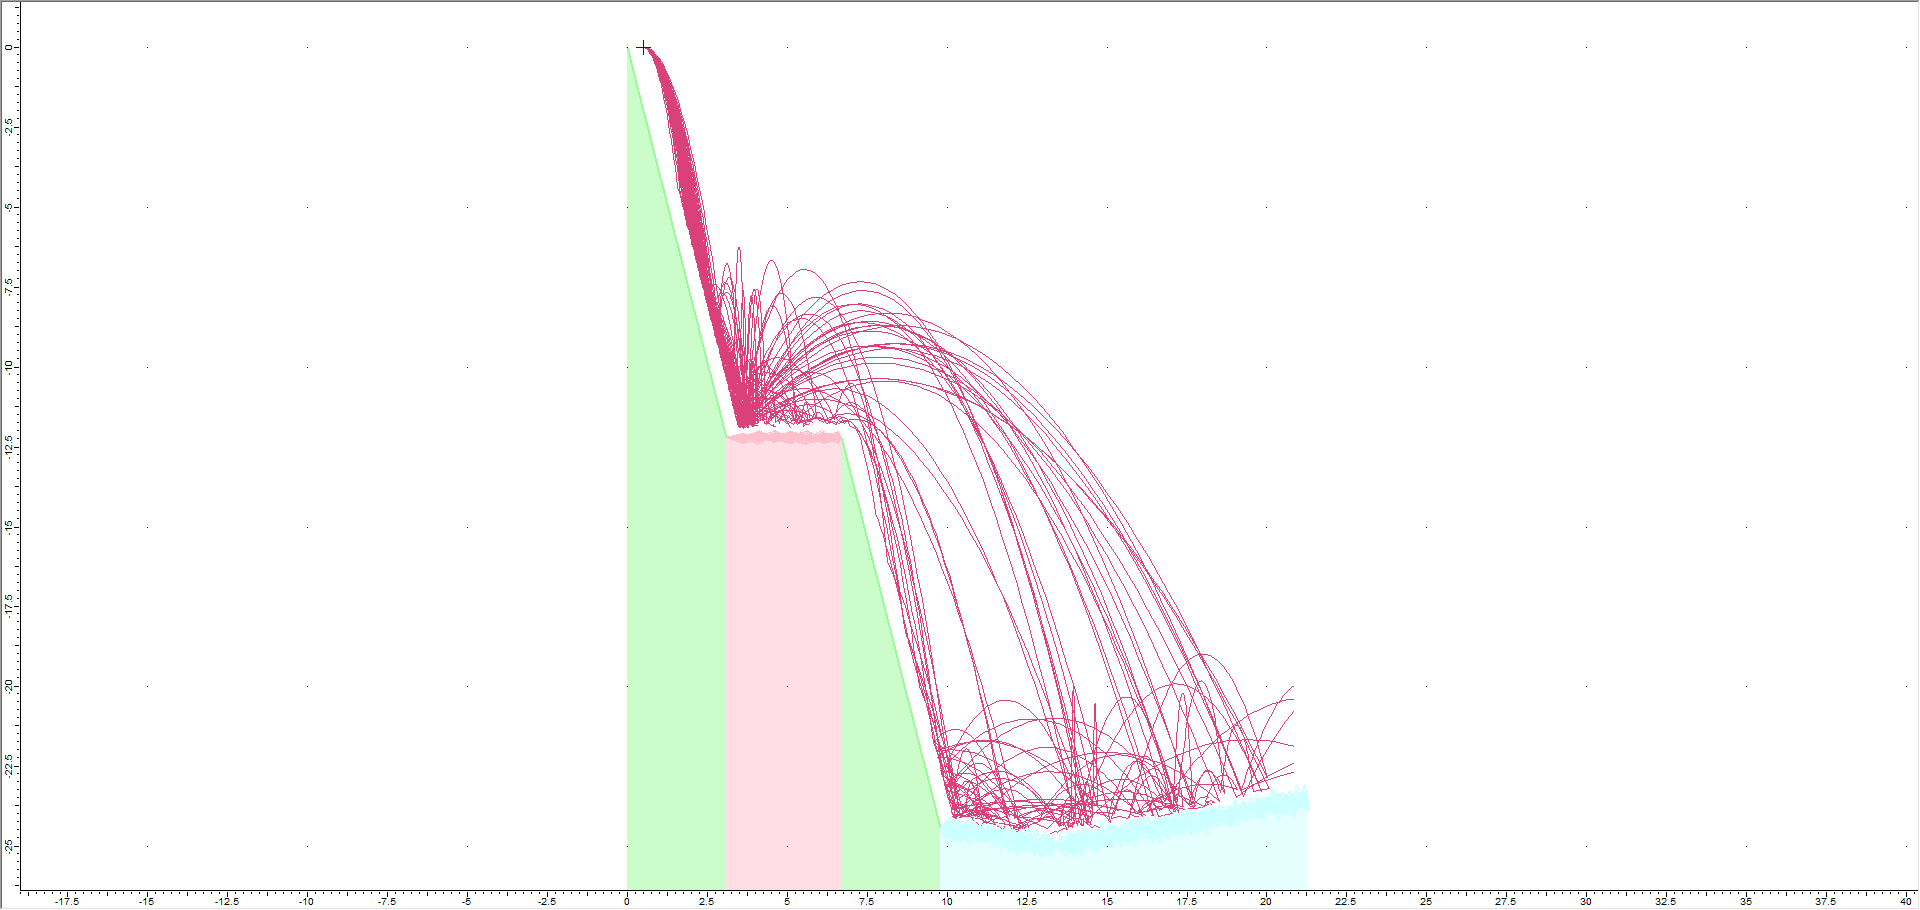
RocFall2 Results view with no slope roughness
3.1 GRAPH ENDPOINTS
Next we'll generate an Endpoints graph of results.
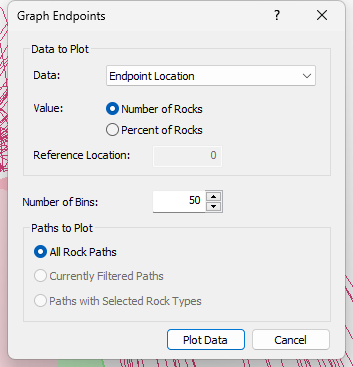
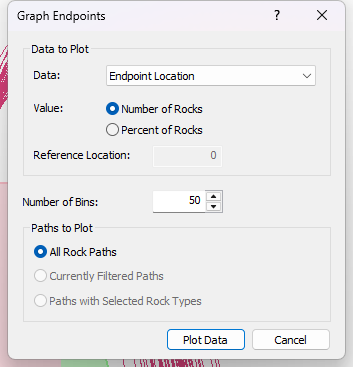
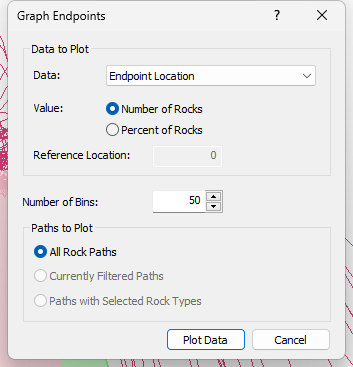
Select Graph Endpointson the toolbar or the Graphs menu. The Graph Endpoints dialog should appear.
Set Data = Endpoint Location.
Set Value = Number of Rocks.
Set Number of Bins = 50.
Set Paths to Plot = All Rock Paths.graph end points dlg
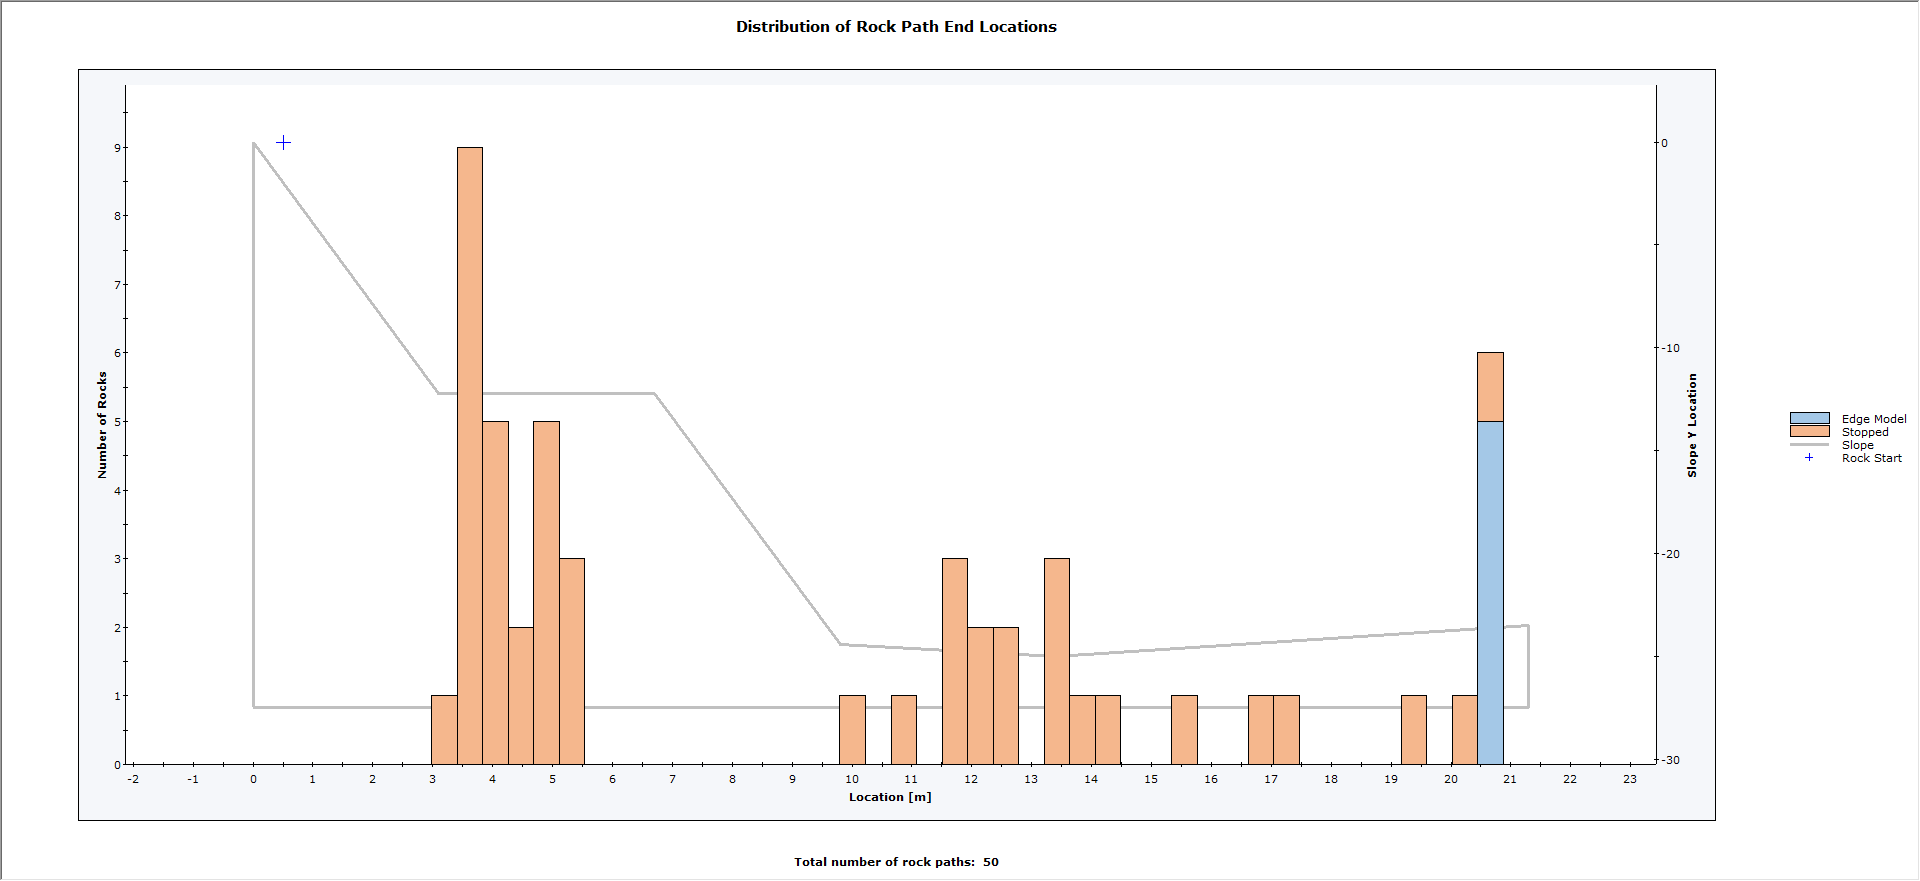
Select Plot Data to generate the Distribution of Rock Path End Locations graph.
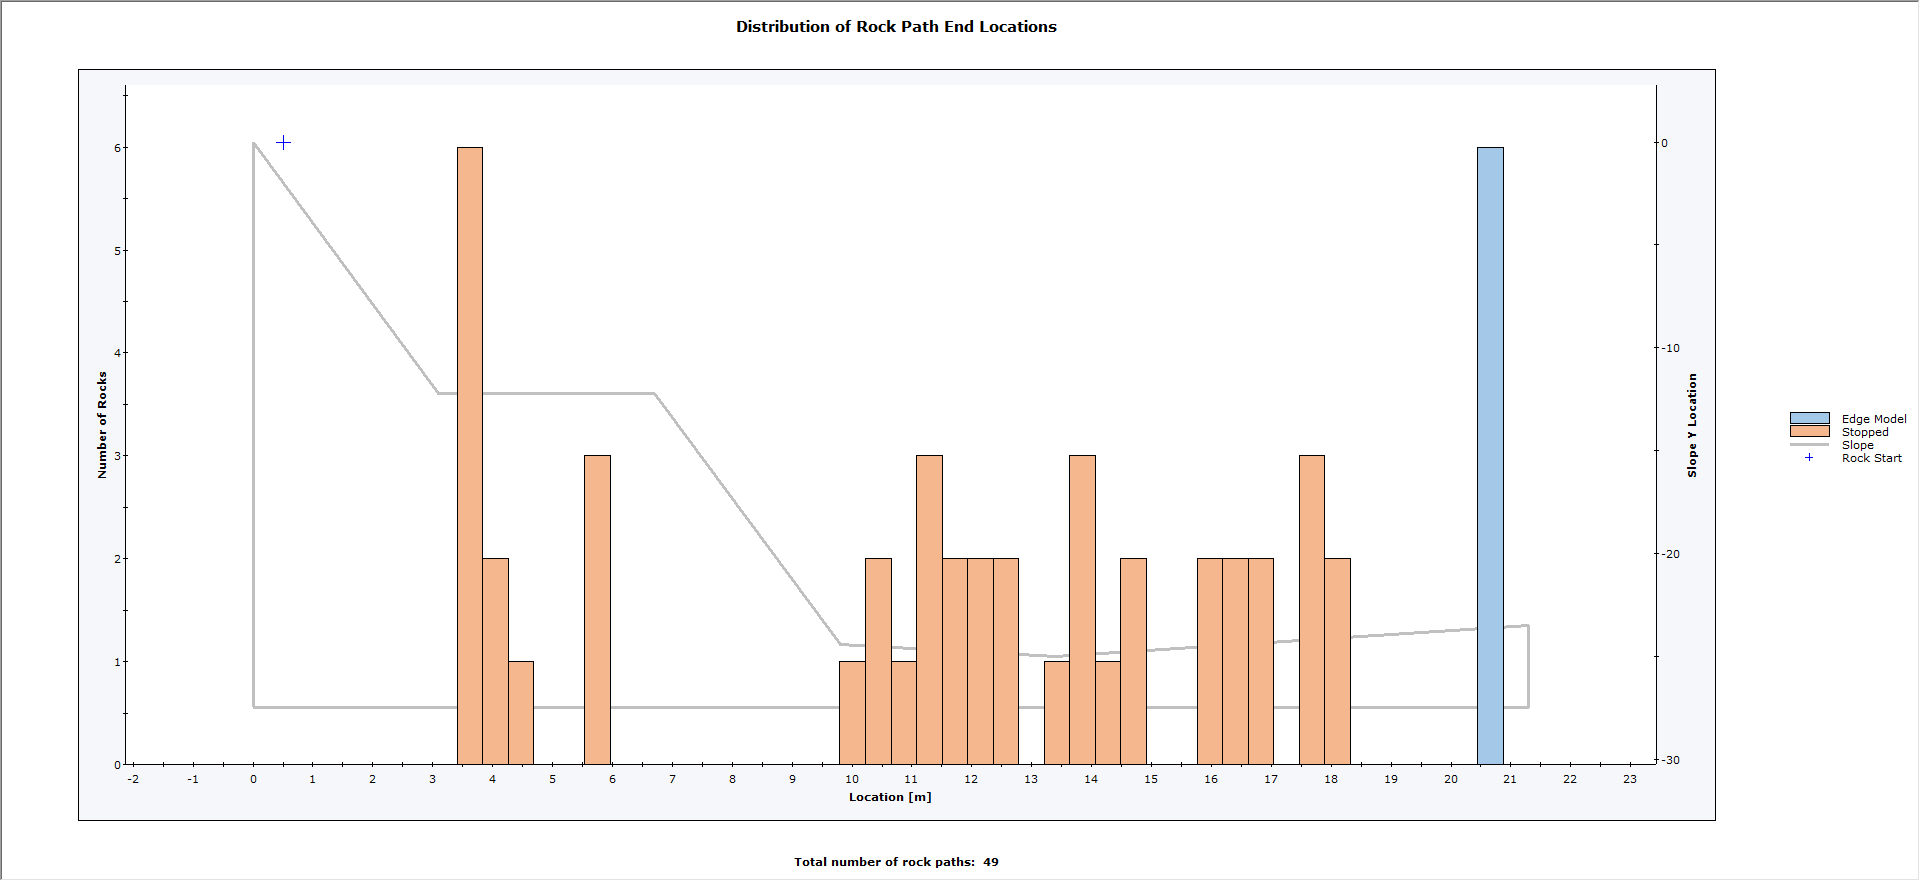
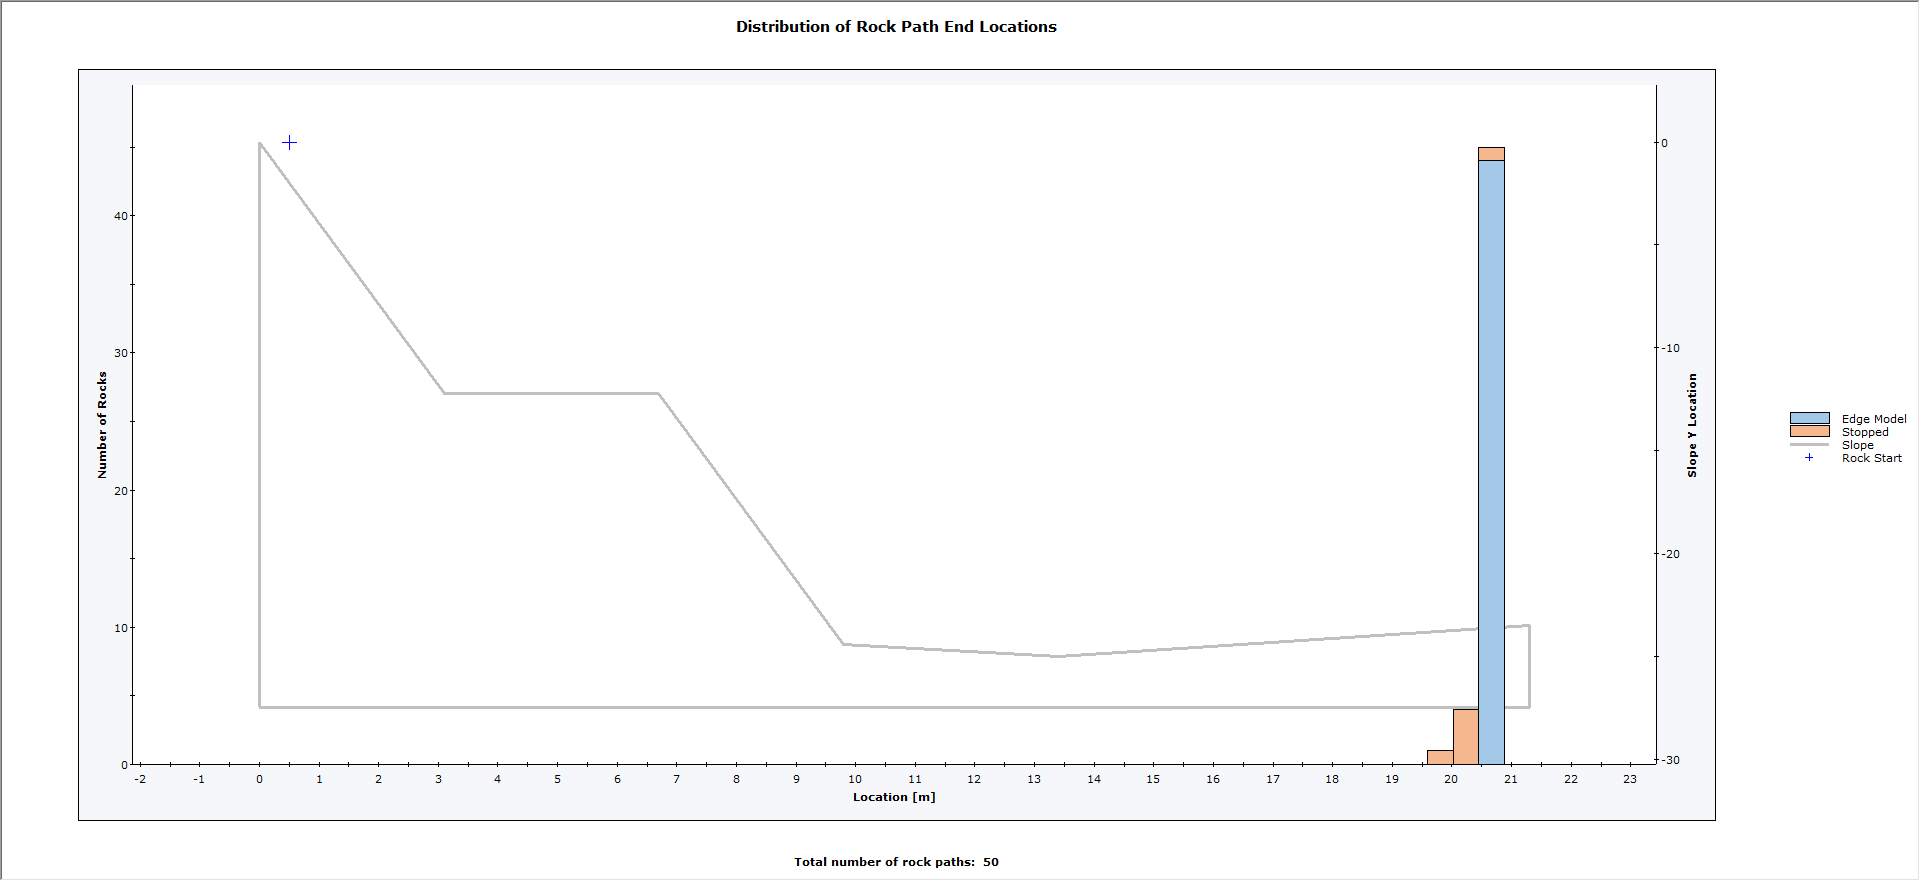
Right-click on the graph and click Toggle End Reasons. You should see the following graph.
As you can see, most of the rocks have simply reached the end of the model without stopping. These are paths are indicated by "Edge Model".
4.0 Slope Roughness
We’ll now look at how adding Slope Roughness will affect the results. Slope Roughness is added using the Slope Material Library.
Select: Slope > Slope Material Library
Switch back toDesign mode.
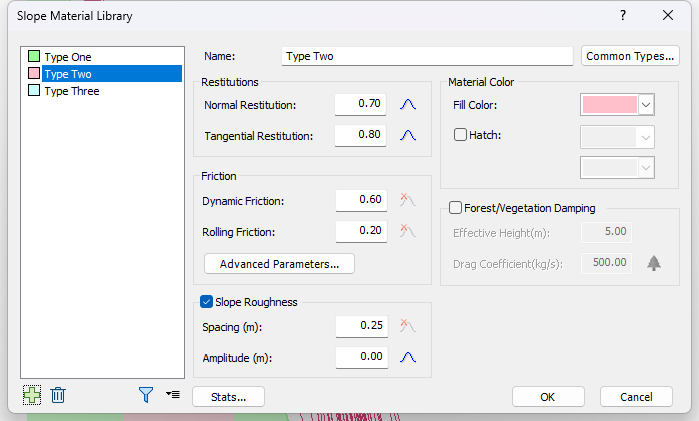
Select Slope Material Library on the toolbar or the Slope menu.
Select the Type Two material.
Select the Slope Roughness check box.
Keep Spacing = 0.20 m.
Distribution = None
Keep Amplitude =0.00 m
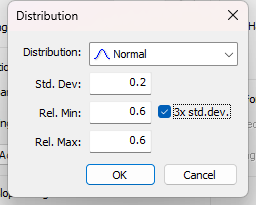
Distribution = Normal
Std. Dev = 0.2 m
Rel. Min = 0.6 m
Rel. Max = 0.6 m
Follow the same steps for material Type Three.
Select OK.
5.0 Results (Slope Roughness)
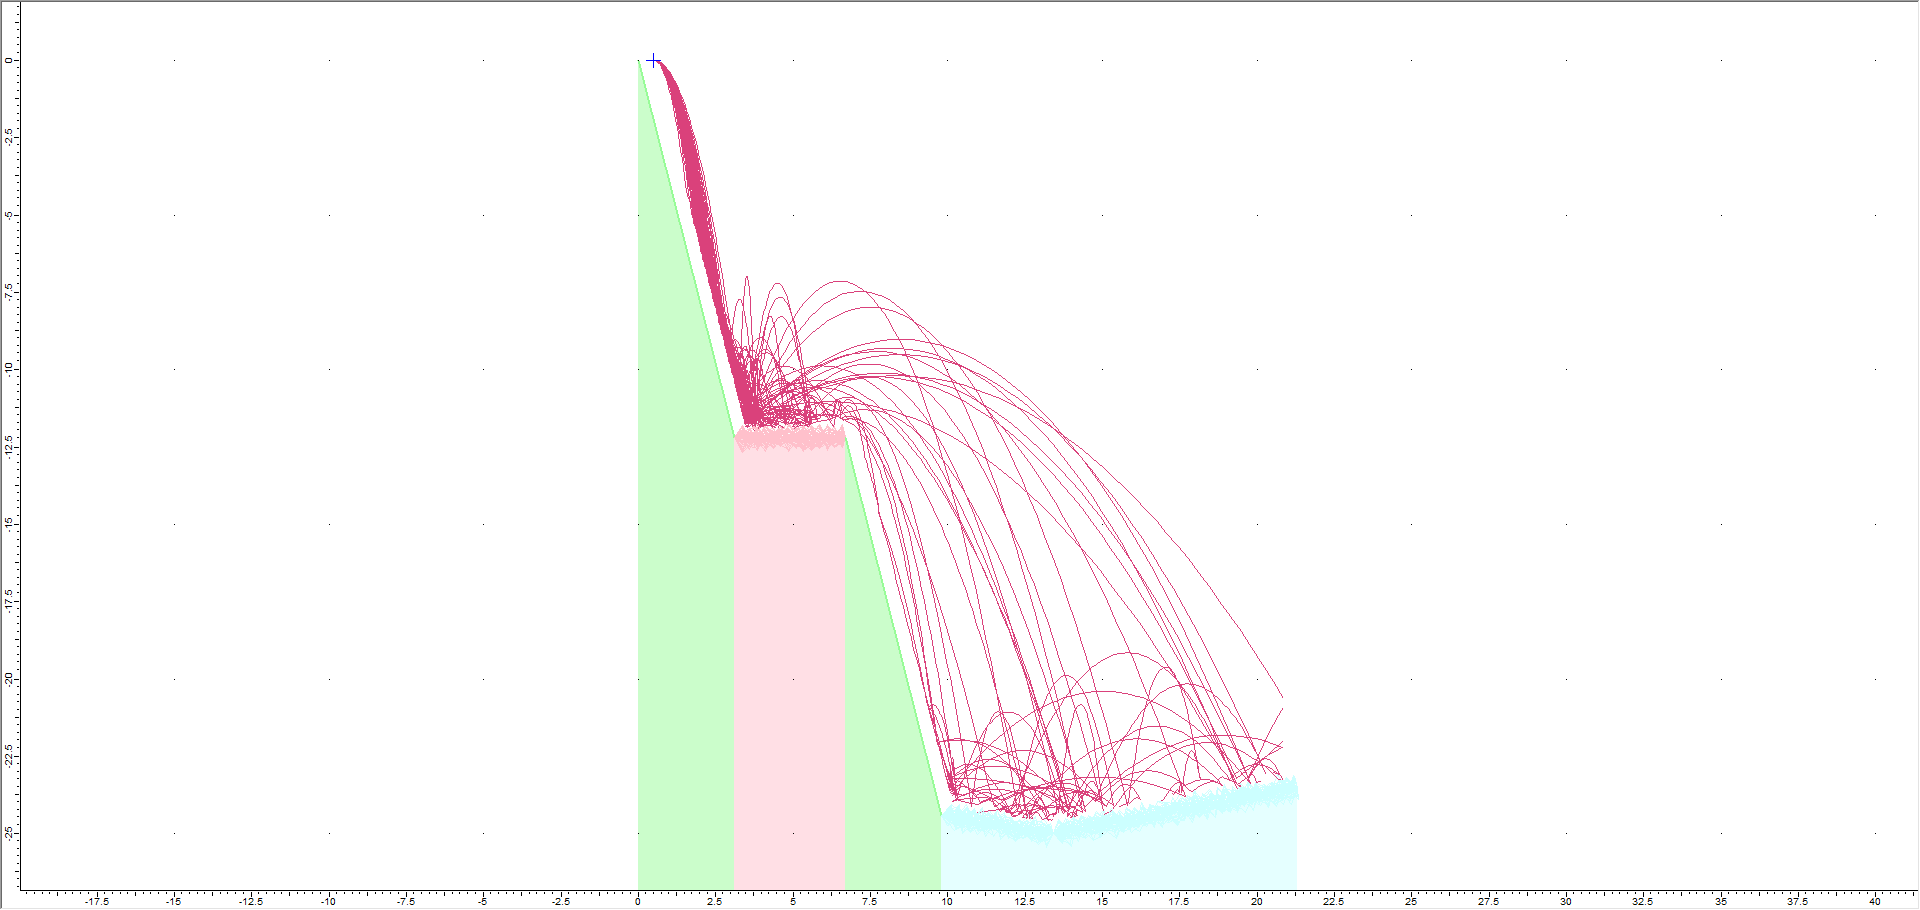
Now we'll Compute and view results with Slope Roughness added. You should note that the rockfall paths differ significantly from the model with no Slope Roughness.
RocFall2 Results view with slope roughness
Next we'll generate an Endpoints graph to compare it with the one we generated above with no Slope Roughness.
Select Graph Endpointson the toolbar or the Graphs menu. The Graph Endpoints dialog should appear.
Set Data = Endpoint Location.
Set Value = Number of Rocks.
Set Number of Bins = 50.
Set Paths to Plot = All Rock Paths.
Select Plot Data to generate the Distribution of Rock Path End Locations graph.
Right-click on the graph and click Toggle End Reasons. You should see the following graph.
The rock endpoint graph is very different compared to the model with no Slope Roughness. Many rocks have come to rest on the upper bench and bottom of the slope, although some still reach the end of the model.
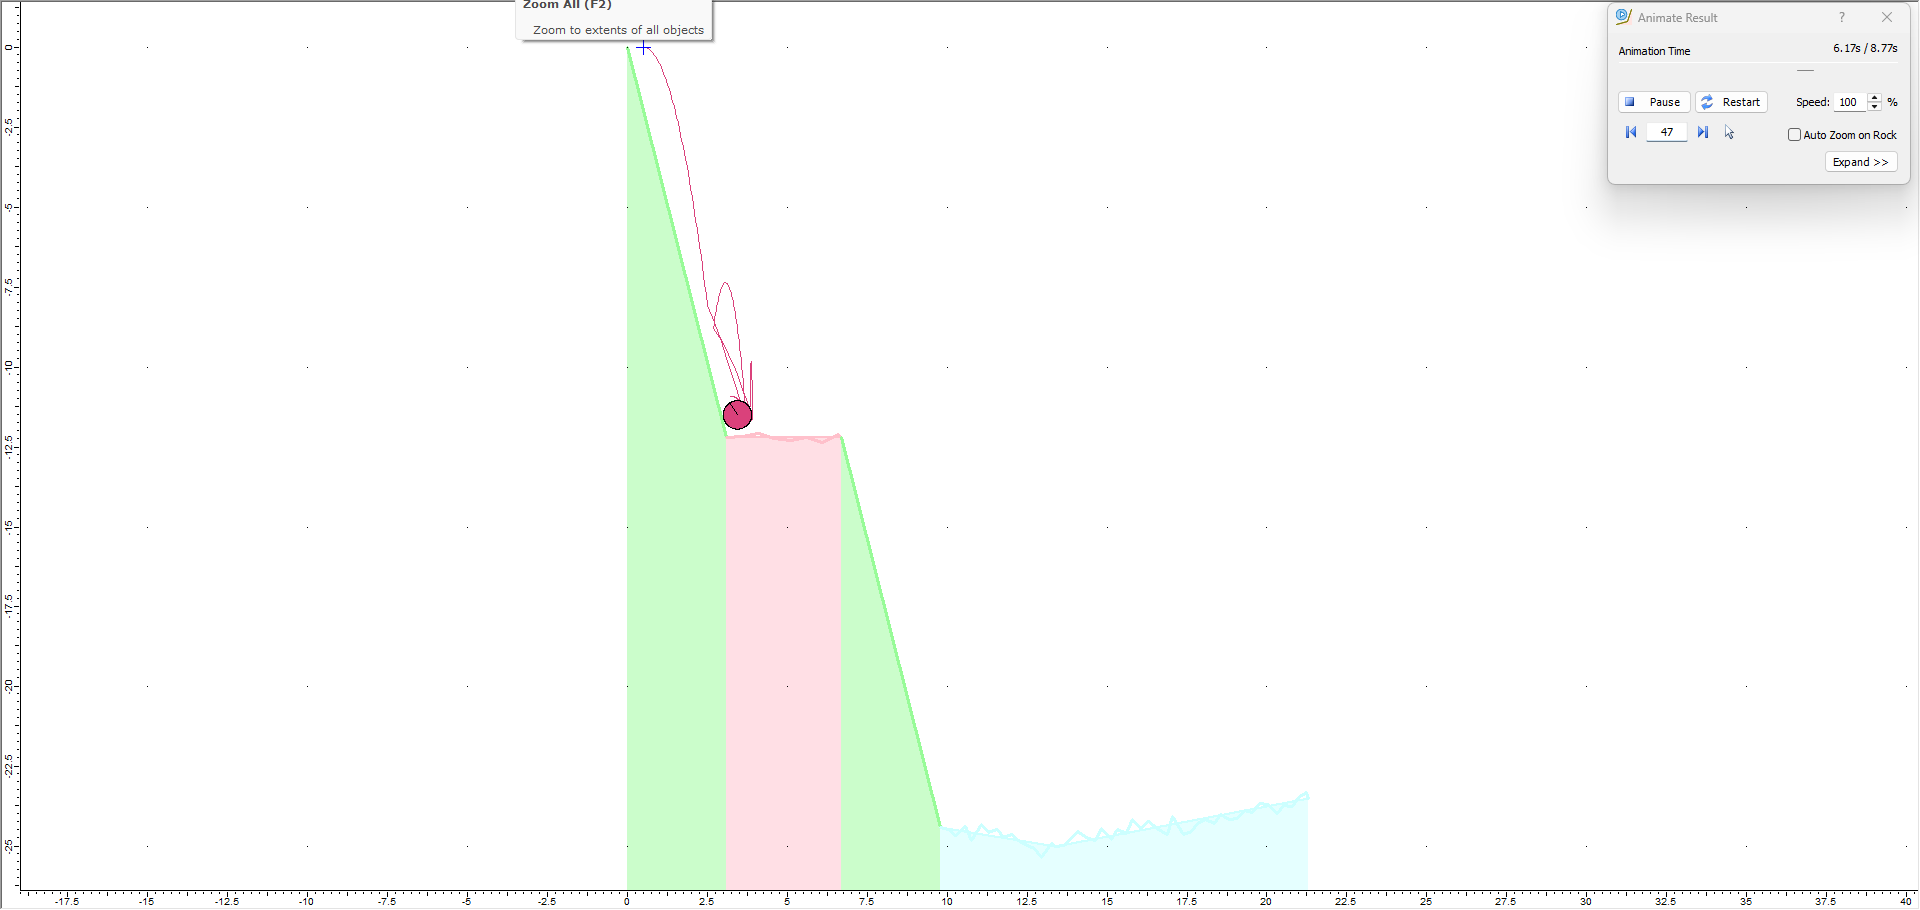
5.1 ANIMATE PATHS
Now we'll use the Animate Path option to view the rock fall.
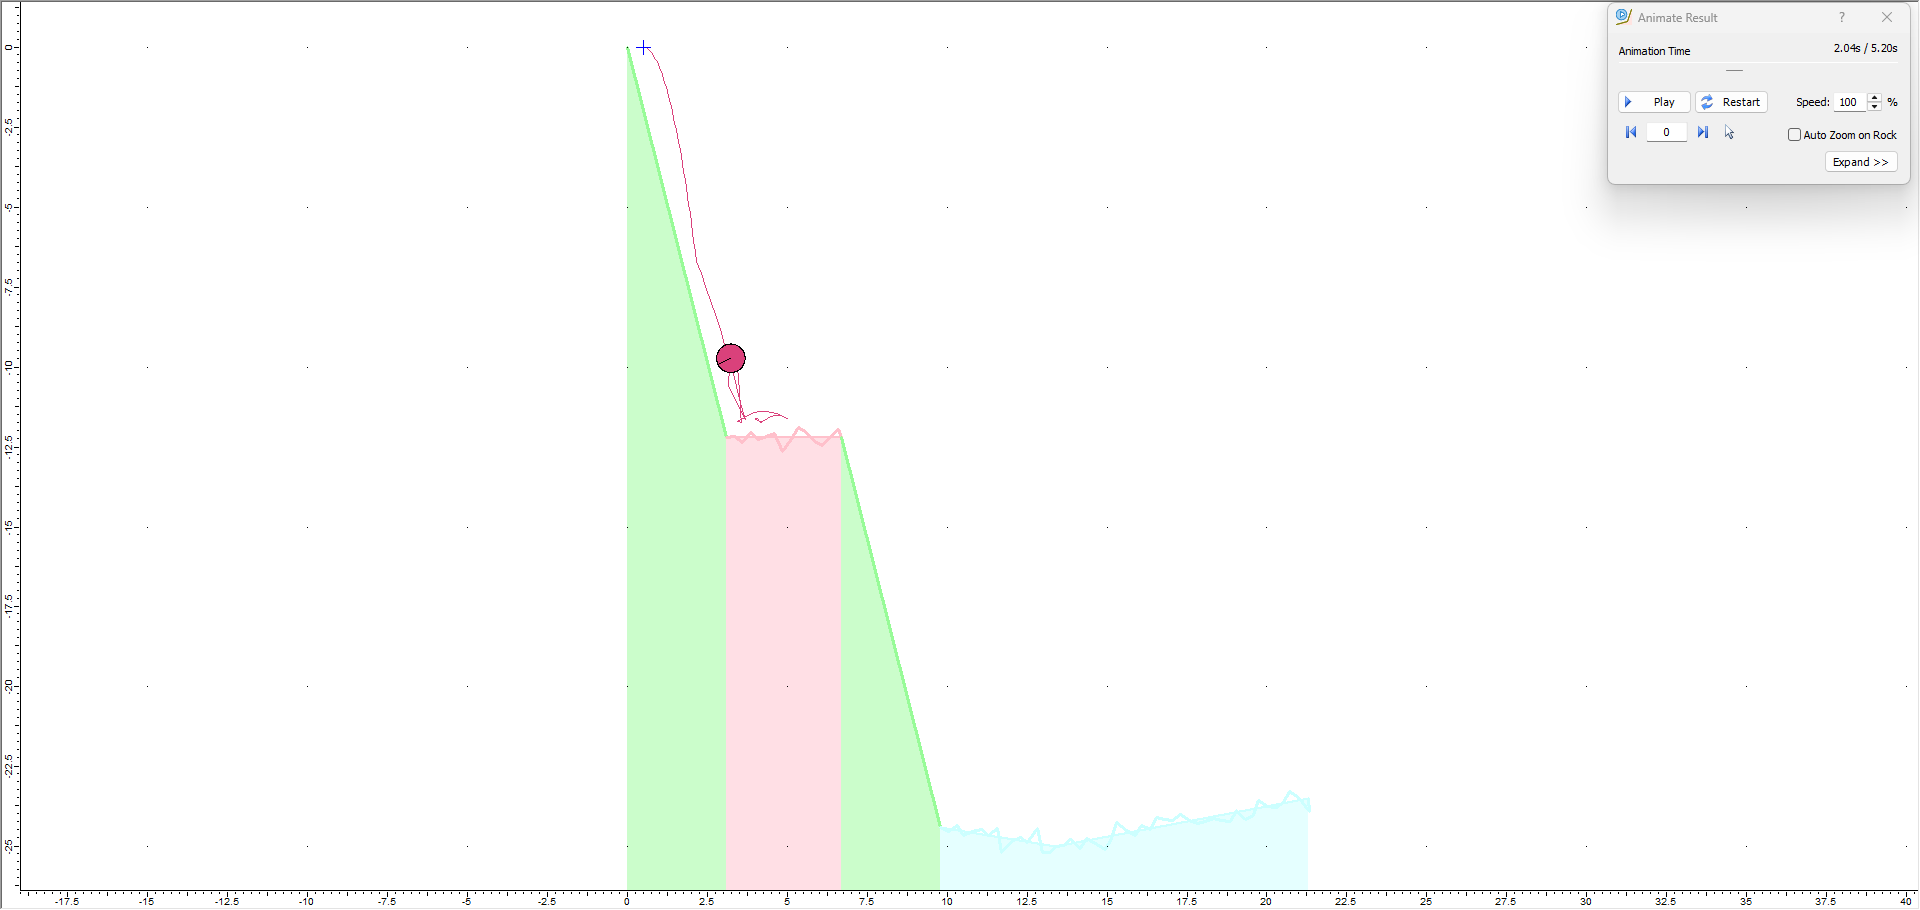
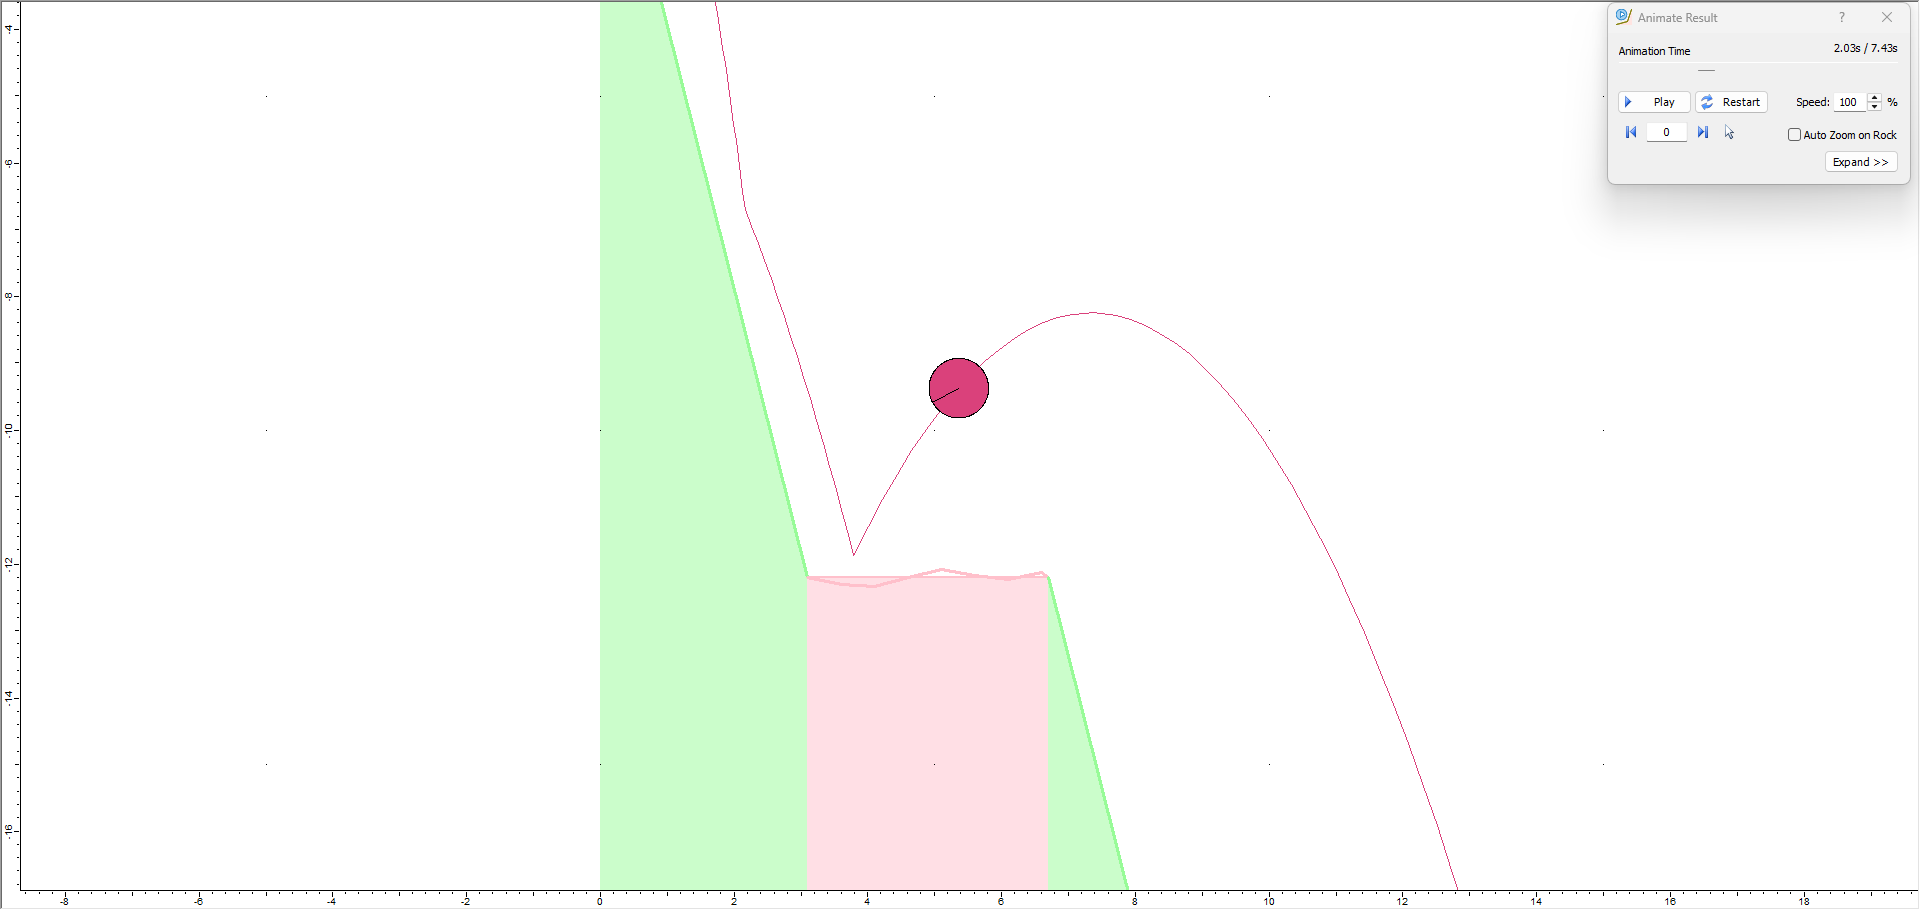
Select Animate Path on the toolbar or the Results menu and zoom in if necessary.
In the Animate Result dialog, click through each rock path using the forward arrow beside the rock ID number.
NOTES:
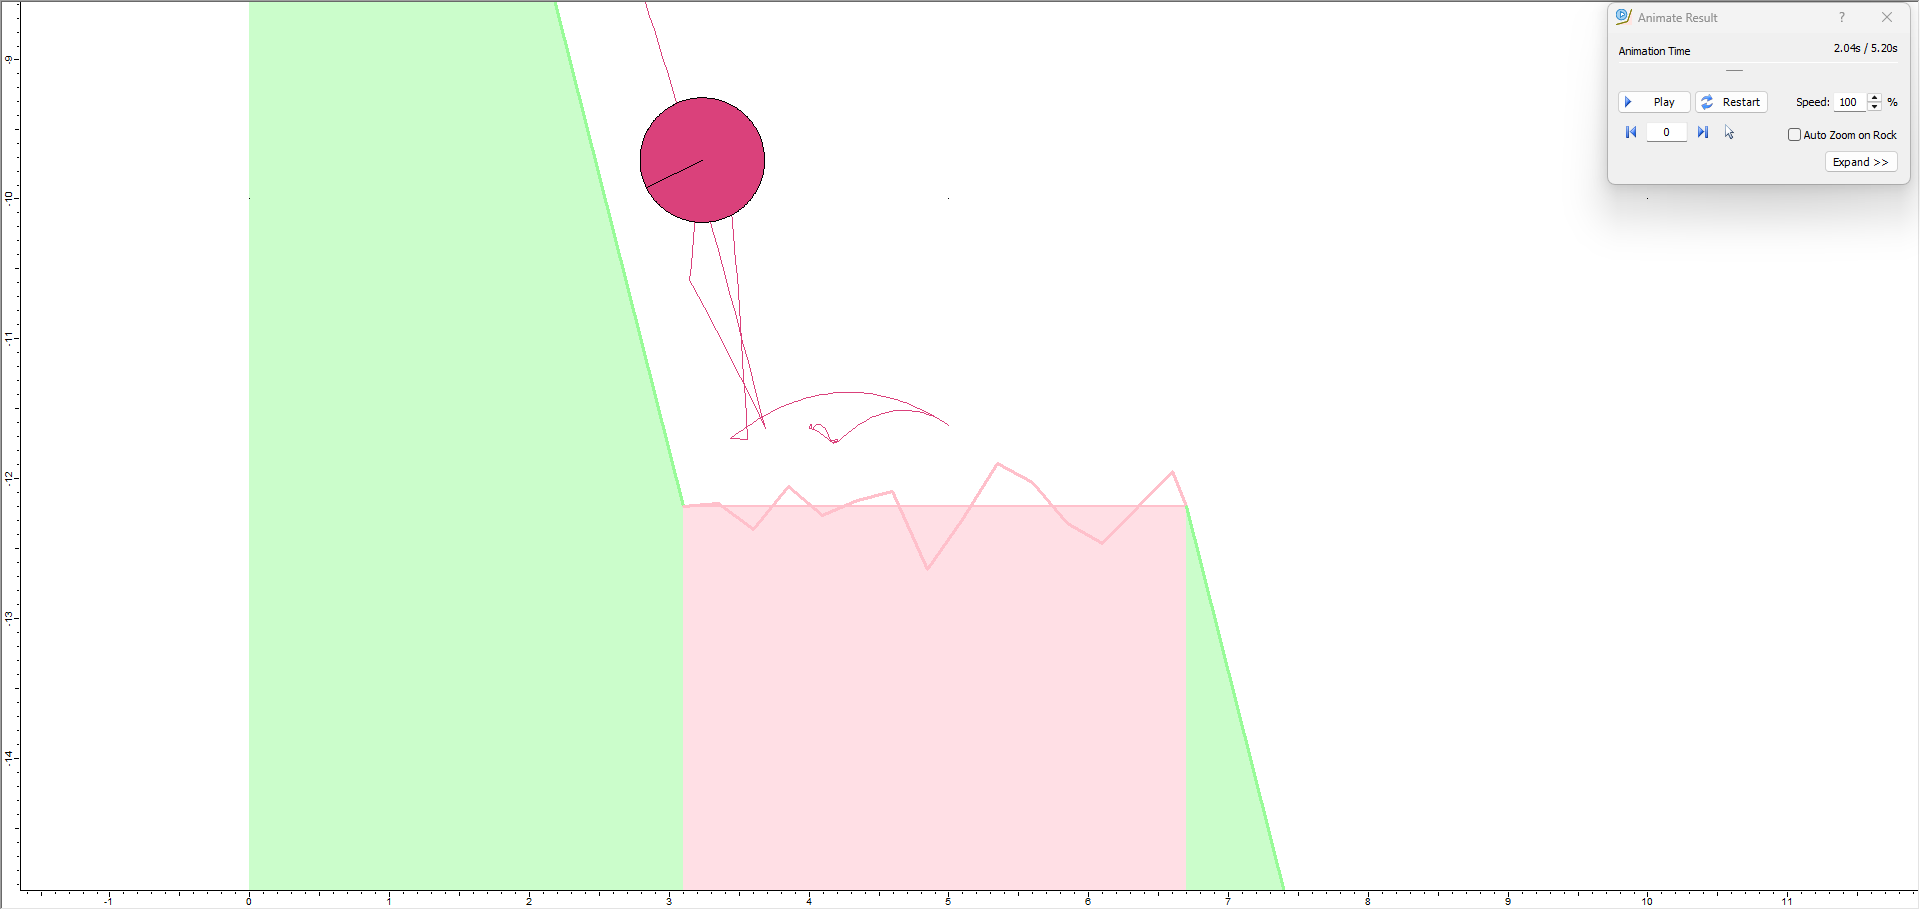
Notice that, each time you view a new rock path, you can see the actual Slope Roughness generated for each rock throw. The Slope Roughness is randomly generated according to the Spacing and Amplitude statistics you defined above.
As you view the different rock paths, notice the actual Slope Roughness generated for the Type Two and Type Three material segments. For the spacing and amplitude values we have entered, the physical roughness is very jagged and not very realistic for an actual slope surface.
6.0 Modify Slope Roughness Parameters
Let’s modify the Slope Roughness parameters and re-run the analysis to achieve a more realistic modeling of the surface roughness.
Switch back to Design mode.
Select Slope Material Library on the toolbar or the Slope menu.
Select the Type Two material.
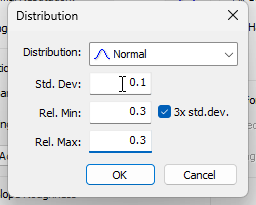
Set Spacing = 0.5 m and Distribution = None.
Change Std. Dev: for Amplitude = 0.1 m.
Select the Type Three material and repeat the steps above.
Click OK.
7.0 Results (Modified Slope Roughness Parameters)
Now we'll Compute and view results with Slope Roughness parameters modified.
RocFall2 Results view with modified slope roughness parameters
The rock paths look similar to the previous model. Let’s now generate an Endpoints graph for further comparison.
Select Graph Endpointson the toolbar or the Graphs menu. The Graph Endpoints dialog should appear.
Set Data = Endpoint Location.
Set Value = Number of Rocks.
Set Number of Bins = 50.
Set Paths to Plot = All Rock Paths.
Select Plot Data to generate the Distribution of Rock Path End Locations graph.
Right-click on the graph and click Toggle End Reasons. You should see the following graph.
NOTE:
Compare the distribution of endpoints to the previous model and compare the End Reasons. With the reduced Slope Roughness, a greater proportion of rocks have stopped, fewer rocks have wedged, and we have eliminated the Chattering End Reason, which is a numerical issue where rocks have essentially stopped but continue to move slightly and must be arbitrarily stopped. It is preferable that Chattering be avoided, if possible.
7.1 ANIMATE PATHS
Now we'll use the Animate Path option to view the rock fall.
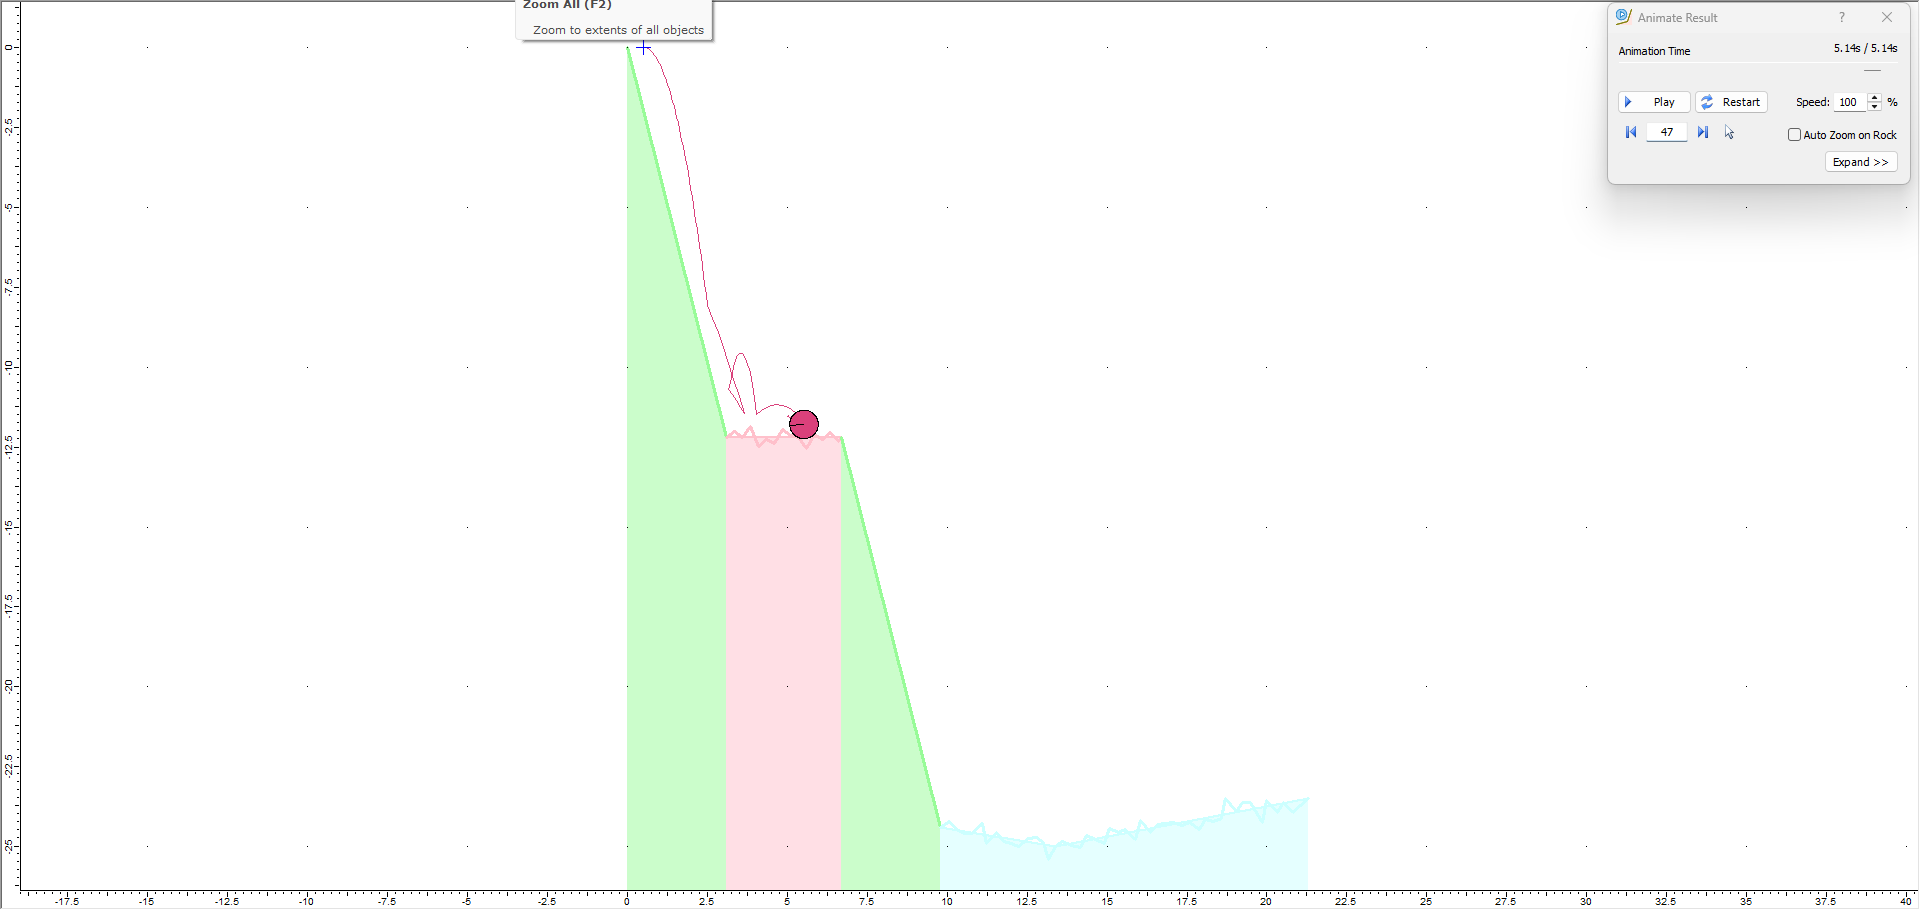
Select Animate Path on the toolbar or the Results menu and zoom in if necessary.
In the Animate Result dialog, click through each rock path using the forward arrow beside the rock ID number.
Observe the slope roughness generated with the new spacing and amplitude parameters for each rock path.
NOTES:
In general, the modified Slope Roughness parameters (increased Spacing and decreased Amplitude variability) give a more realistic slope surface roughness.
To achieve a realistic surface roughness, it is recommended that you always experiment with the Spacing and Amplitude parameters, and observe the generated surfaces in order to simulate the actual field conditions as closely as possible.
 button from the toolbar or the Analysis menu.
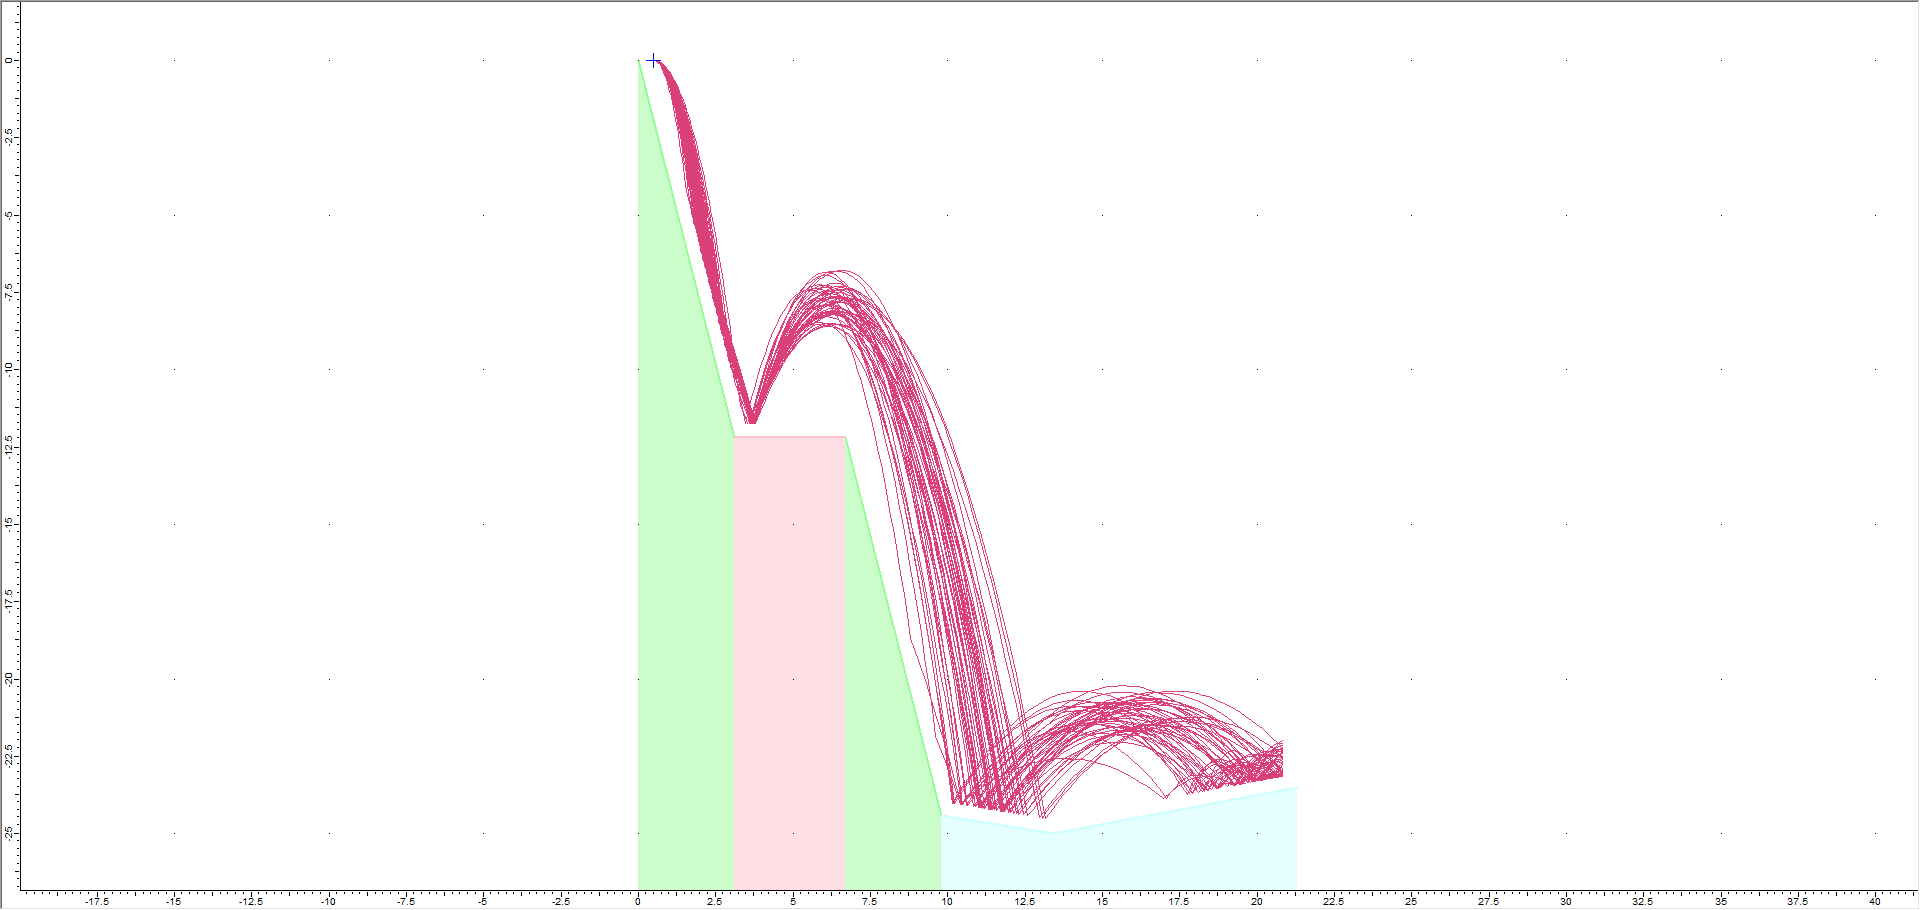


 on the toolbar or the Results menu and zoom in if necessary.