Latest Features in RS3
RS3 is a dynamic 3D Finite Element Analysis program designed to help you seamlessly analyze the most complex 3D models. RS3 can be used for a variety of applications which include dams, excavations, mining, tunneling and more.
Stay up to date with the latest features and integrations that you can incorporate into your geotechnical projects.
January 2023
RS3's New SYSDAM Data Import
It can be tricky to evaluate a large set of Piezometric data if you don’t have the option to filter the records that are relevant to you. RS3’s latest release (4.027) includes the SYSDAM Data Import feature which allows you to:
- Import your water table with piezometric readings into RS3
- Specify a particular date and time for tracking the water level
- Monitor how the water levels are fluctuating
- Help you determine factor of safety
SYSDAM Data Import Feature in action
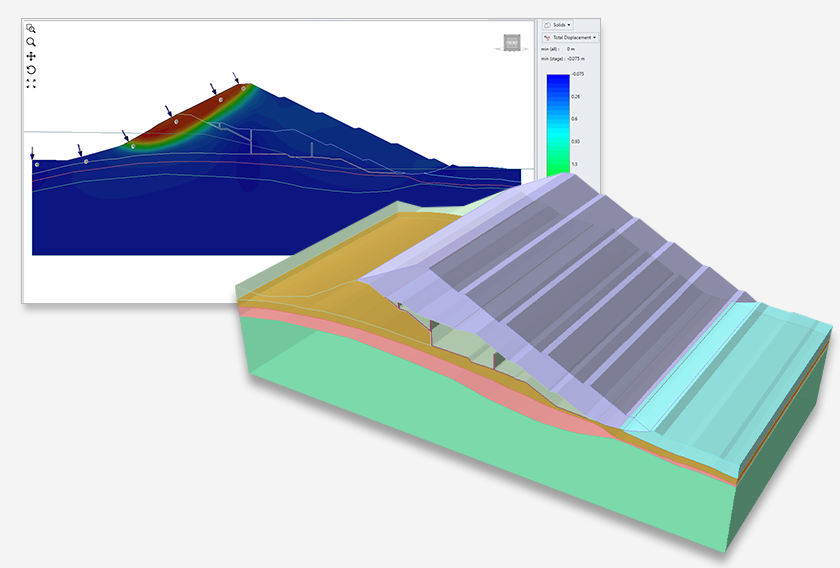
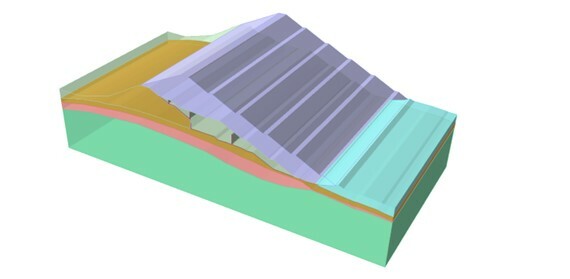
The goal of this model is to calculate the factor of safety of the tailing dam, while the water table is increasing upstream, and the calculation is done considering four different cases –
- When the model is dry
- When the water is at a low level same as downstream
- The water is at the intermediate level
- The water is at the highest level behind the dam
Import your Piezometer data using the SYSDAM data import option in a few steps.
- Go to Groundwater>Add Water by Location
- Click Import
- Change the data type to SYSDAM data and pick the file and then click Open
- In the new window, pick the desired data and the program would display all available piezometric data at that time, then click Ok
- All available data would display in the sheet. By clicking Ok, the water table at the desired time would be created in the model
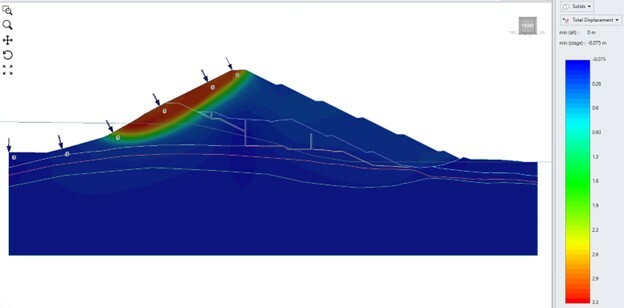
Results: In this analysis, 10-noded tetrahedral elements were used and the ponded water load is applied so that the weight of water is included in the analysis. Results obtained from the experiments done on all four cases are shown below.

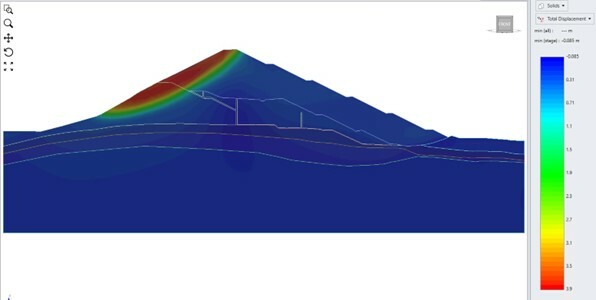
Result Discussion
The factor of safety for the dry model and the case when the water level is low are identical since the failure surface is happening to be completely above the water table. By increasing the water table, the effective stress is reduced for the underlying regions, and it leads to a lower factor of safety in the third case (SRF=1.38).
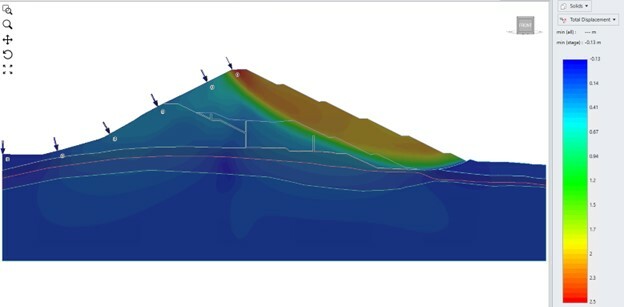
However, when the water reaches the highest level, the weight of the water (which is applied using ponded water load in RS3), increases the compressive stress to the model and it makes more resistance for the upstream against failure. This phenomenon directs the failure surface downstream, but with a higher factor of safety (SRF=1.74).
February 2022
Liner Local Coordinates in RS3
Earlier when analyzing liners that were not aligned with the global coordinate system, you would have to first export liner results out of RS3 and then manually convert the results to their desired local coordinate system and then use these values for the design. This was not only a time-consuming process but also had scope for error. Additionally, it was found to be difficult to export liner data at critical locations, and often, you would need to export liner data of a large area on which you would perform post-processing to analyze only the key pieces of data.
Introducing Liner Local Coordinates.
With the presence of the liner results in the local coordinate system, you are better equipped to analyze your models and designs and since analysis is iteratively performed to optimize designs, the ability to add liner local coordinates is a vital tool that will help to speed up your design process.
Benefits of Liner Local Coordinates
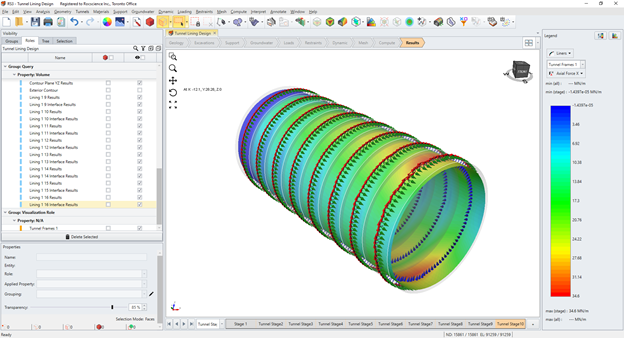
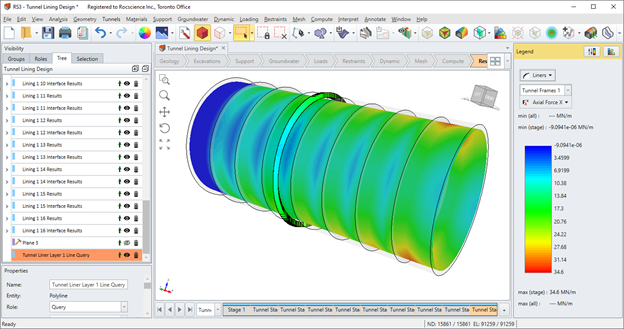
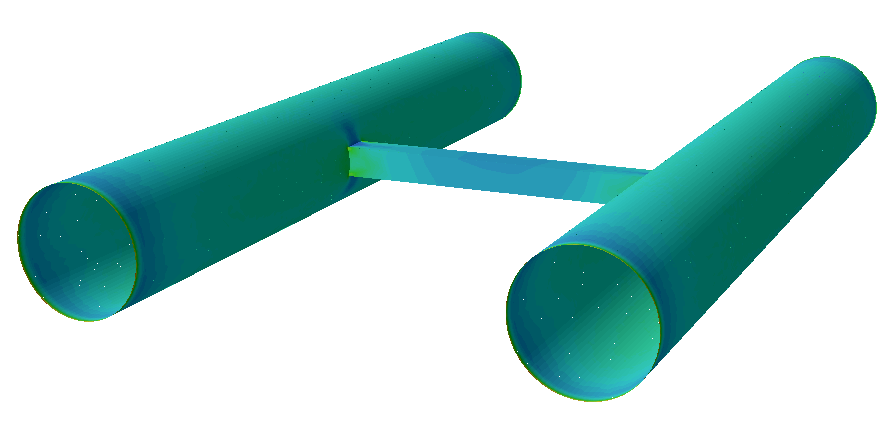
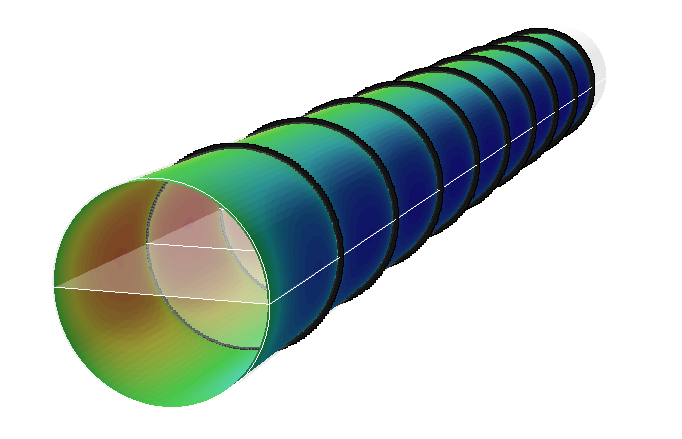
For design purposes, liner displacements, axial forces, shear forces, and bending moments are most useful in the local coordinate system of the liner. For instance, when it comes to a tunnel application, it is beneficial to convert liner results to the local coordinate system which now you can define. Engineers can also take advantage of the new liner line query options to better analyze data at critical locations.
How to use Liner Local Coordinates?
Defining Liner Local Coordinates – To define Liner Local Coordinates, you must select Liners under the Support Menu and then select Define Liner Local Coordinates. There are two ways to define the local line coordinates:
- Define Liner Local Coordinates – one local coordinate system is defined for all liners which are useful for walls that follow one orientation for the entire model
- Define Liner Local Coordinates for Tunnels – a set of local coordinate systems is defined for the selected faces based on the orientation of each face which is useful for tunnels
To understand this process step-by-step, click here
Querying Liner Data – You can also view liner results and query liner data in the local coordinate system by using one of the following options:
- Add liner line query - convert any line query to a liner line query
- Add liner line query at intersection - liner line query created by intersecting liners with a plane
- Add liner line query to surface - liner line query created by projecting a polyline onto a surface
We have also put together a tutorial on Liner Local Coordinates process for a tunnel model that you can access from here.
January 2021
New User Data Options
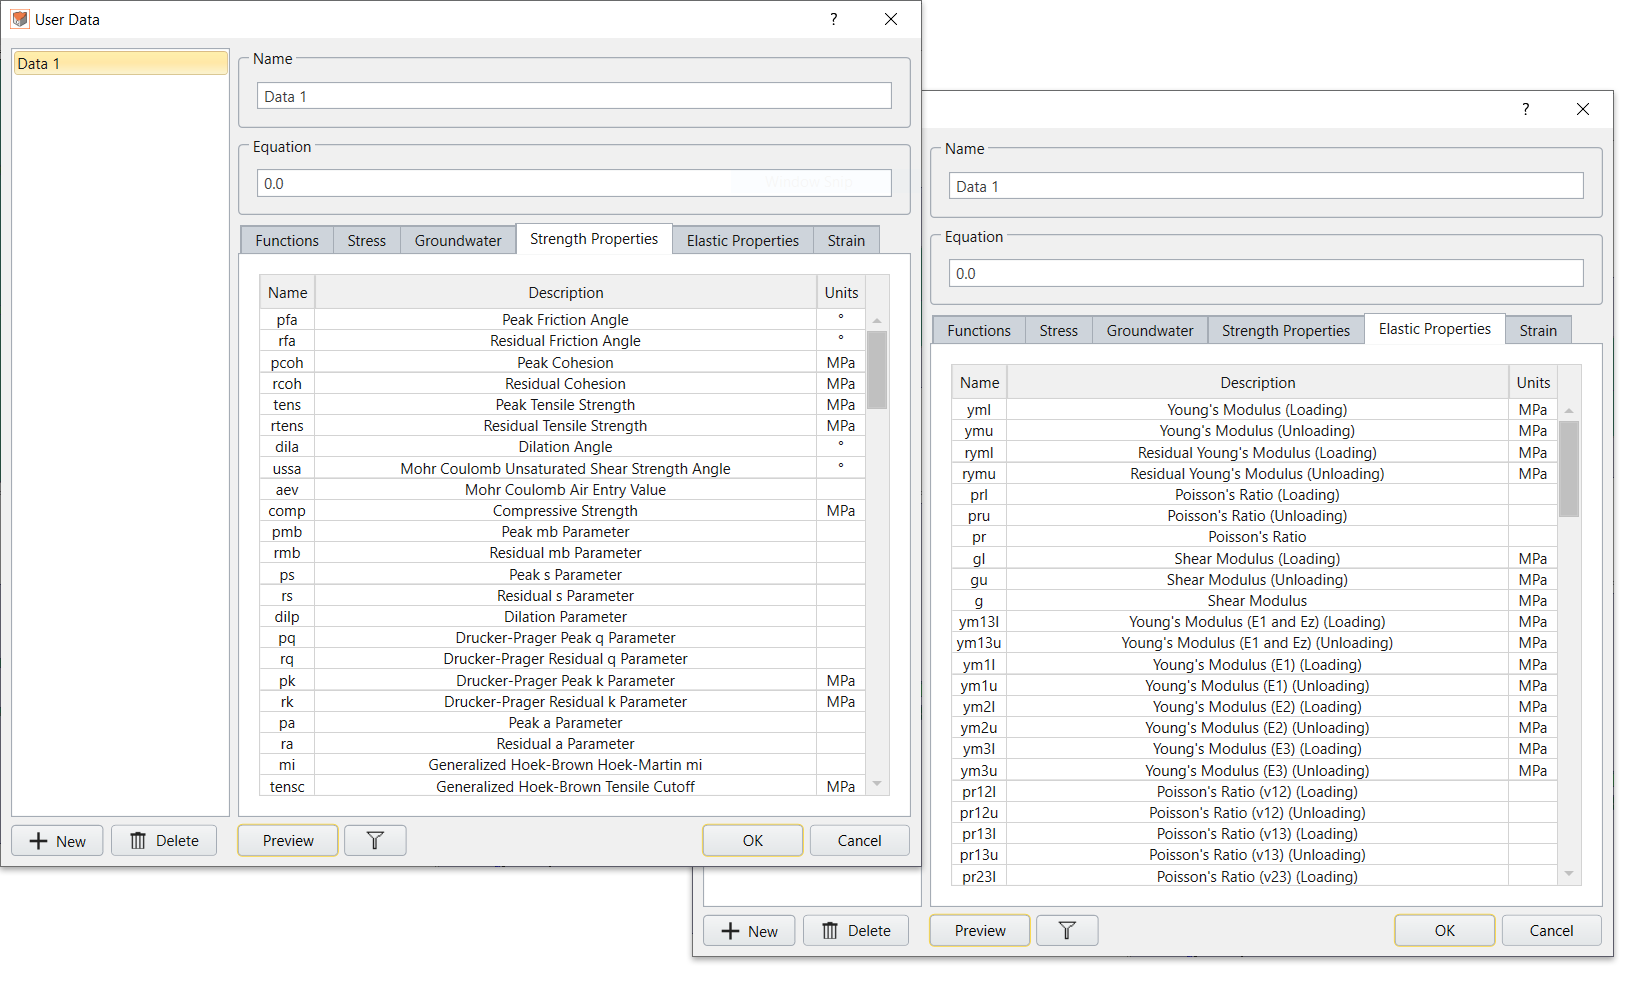
One of the reasons RS3 is one of the best 3D FEM programs on the market is because of the extensive analytical tools it provides. The User Data option in particular gives practitioners a new level of control with its ability to create user-defined contour plots. Instead of being limited to only viewing principal stresses and displacements, users can create contour plots of any stress tensor or displacement component, write mathematical expressions containing these components, and view the results. With this latest update, RS3 has taken this feature even further by adding Strength Properties and Elastic properties to the list of User Data options. With this addition users have an even greater array of analytical options at their fingertips.
New Tools for Modelling
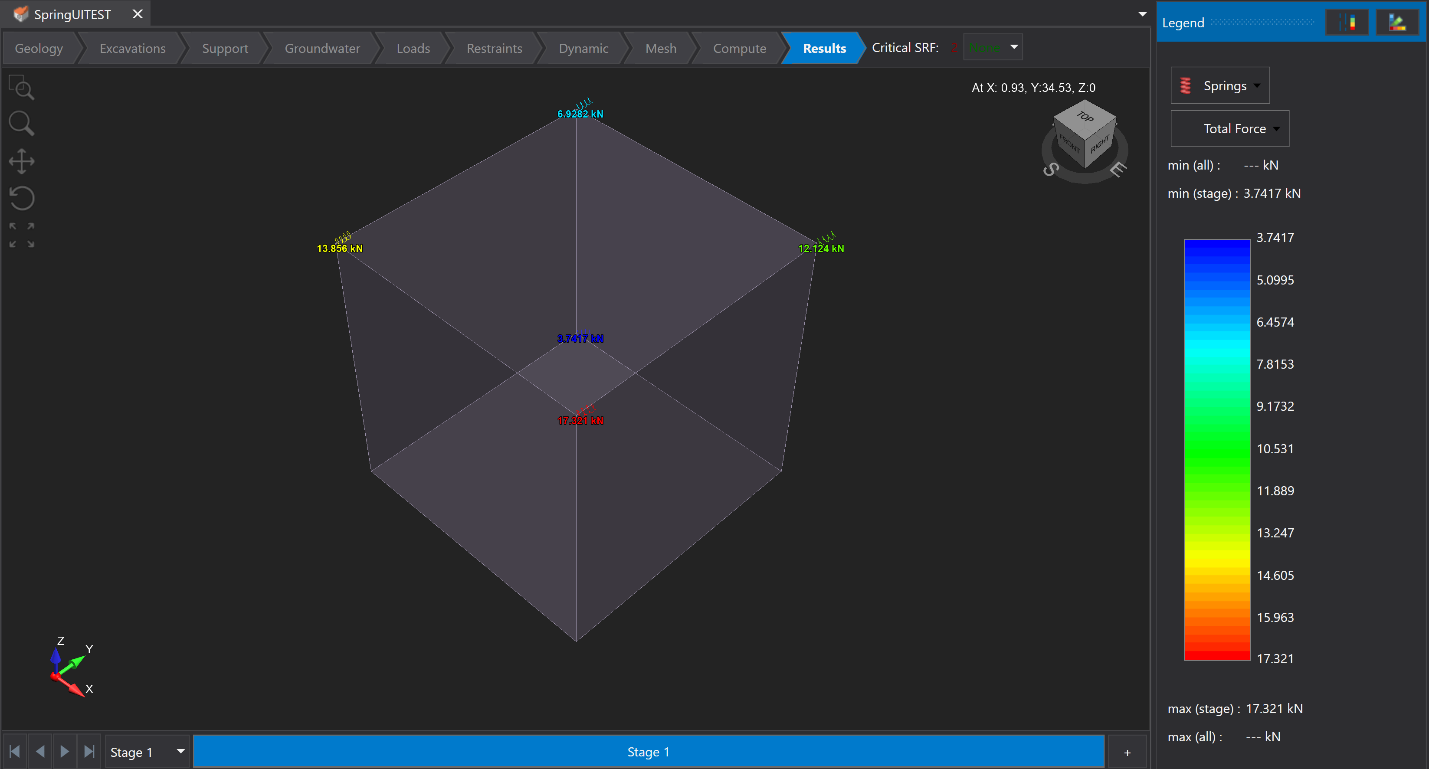
In additional to new analytical tools, RS3 has also added more features for model design that allow for more complex models with more accurate staging. These features include the new Add Springs to Selected option which allows users to create spring constants on any selected edge or line of the model. Springs like these are often used in building supports for situations like seismic activity. In RS3, users have the option to define the initial load (in the global x, y, z directions) and stiffness of these applied springs and then measure the total forces on those springs in their analysis. The results are not only displayed but also colour coded and synced with the contour legend for quick assessment of total forces applied to each spring.
Using joints in your model has become that much easier with the improved Add Joint Surface option. This feature allows you to add temporary joints to your model instead of static ones. Users can specify at which stages they want to add and remove the joint, allowing them to better simulate construction scenarios like temporary restraining walls.
If these enhanced modelling features weren’t enough, RS3 has also included several new data import options with the addition of Reutech Sensor Data and 3vGeomatics Data. Sensor data is often used in open pit mining scenarios for detecting displacements that could affect slope stability. RS3 allows users to import this sensor data in CSV format and displays the data as either a point cloud or solid mesh. Users have numerous options for filtering and adjusting the range of data imported, allowing for more specific analyses (such as analyzing displacements of a certain size or filtering by data range).
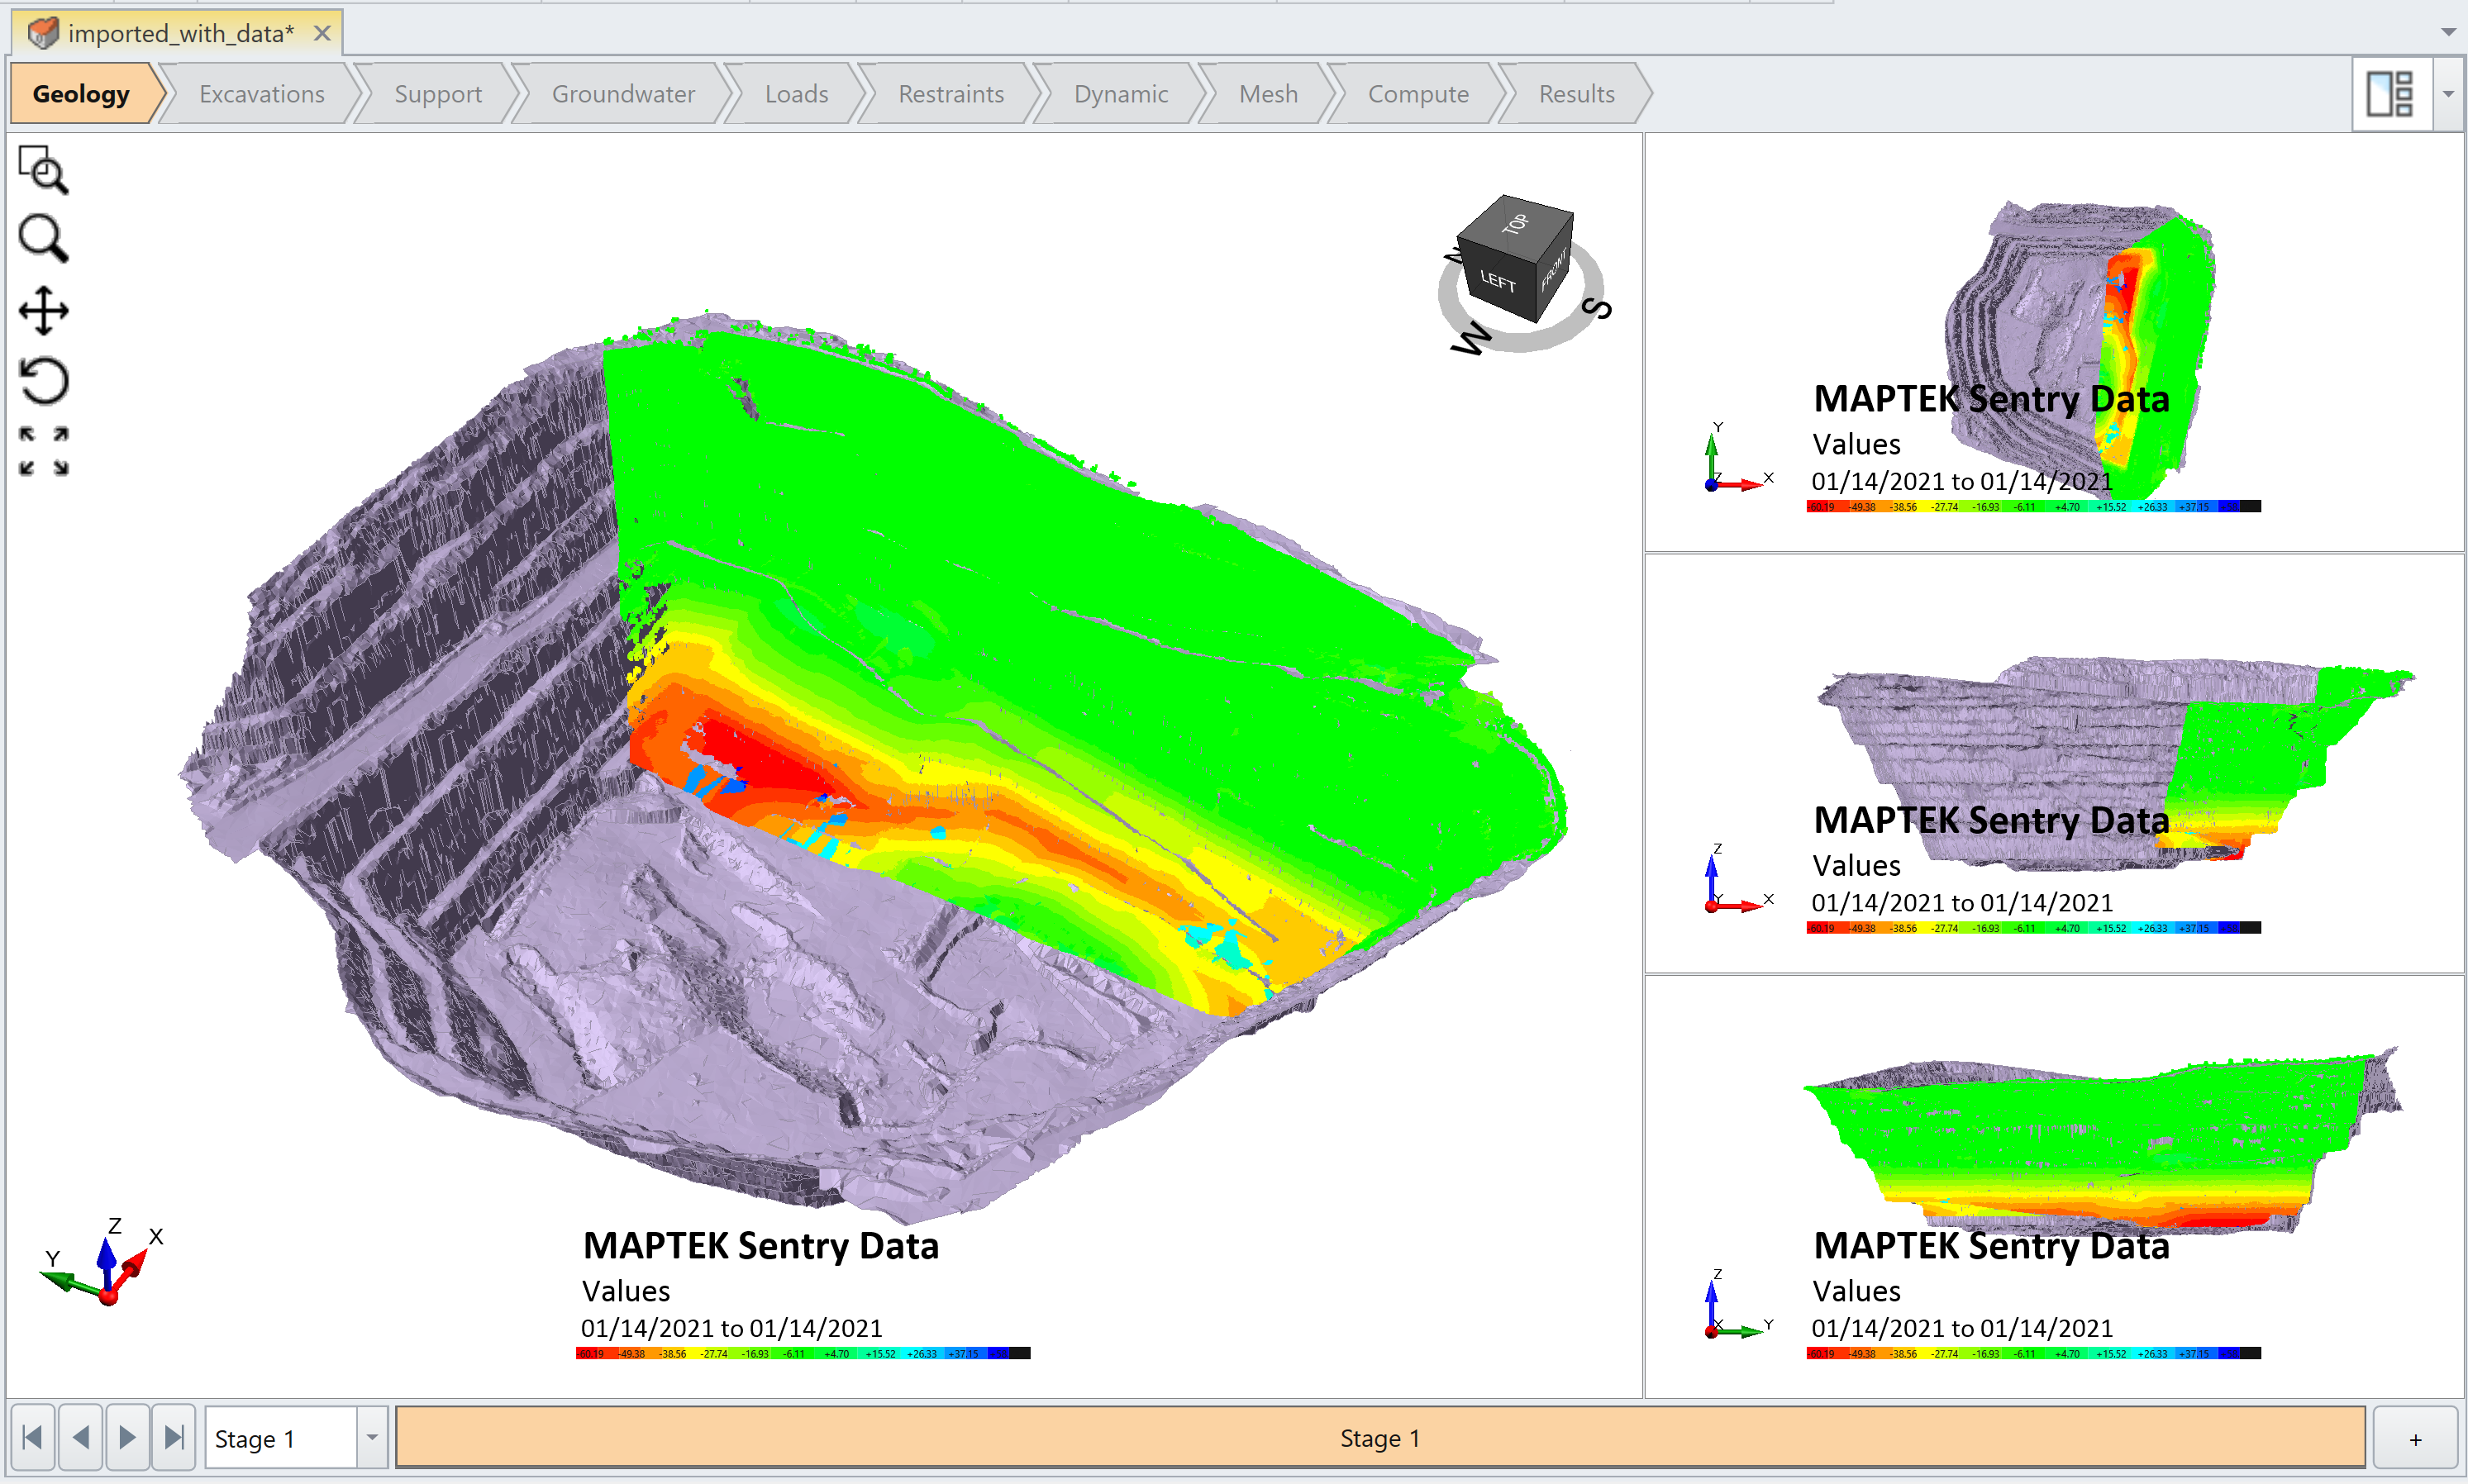
This list of sensor data import options will continue to expand this year. In an upcoming release, RS3 is also adding Maptek Sensor Data (shown above). The feature will be available in various Rocscience 3D programs including RS3, Slide3 and EX3 and will allow users to adjust or validate their models using real-world data, as well as determine where in the model to focus their analysis.
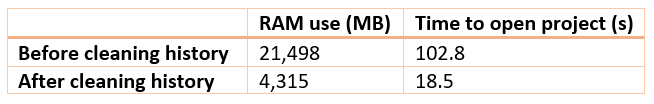
Improved Performance
In addition to helping users create more complex models, the latest RS3 release also includes performance enhancements to help models work faster. A new feature called Clean History has been added that improves the speed of opening projects with large amounts of nodes. When opening a project with more than 100 entities, or more than 4 operations in sequence, RS3 will automatically notify the user that the history can be cleaned. When used the history before the Divide All Geometry, intermediate nodes will be removed, reducing the amount of RAM used by the program and significantly increasing the speed of opening the project.
This History removal feature isn’t just limited to projects with more than 100 entities. The feature can also be run on-demand by users through the Geometry menu.
Better Visualization
One of the most important aspects of analyzing any model is having control over how the data is visualized. RS3 continues to provide more tools for doing just that with a variety of new display options.
The program now includes new configuration options for the viewing windows. Users previously had the option to view their model in up to four viewing windows that displayed the model in a range of 2D and 3D angles. With this new enhancement, users have additional configuration options for these windows, including split-screen, varying sizes, stacking and more.
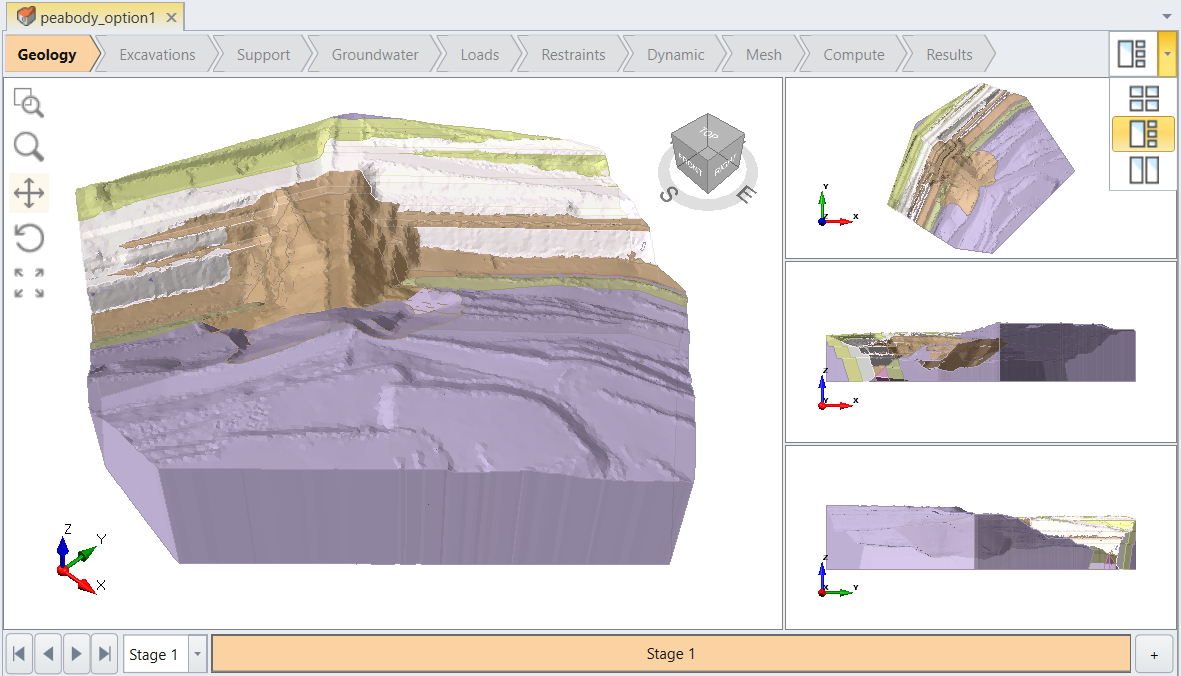
Zooming in on complex models has also improved for these windows with the Align camera with selected plane or face feature. Using this option in the View menu, users can now select a specific surface in their model and all views will automatically zoom in and point perpendicular to the selected face. The new feature saves users tons of time and makes it easier for viewing and analyzing specific sections of large complex models.
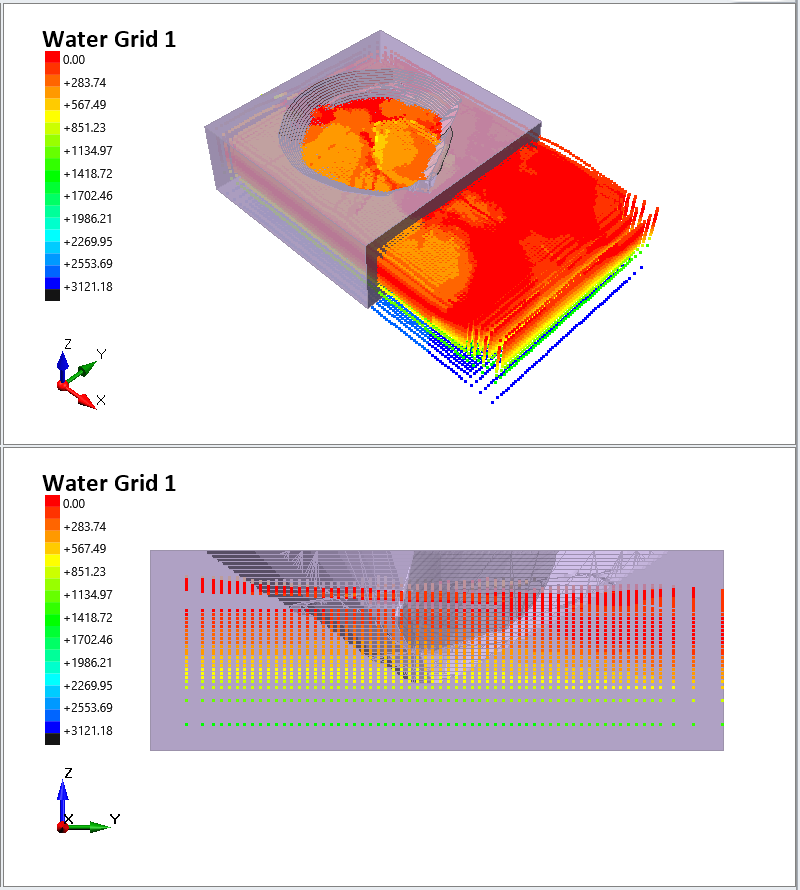
Speaking of improved analysis options, RS3 also has made major improvements to Grid Data Visualization. RS3 users can now visualize grid data using a colored point cloud that is defined according to the contour's spectrum. This feature, available for Pore Water Pressure in groundwater and discrete functions in material's strength, can assist users in quickly identifying things like areas of high water pressure. Users have even more viewing options when they combine our new tools with numerous RS3 Display Options. In the Display Options user can select contour colour ranges, can combine them with different display themes – such as the Dark Theme – for better viewing of data.
June 2020
RS3 is a 3D finite element analysis program designed for 3D analysis of geotechnical structures for civil and mining applications. You can use this powerful program for modelling slopes, tunnel and support design, surface and underground excavations, foundation design, embankments, consolidation, groundwater seepage, and more. With fully automated Shear Strength Reduction, you can use RS3 for advanced slope stability analysis on the most complex 3D models.
Like Slide2, this past month the library of geosynthetic support products for RS3 has been expanded now to include Geosintex’s EDILGRID. This comes in addition to other enhancements including improvements in the Divide All and Form Closed Triangulations. These are important tools in 3D geometry creation and both of them are more robust than ever. For underground models, the new divide all is not only faster but also creates less bad elements.
May 2020
This month, the latest Maintenance+ updates for RS3 have been released and there are a ton of new features to get excited about! This is the second release of RS3 since September 2019 and includes just as many advances, most prominent among these being the newly improved 3D Tunnel Designer for RS3.
The RS3 Tunnel Designer is a geometry creation and sequencing tool developed to make tunnel construction simple, fast and easy to edit. A core part of its functionality is to create an intelligently managed tunnel model.
With the new design process, tunnel models are added and removed as a single unit, making the overall tunnel design process faster than ever. Each tunnel is organized so that the user can alter individual components of the tunnel and the rest of the tunnel is updated to reflect the change. This means a tunnel with sequenced supports can have its path changed and the support sequence will be applied commensurately.
Determining your tunnel path has been made both simpler and more dynamic as well. The 3D tunnel designer not only lets you extrude in any direction, it also accepts 3D path curves. For a speedier design process, the copy + paste function is here to help you quickly create multiple copies of a tunnel while also allowing each tunnel to have its own local variation.
Want to try it? We’ll show you how
With these many new improvements also come four new tutorials to help you make the most of this powerful tool. The tutorials include:
- Sequence Tunnel Design - Master the basics of sequenced tunneling by modelling a circular cross-section excavation in multiple stages with beam supports for typical tunnel excavation.
- Cross-Section Tunnel Design – Learn about 3D cross tunnel design by creating tunnels with different shapes and applying them in various locations to create intersecting tunnels.
- Tunnel Design with Boreholes – Design a tunnel with user-imported boreholes and get familiar with how to define a tunnel using coordinates and a general 3D path.
- RS2 Tunnel Design Import – Import an RS2 tunnel design into RS3 and find out how to create a 3D tunnel from a cross-section tunnel.
More features to look forward to
Along with the tunnel designer, there are several more exciting new tools being added to the RS3 roster. The newly added Fast Contouring feature introduces a faster approach to construct and render contour mesh in RS3. For users this means a faster rendering framerate, a quicker response time and better UI feedback in view changing.
Users of the newly revamped excavation and stress analysis program EX3 can get excited! As part of Rocscience’s continued efforts to create an integrated suite of programs, EX3 files can now be imported into RS3 for analysis. Users now have the option to change the external size, divide all, auto restrain and generate a mesh to finalize their import.
If all that weren’t enough, RS3 is also adding improved query line functions including the ability to create a query line at the intersection of the contour plane and new labels where user can now see the locations and data values at each sample.
May 2020
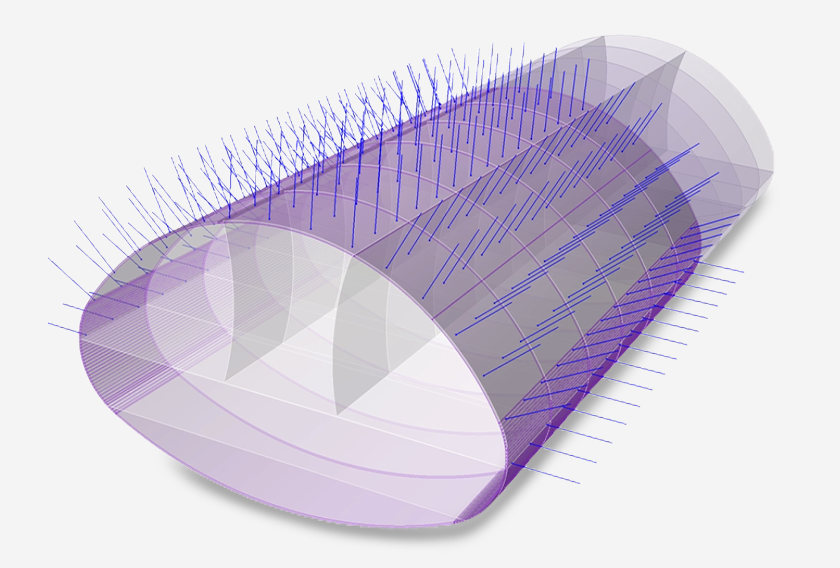
Radar Monitoring of Slopes
Synthetic aperture radar (SAR) monitoring is a tool used for both broad scale strategic monitoring and tactical-focus monitoring to determine progressive (accelerating) slope movement which can indicate impending slope failure.
SAR monitoring works by using a broad fan-beam to illuminate the same target multiple times within the same scan. For each pixel of a SAR image, a phase value is measured along the line-of-sight by the radar. By comparing phase differences of subsequent scans, it is possible to detect small variations that relate to sub-millimetre deformations of the slope.
This radar data can be easily imported into programs like Slide3 and RS3 and overlaid over models of predicted slope behaviour.
March 2020
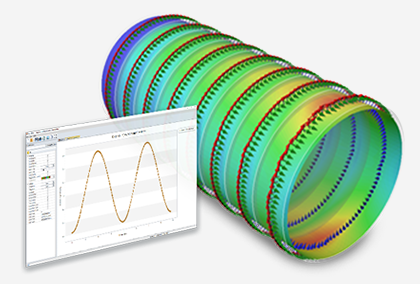
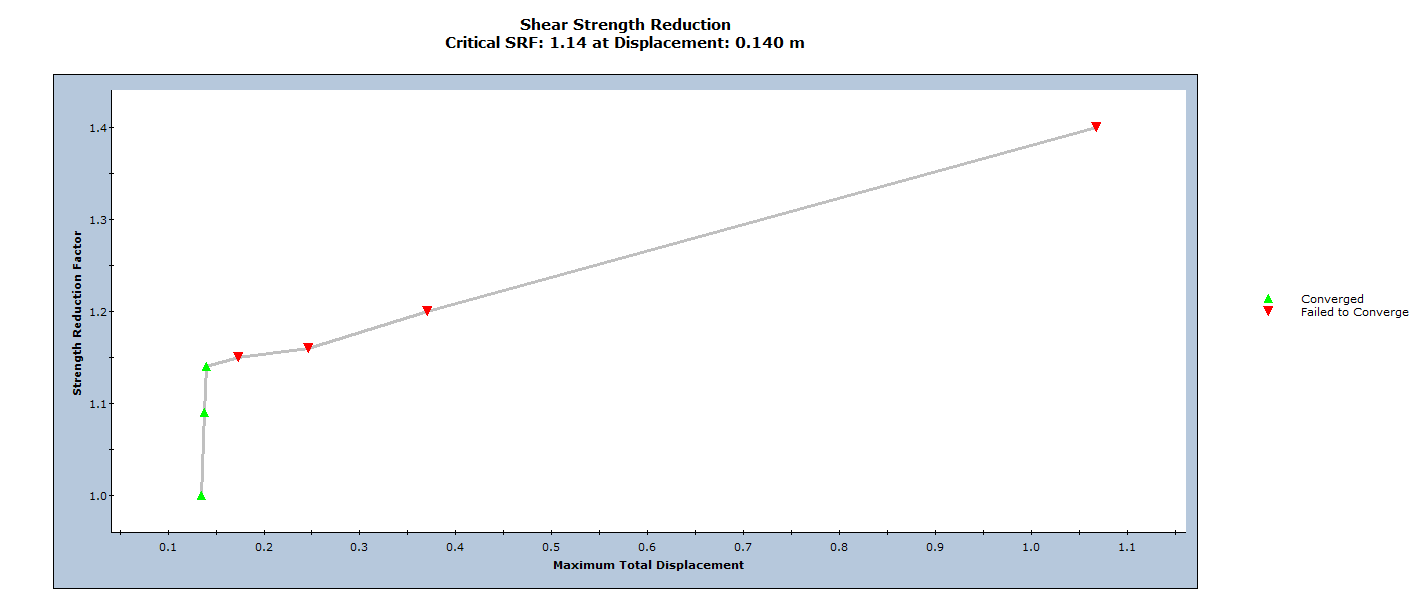
New Shear Strength Reduction Graph in RS3
Adding to the already powerful and comprehensive array of results graphs in RS3 is the ability to plot the relationship between Shear Strength Reduction and Maximum Total Displacement when conducting a Shear Strength Reduction analysis. To generate the graph, simply select Shear Strength Reduction on the Graph menu.
Some of the highlights of this new graphing capability are:
- Each data point represents the Shear Strength Reduction Factor versus the Maximum Displacement for one iteration of the SSR analysis. The Maximum Displacement is the maximum value of Total Displacement that occurred at any point in the model, for the stress analysis that was computed using that value of Strength Reduction Factor.
- Data points displayed in green represent analyses for which the stress analysis results achieved convergence within the specified tolerance for the analysis. The tolerance is the Tolerance (SRF) value in the Strength Reduction tab of the Project Settings dialog.
- Data points displayed in red represent analyses for which the stress analysis did NOT achieve convergence within the specified tolerance (i.e., the model was unstable).
- The Critical Strength Reduction Factor (Critical SRF) is the maximum value of SRF for which the model remains stable (i.e., the analysis converges). This is the uppermost green data point on the graph.
March 2020
This spring, Rocscience is excited to announce the introduction of the Report Generator, a dynamic new reporting tool coming to some of Rocscience's most powerful programs, including Slide2 & Slide3, RS2 & RS3, and EX3. Formerly called the Info Viewer, this new reporting tool lets you create sleek, professional looking reports for your geotechnical project.
When you launch the Report Generator it will automatically create a report of your analysis, and package it with a customizable cover page, table of contents, headers and footers, and so much more.
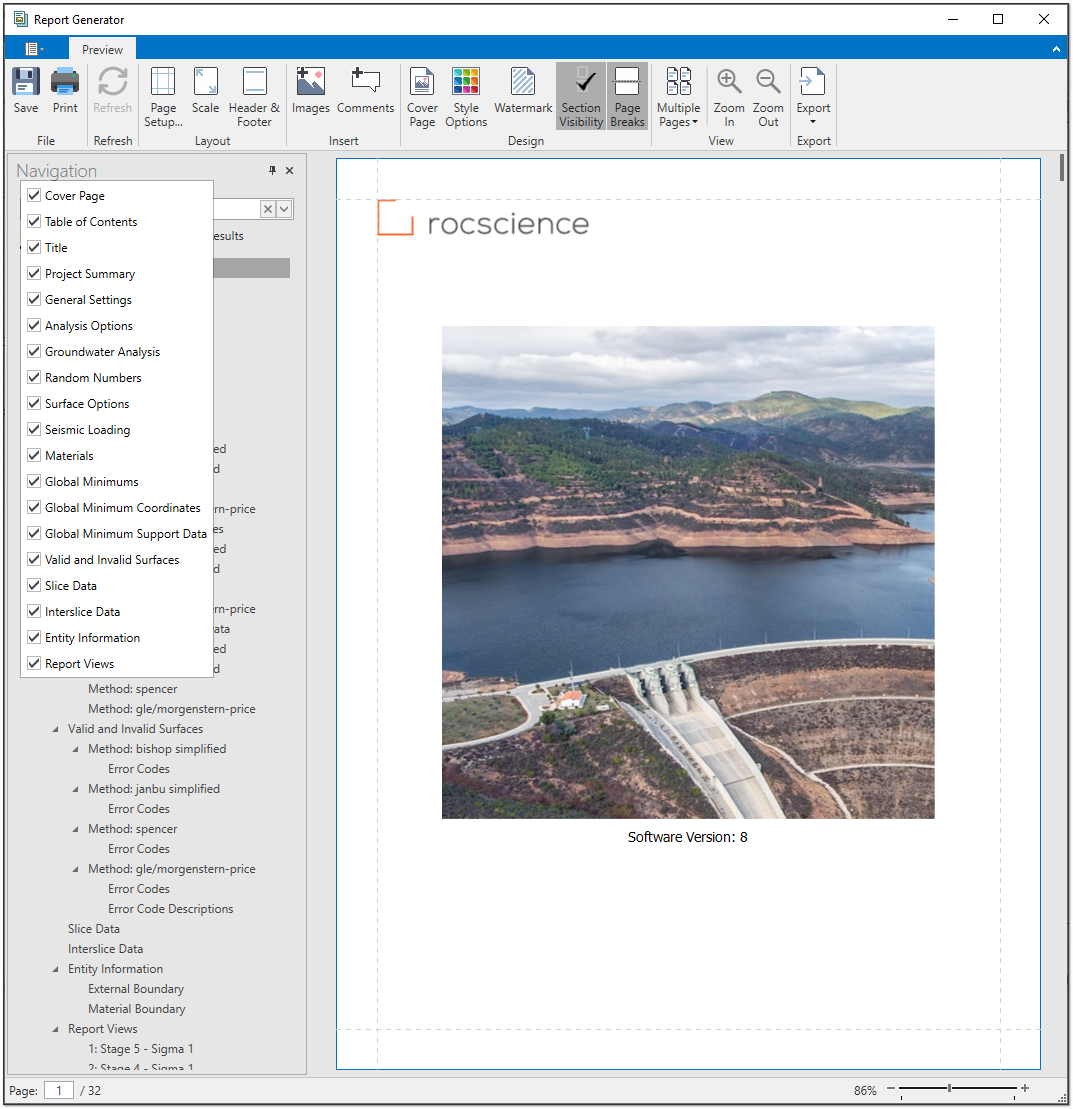
The Report Generator includes a navigation bar that lets you quickly navigate and search the report. Just click on the document map to view to sections of the report or use the search bar to look for specific content. Included in the report is a table of contents that is automatically created and adjusted as you add and remove sections from your analysis.
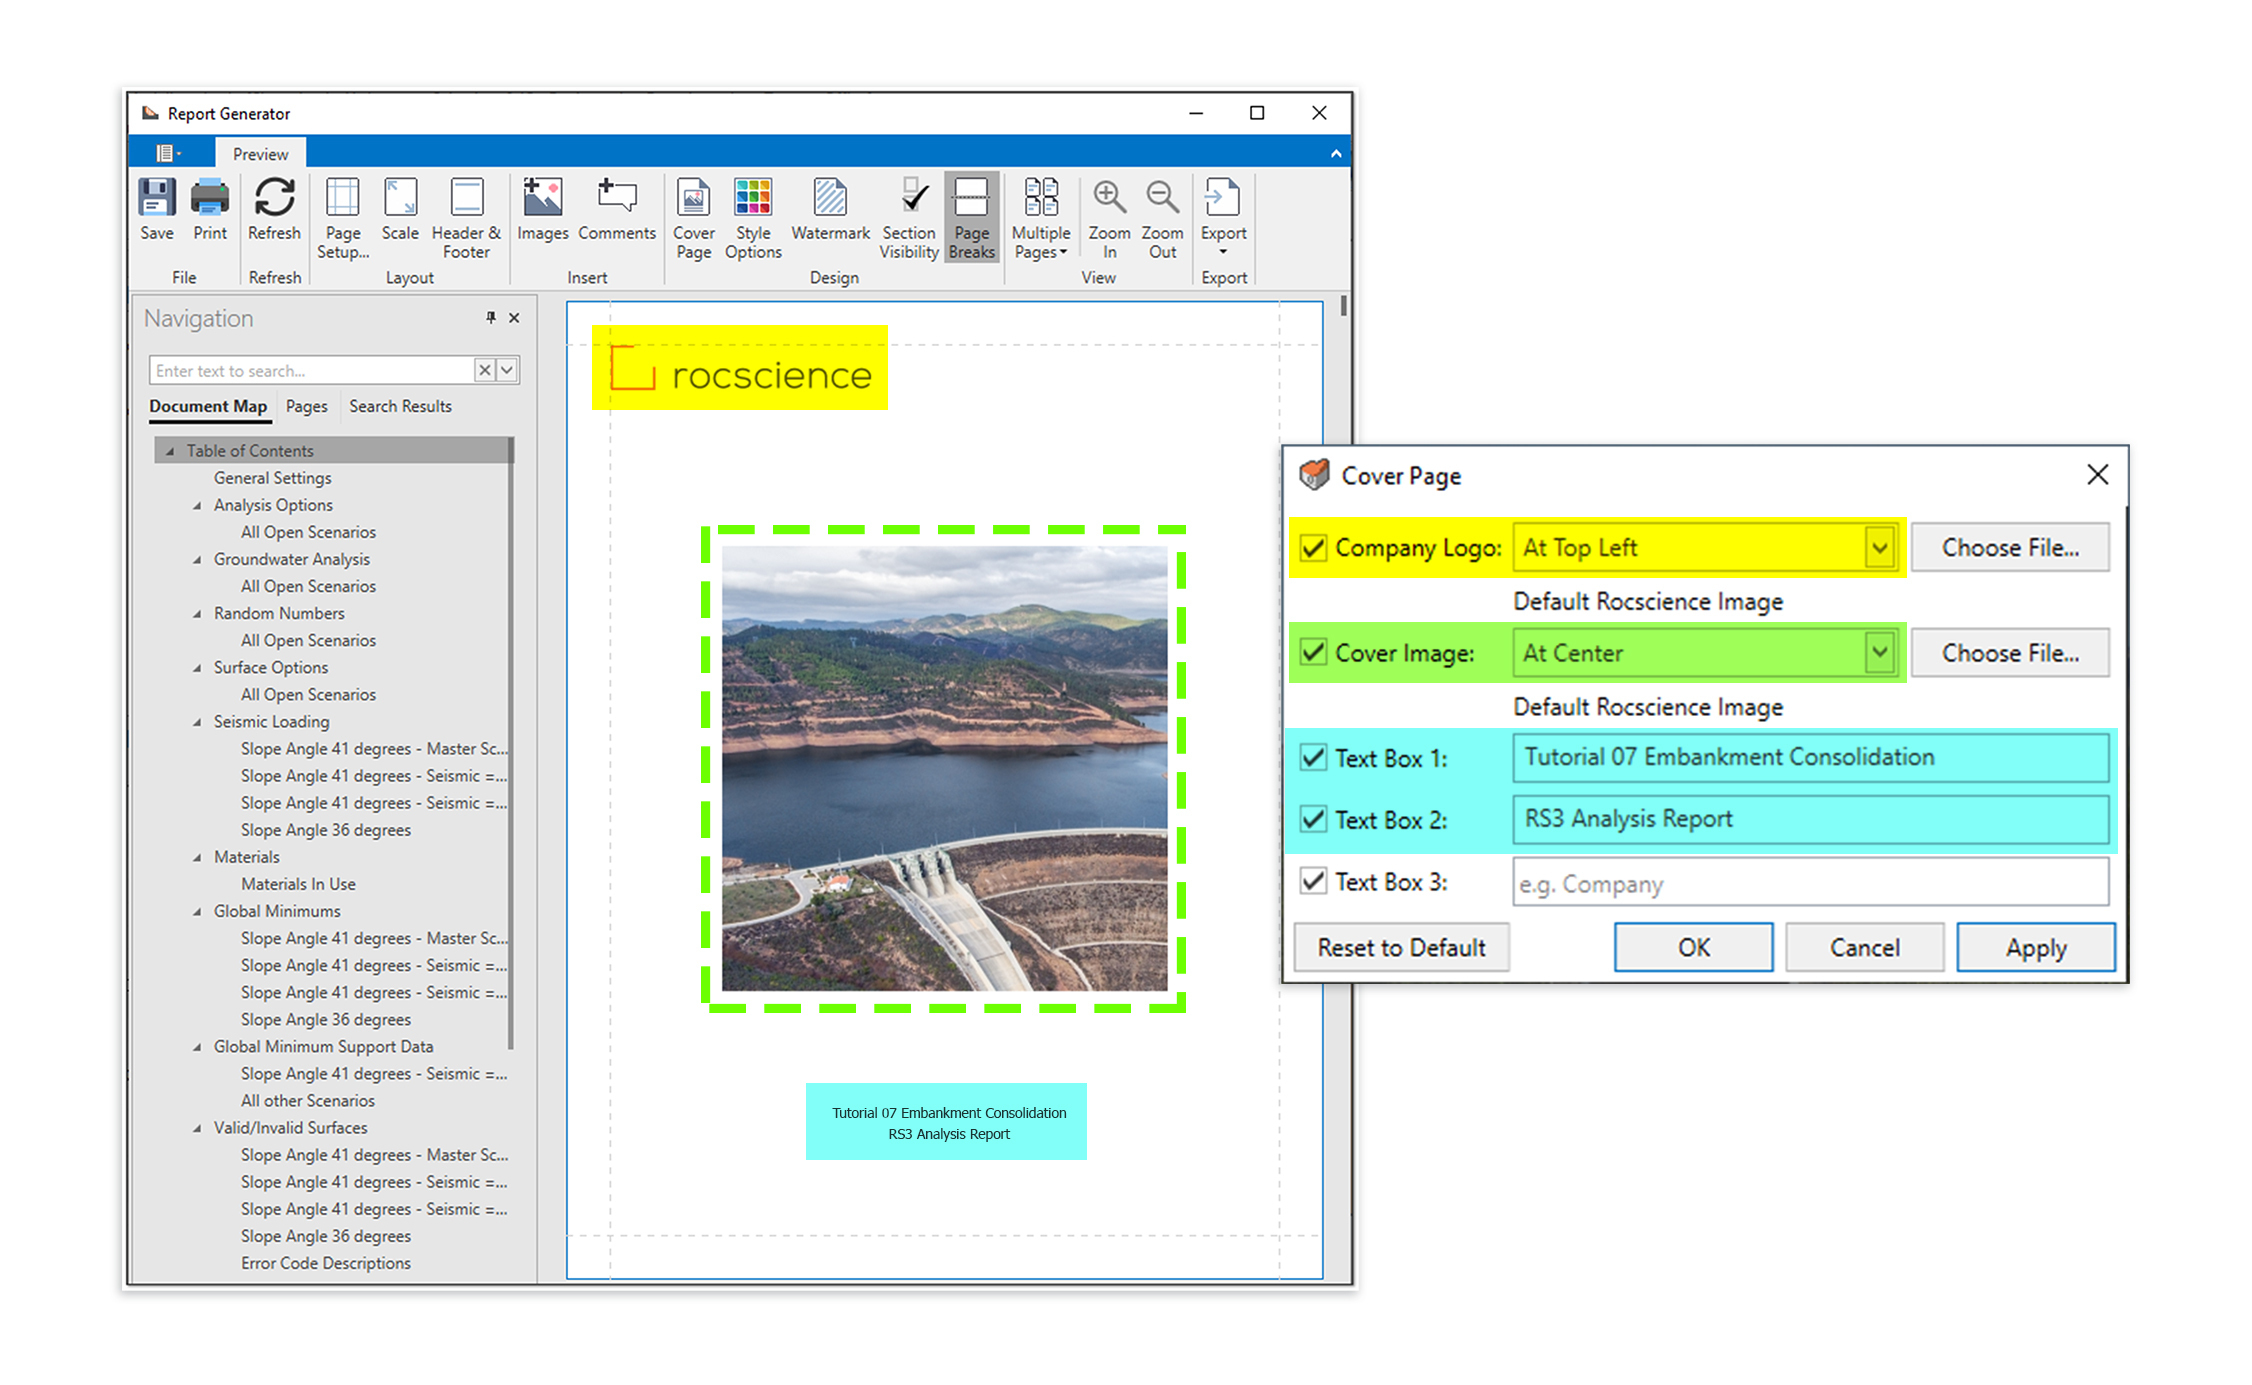
A sleek, editable cover page is automatically created for your report and can be customized with your own images, company logo, and more. Use the controls to easily adjust the layout and select what sections to include. Once you’re happy with the look of your cover page, you can save time by saving these customizations for use on future projects.
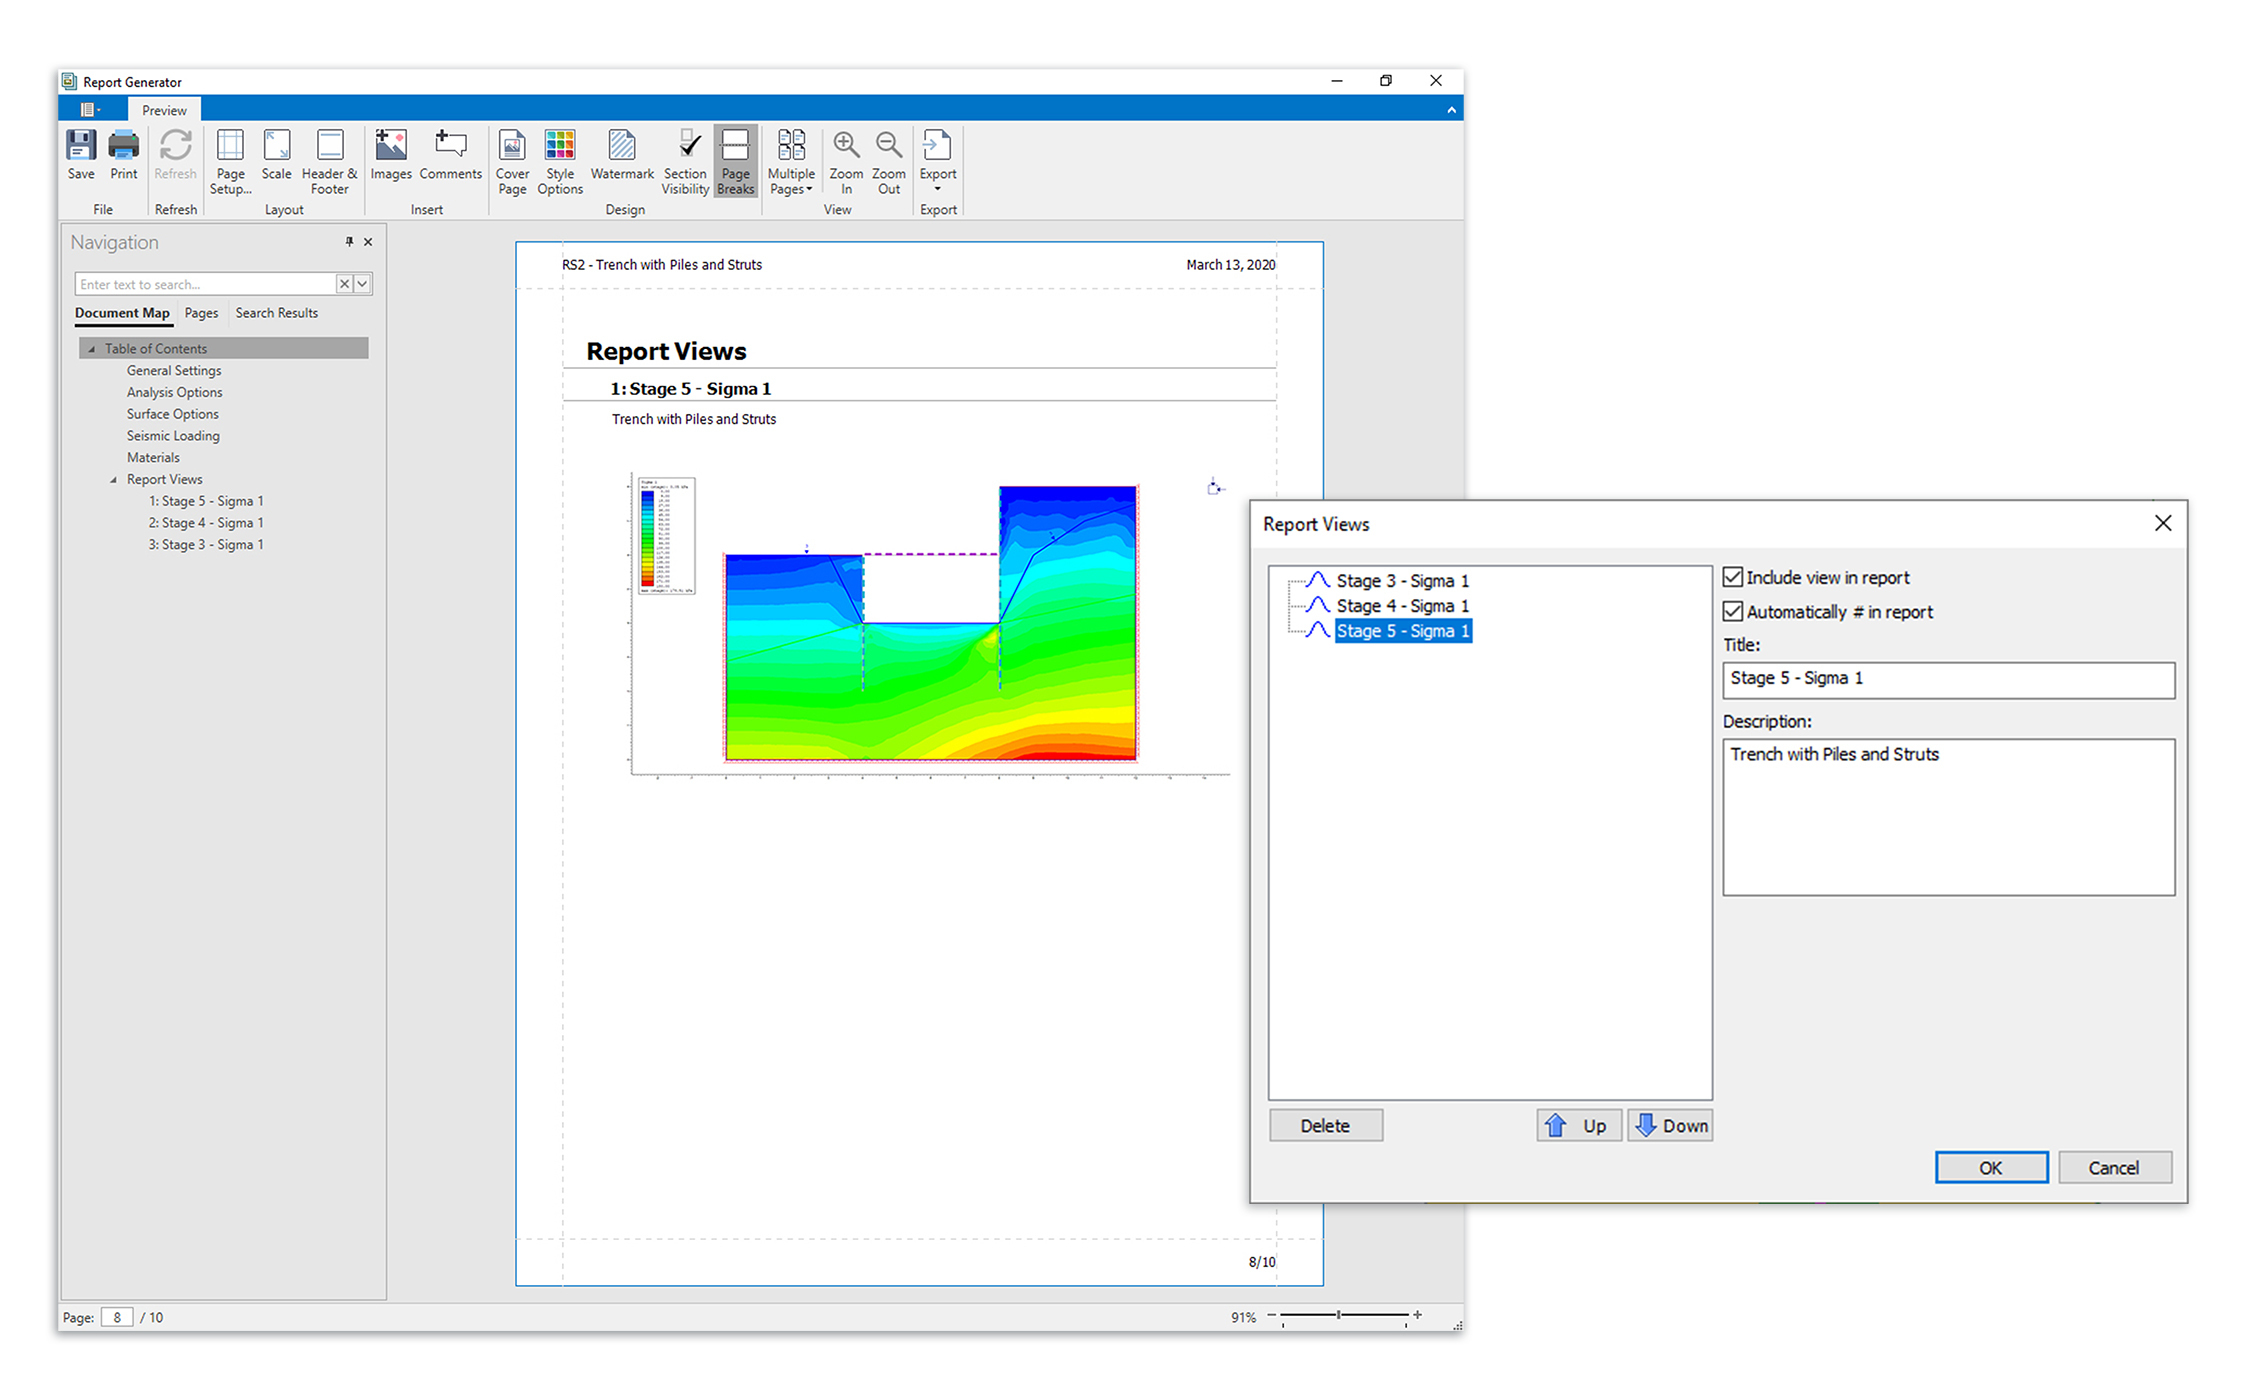
With the Report Generator you can edit more than just the look of your report though. You can also add content of your own! Use the Add Images or Add Comments buttons to add text and images to any section of the report. If you want to add snapshots of the computed model, you can do that as well from the Interpret window of your Rocscience program. The tool lets you add multiples views of your model, add titles and descriptions, and even arrange the order of the views. The views of the model will then be added to the end of your report.
Once you’re done customizing your report, you can easily print or export the file.
December 2019
Geometry Improvements in RS3 and Slide3
New Simplify Geometry Triangulation Feature
New in both RS3 and Slide3 is a Simplify Geometry Triangulation option that allows users to simplify the triangulation of selected imported geometry to reduce the number of triangles. The option is available as a standalone function on the Geometry > Surface Triangulation Tools menu or as part of the Import Geometry process. When selecting the tool, the Simplify Triangulation dialog appears with options for applying a Simplification Scheme and Simplification Level.
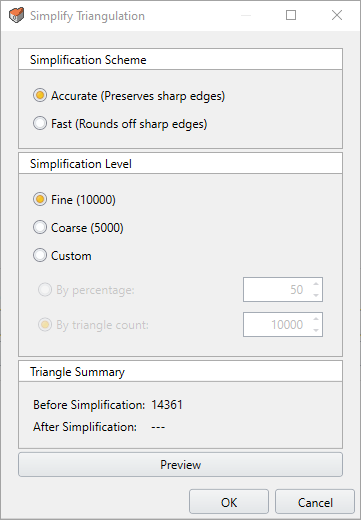
This new tool is an outstanding addition to the already impressive array of Surface Triangulation Tools available in RS3 and Slide3 to edit model geometry
New Post-Processing Step During Geometry Import
The Import Geometry process in RS3 and Slide3 has been enhanced with the incorporation of the validation and cleaning operations into a single Post-Processing Step as the last step in the process. Together with the addition of Geometry Simplification (see above), this enhancement makes this powerful tool even easier to use.
New Surface Triangulation Tools
In addition to Simplify Triangulation, several other surface tools have been added to the Surface Triangulation Tools array in RS3 and Slide3. These include:
Convex Hull creates a surface that envelops the selected geometries, i.e., a bubble that encloses all selected surfaces/lines/points. This can be used to recreate simplified slopes or ore bodies that were stored as unstructured triangle slopes.
Add Surface from Points creates a terrain-like surface from the vertices in imported or selected geometries (other surfaces, lines, and points). This is a common feature in 3D CAD tools that have 3D scans stored as point clouds for surface reconstruction.
Add Surface from Existing Contours creates a terrain-like surface from a set of lines. This is a common feature in 3D CAD tools that have 3D scans stored as elevation contours for surface reconstruction.
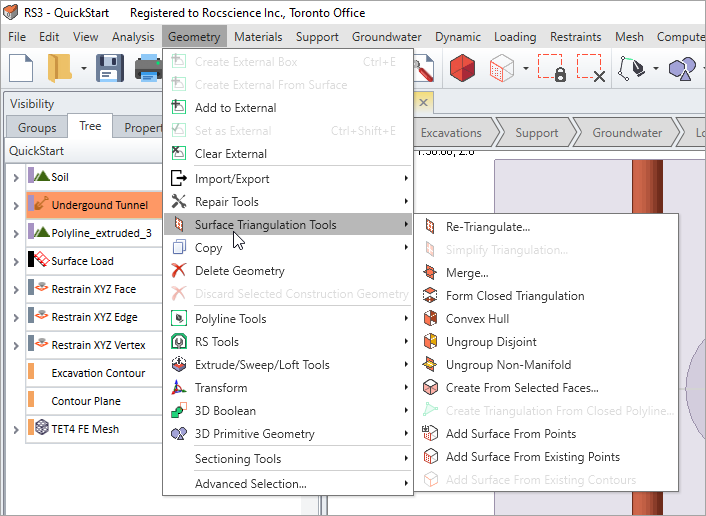
All three new tools have been added in response to user feedback we’ve received requesting help in creating or reconstructing shapes in 3D.
New Geometry Repair Tools
Two new tools have been added to the Geometry Repair Tools in both RS3 and Slide3 to assist users do overall cleaning of the model. These are:
Collapse Material Boundaries is a convenience function that gives users the ability to “union” adjacent solids that have the same material assignment over all stages in a project. From experience, unnecessary splits can occur to a unified solid that breaks up into small pieces. This increases the complexity of the model and reduces the speed of simulation. In previous versions, users could already clean up the model by manually selecting the pieces one by one and “unioning” them, but this can be tedious. Users can now simply use this function to have the program quickly merge all touching solids that have the same material assignments over all stages.
Discard Isolated External Pieces make suggestions and remove floating solid pieces that are disconnected from the rest of the model.
New Export of Contour Surfaces
New in both RS3 and Slide3 is the ability to export selected contour surfaces to a file. The new feature is available by selecting Export Contour Surface on the Interpret menu and will be useful to users who want to import contour surface information into other 3D geometry or data programs for further analysis.
New Import of IDS Live Radar Data to RS3 and Slide3
Newly added to both RS3 and Slide3 is the ability to import live IDS radar monitoring data for contouring on the existing model. In previous versions of the program, users could import radar data from a CSV file. The difference now is that users can establish a direct live connection to a data server using a REST API. This addition of support for live radar data means Rocscience is one step closer to so-called intelligent slope design.
New and Improved RS3
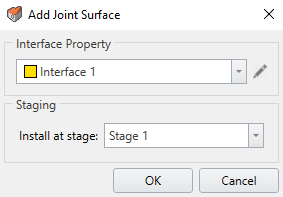
New Add Joint Surface Feature in RS3
A new Add Joint Surface feature in RS3 gives users the ability to select any set of surfaces and define them as joint surfaces.
When the user selects the option on the Materials menu, the Add Joint Surface dialog appears, where the user can select the Interface to define as a joint surface as well as the Stage in which to install it. This is a highly sought-after feature that has been on our to-do list for some time.
Improved Contour Plane and Section Tools in RS3
Improvements to the Contour Plane and Section Tools in RS3 now allow users to select plane entities before starting RS2 Section Creation or Contour Geometry operations. This significantly streamlines these operations since, in previous versions, users had to manually specify the location of the plane before beginning the process.
June 2019
New Structural Liner Interfaces
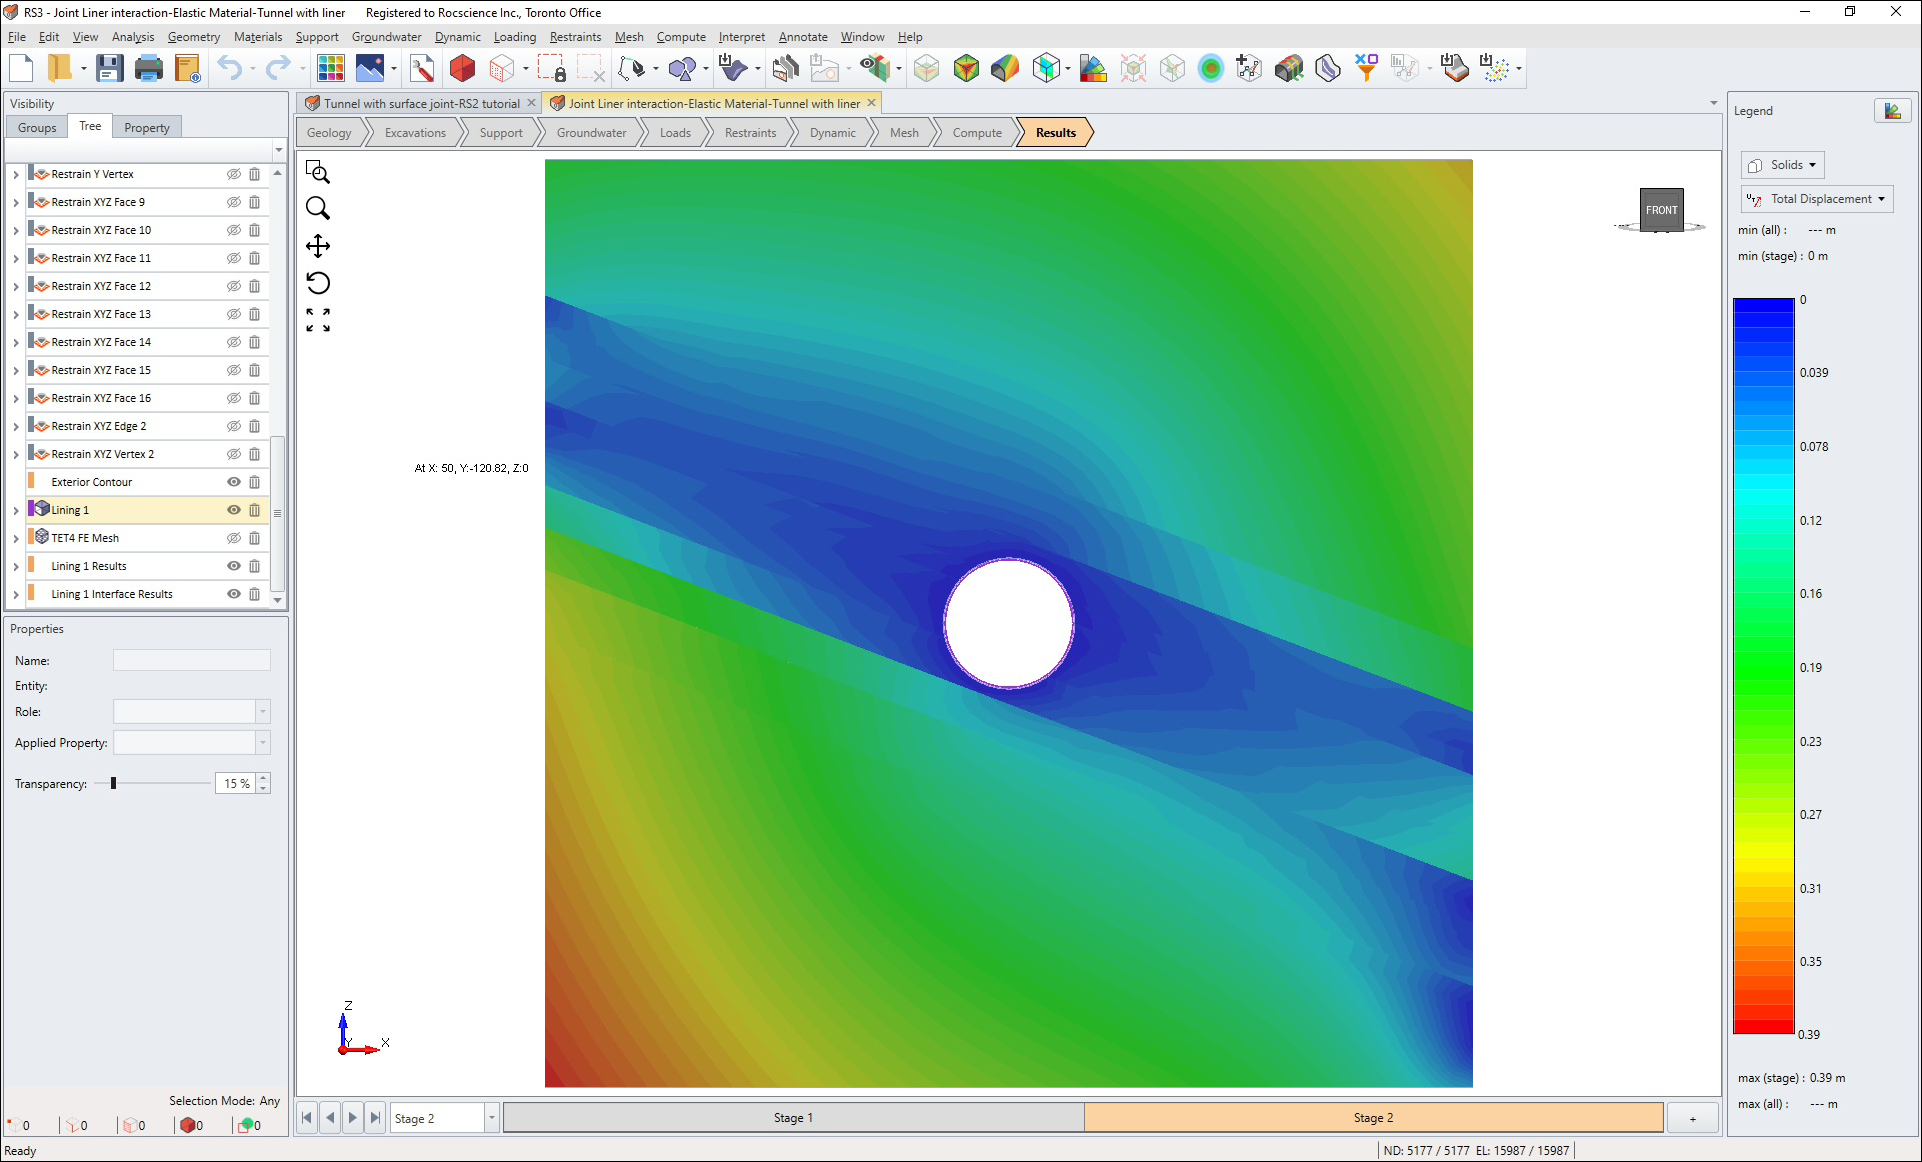
Liners are 2D support elements that can be used to define excavation support systems in RS3 such as shotcrete, geosynthetics, concrete, piles, and bolts. A new feature now in RS3 is the ability to define structural interfaces when modeling liners that have a sliding interface on either side, such as geosynthetics or sheet pile walls.
The new feature now allows users to model and analyze the interactive behaviour between a liner and the excavation material or another liner independently of the liner itself. This results in more realistic support modeling since previous versions of RS3 assumed the interface behaviour to be the same as that of the liner.
Liner Interface Properties Dialog
The central element of this new feature is the addition of a new Interface Properties dialog to define the interfaces that can be used in the model’s lining composition. To open the dialog, select Support > Liners > Define Interface Properties.
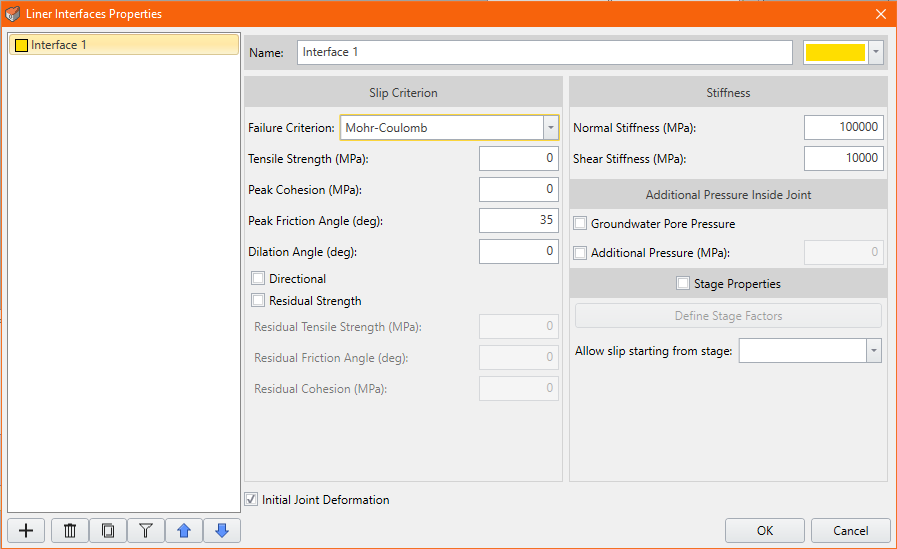
When defining the Slip Criterion and Stiffness for the interface, users can set properties to be Material Dependent or select from a list of pre-defined constitutive models, including Mohr-Coulomb and Barton-Bandis. In addition, users can use the dialog to set up staged installations of the interface in the same way they can for the liners themselves.
Lining Composition Dialog
Another element of the feature is a new Lining Composition dialog that replaces the existing Liner Layers dialog. This dialog is used to define the composition of the lining in the model made up of liners defined in the Liner Properties dialog and interfaces defined in the new Liner Interfaces Properties dialog. To open the dialog, select Support > Liners > Define Lining Composition.
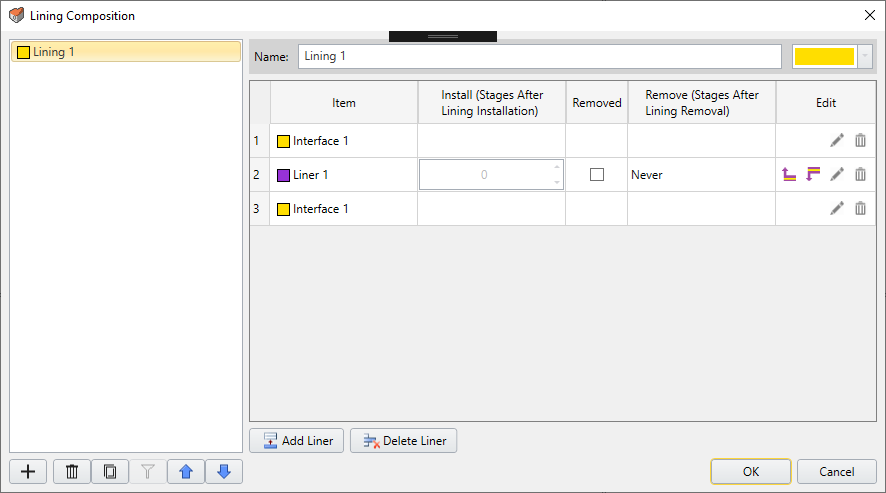
As can be seen, the lining in the model consists of one or more liners or layers, with an interface on either side of each liner to represent its interface with the excavated material or, if applicable, another liner. In addition, in the case of liners with staged installations, the dialog can be used to define at what stage a liner is installed in the lining and, optionally, at what stage it’s removed.
Improved Built-in Geometry Tools
Built-in geometry tools in RS3 mean you can fix problems with imported geometry with just a few clicks of the mouse. The tools include geometry cleanup of defects as well as surface remeshing and merging of intersecting surfaces.
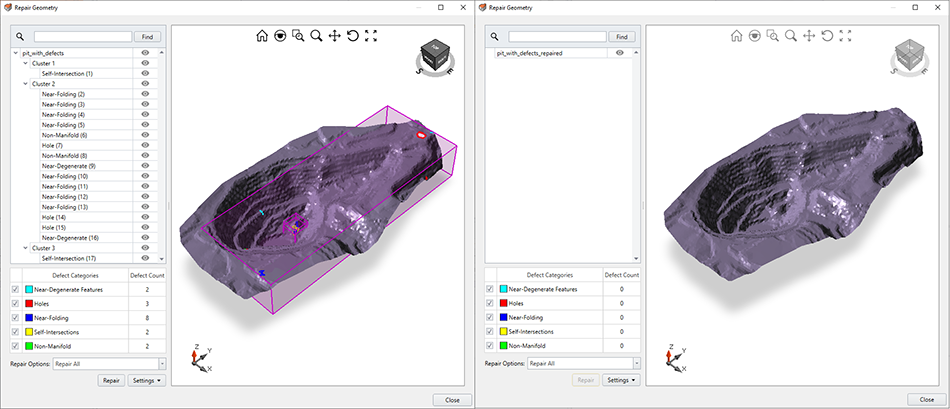
Geometry Cleanup
Geometry cleanup can be performed as part of Geometry Import or explicitly by selecting Repair in the Geometry menu. In either case, users can choose to repair all entities in the geometry or only selected entities. Running a cleanup repairs defects in imported geometry such as holes, degenerate features, near-folding triangles, and self-intersections.
Surface Remeshing and Merging of Intersecting Surfaces
The geometry tools also include the ability to re-mesh geometry surfaces as well as merge intersecting surfaces. Both are performed by selecting the surfaces in the model, then selecting Surface Utility in the Geometry menu, and then selecting the appropriate tool: Remesh Surface or Merge Surfaces. Each command has its own dialog with relevant settings
Project-Wide Geometry Settings
In the new RS3, Geometry settings are part of a project’s overall settings in the Project Settings dialog. This brings all Geometry settings together in one place and enables them to be defined project-wide while allowing for individual overrides. To display the settings, select the Geometry page in the Project Settings dialog.
Additional Geometry Functions
In this release of RS3 are also automatic translation of large, or “mining,” coordinates and support for removal of selected construction geometry above the surface.
New RS2 Section Creator
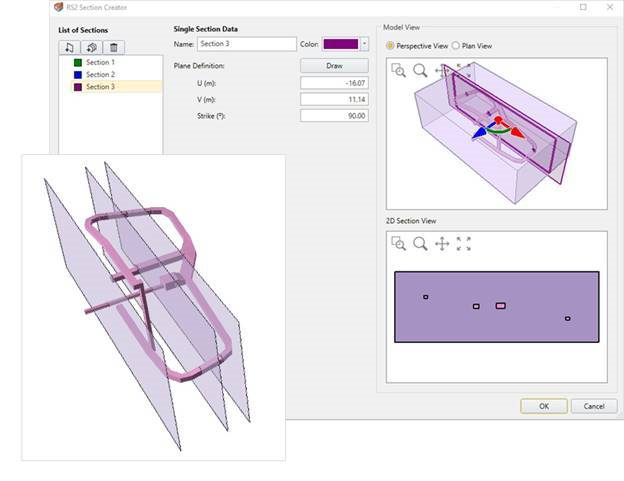
RS3 can now create 2D sections of a 3D model for analysis and viewing in RS2. Once a section is created in the Section Creator dialog, you can select it in the Visibility Pane and then click the RS2 icon on the toolbar to open it as a saved file in RS2.
Once the section is open, you can then mesh it and compute to perform a 2D finite element analysis on it. Once computing is complete, you can view results of your 2D analysis in RS2 Interpret. Once you’ve computed an RS3 3D model’s section in RS2, you can open the section in RS2 Interpreter any time directly from the RS2 icon in RS3 whenever you’re working on the model.
Coming in July: Add Joint Surface Option
Coming in the July release of RS3 is a new Add Joint Surface option added to the Materials menu. This feature will enable explicit modeling of any type of joint, discontinuity, or interface in a rock mass along which failure might occur. Strength and stiffness properties will be able to be assigned explicitly to the joint surface to determine the joint’s response to stress (displacement and slip) independently of and in addition to the overall displacement of the rock mass. Like liner interfaces, joint surfaces will be able to be staged and their properties defined through the Interface Properties dialog.
Learn RS3
Explore the RS3 user guide for in-depth instructions on how to use the program and visit our library of learning resources, including case studies, past webinars, and articles, designed to expand your geotechnical knowledge and help you get the most out of your analysis.