Get the most out of your Piezometric Data with RS3’s New SYSDAM Data Import
- Sina Moallemi, Geotechnical Product Manager
Monitoring the pore water pressure in industrial projects such as mining, construction of tailing dam and tunneling is extremely crucial. It can help geotechnical engineers determine the drained/undrained behaviour of soil, predict the settlement of the structure and find the accurate effective stress in domain. But most importantly, you can use it to determine the factor of safety and the stability of the model.
How to make the most of your piezometric readings?
It can be tricky to evaluate a large set of Piezometric data if you don’t have the option to filter the records that are relevant to you. RS3’s latest release (4.027) includes the SYSDAM Data Import feature which allows you to:
- Import your water table with piezometric readings into RS3
- Specify a particular date and time for tracking the water level
- Monitor how the water levels are fluctuating
- Help you determine factor of safety
SYSDAM Data Import Feature in action
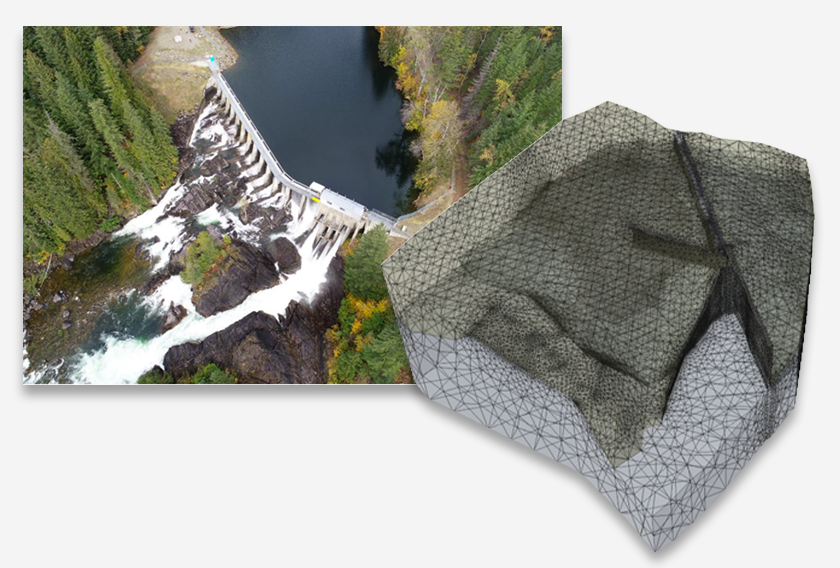
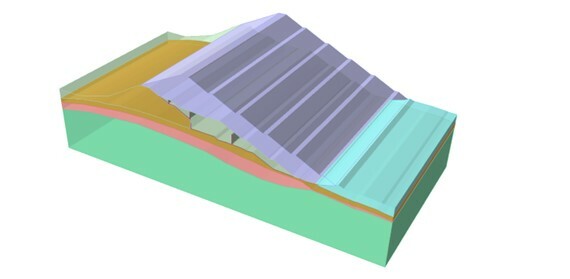
The goal of this model is to calculate the factor of safety of the tailing dam, while the water table is increasing upstream, and the calculation is done considering four different cases –
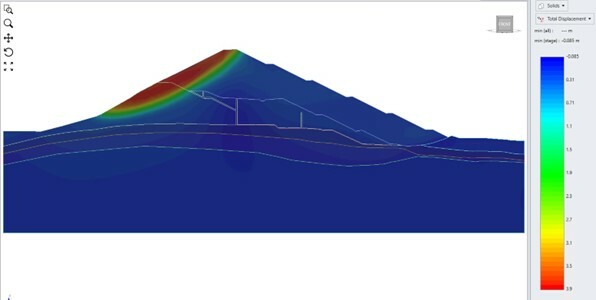
- When the model is dry
- When the water is at a low level same as downstream
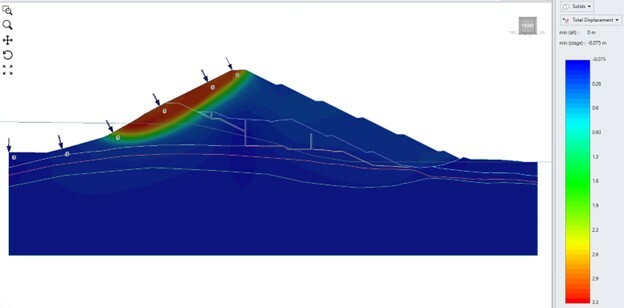
- The water is at the intermediate level
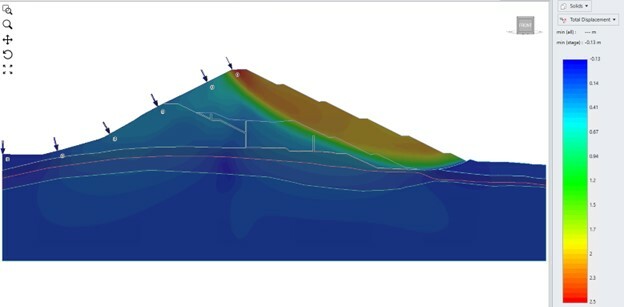
- The water is at the highest level behind the dam
Import your Piezometer data using the SYSDAM data import option in a few steps.
- Go to Groundwater>Add Water by Location
- Click Import
- Change the data type to SYSDAM data and pick the file and then click Open
- In the new window, pick the desired data and the program would display all available piezometric data at that time, then click Ok
- All available data would display in the sheet. By clicking Ok, the water table at the desired time would be created in the model
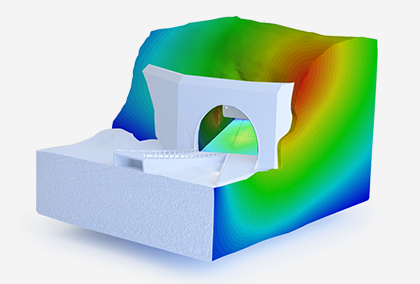
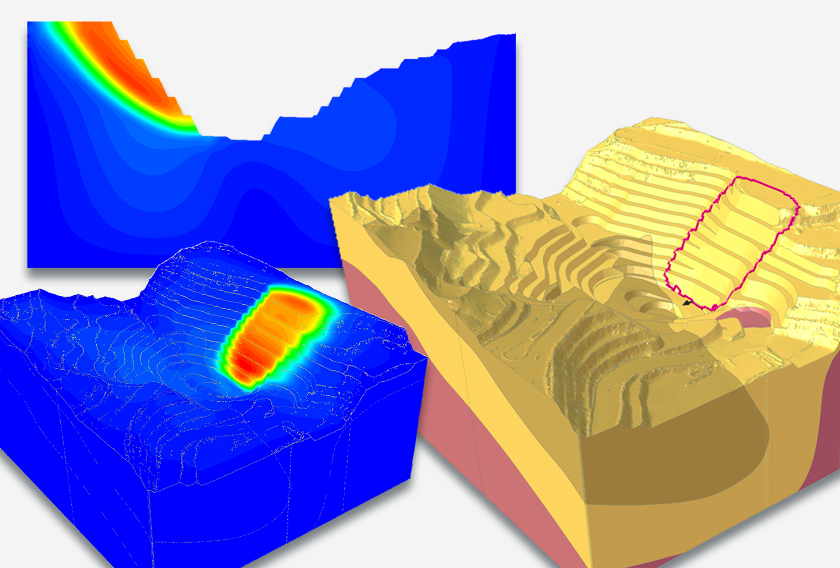
Results: In this analysis, 10-noded tetrahedral elements were used and the ponded water load is applied so that the weight of water is included in the analysis. Results obtained from the experiments done on all four cases are shown below.

Result Discussion
The factor of safety for the dry model and the case when the water level is low are identical since the failure surface is happening to be completely above the water table. By increasing the water table, the effective stress is reduced for the underlying regions, and it leads to a lower factor of safety in the third case (SRF=1.38).
However, when the water reaches the highest level, the weight of the water (which is applied using ponded water load in RS3), increases the compressive stress to the model and it makes more resistance for the upstream against failure. This phenomenon directs the failure surface downstream, but with a higher factor of safety (SRF=1.74).