16 - Axial Pushover Analysis
1.0 Introduction
The tutorial depicts the behavior of a 60cm reinforced concrete pile under an axial push of 12mm in 10 steps. The pile is 20m long installed in ground made of 5m of soft clay followed by 20m of sand.
Topics Covered in this Tutorial:
- Axial Pushover Analysis
- Graph Pile Pushover
Finished Product:
The finished product of this tutorial can be found in the Tutorial 16 - Axial Pushover Analysis.rspile2 data file. All tutorial files installed with RSPile can be accessed by selecting File > Recent Folders > Tutorials Folder from the RSPile main menu.
2.0 Project Settings
- Select Home > Project Settings

- In the General tab, set Program Mode Selection to Pile Analysis.
- Go to the Pile Analysis Type tab. Set the Pile Analysis Type to Individual Analysis = Axially Loaded.
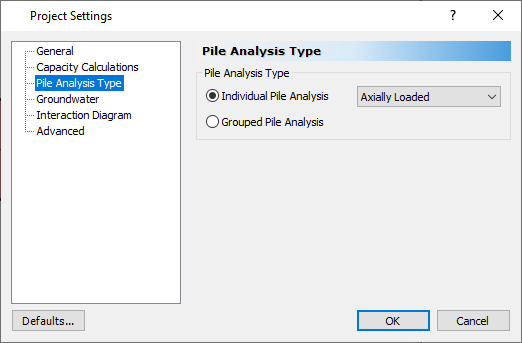 Pushover analysis is allowed for axial and lateral modes. You may not choose Axial/Lateral mode.
 - Click OK to close the dialog.
3.0 Soils
3.1 Define Soils
- Select Soils > Define Soil Properties

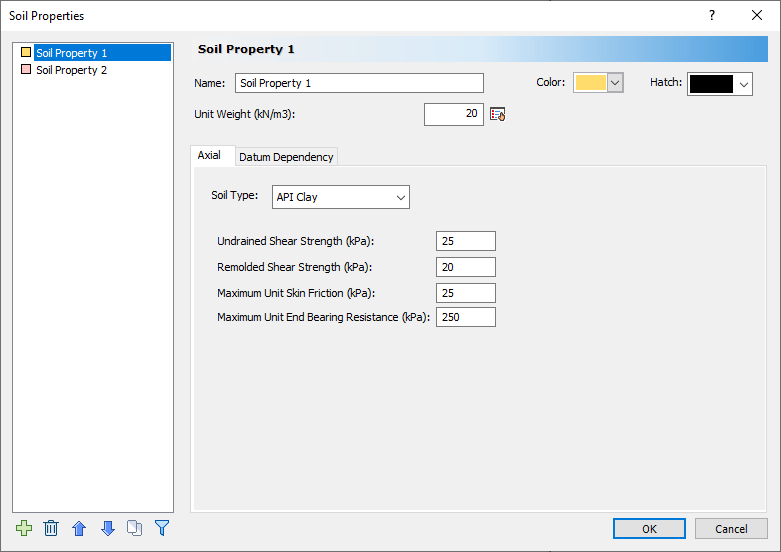
- Select Soil Property 1. This is the soft clay layer. Enter the following properties in the Axial tab:
- Unit Weight (kN/m3) = 20
- Soil Type = API Clay
- Undrained Shear Strength (kPa) = 25
- Remolded Shear Strength (kPa) = 20
- Maximum Unit Skin Friction (kPa) = 25
- Maximum Unit End Bearing Resistance (kPa) = 250
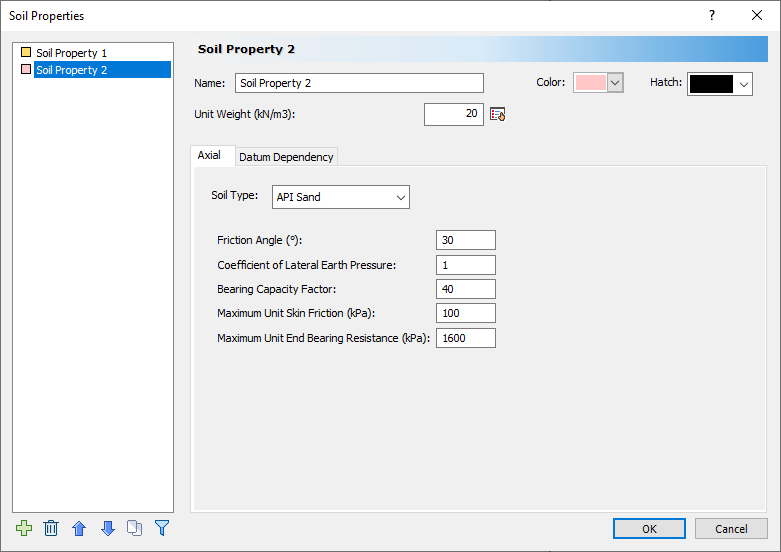
- Select Soil Property 2. This is the Sand Soil layer. Enter the following properties in the Axial tab:
- Unit Weight (kN/m3) = 20
- Soil Type = API Sand
- Friction Angle = 30
- Coefficient of Lateral Earth Pressure = 1
- Bearing Capacity Factor = 40
- Maximum Unit Skin Friction (kPa) = 100
- Maximum Unit End Bearing Resistance (kPa) = 1600
- Click OK.
3.2 Edit Borehole
- Select Soils > Edit All

- Click Insert layer below
 to add the Soil Property 2 layer.
 - Set the layer Thickness as:
- Soil Property 1 = 5
- Soil Property 2 = 20
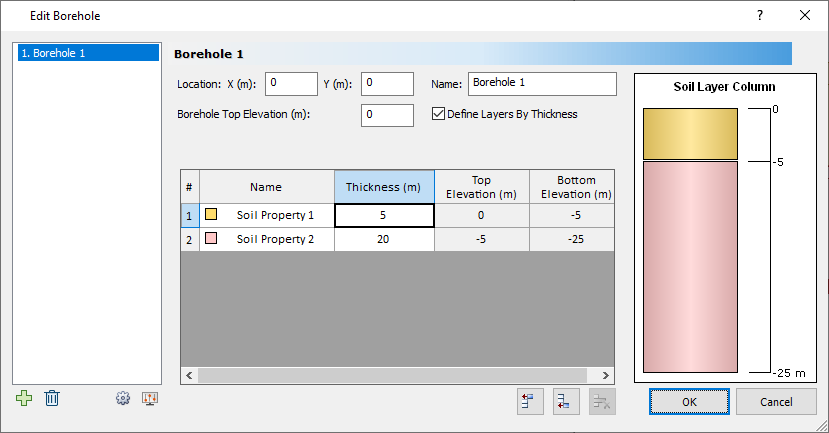
- Click OK.
4.0 Piles
4.1 Define Pile Section Properties
- Select Piles > Pile Sections
 to open the Define Pile Section Properties dialog.
 - Enter the following properties:
- Section Type = Reinforced Concrete
- Compressive Strength f'c (kPa) = 34000
- Cross Section = Circular
- Diameter (m) = 0.6
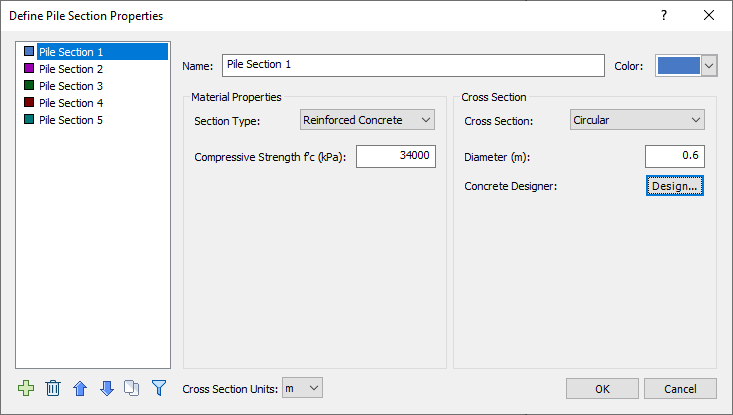
- Click Design to open the Concrete Designer.
- In the Reinforcement tab, click Add
 to add a reinforcement pattern.
 - Change the Rebar Size to USA > US Std. #8. Leave all other fields as their default.
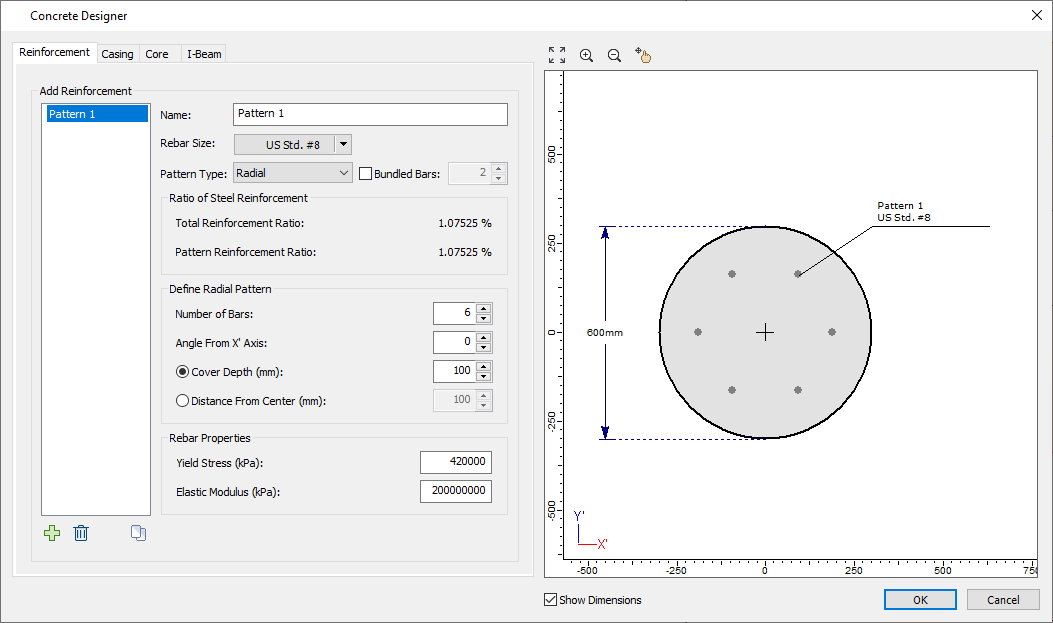
- Click OK to close the Concrete Designer dialog.
- Click OK to close the Define Pile Section Properties dialog.
4.2 Edit Pile Type
- Select Piles > Pile Types
 to open the Edit Pile Types dialog.
 - For Pile Type 1, enter Length (m) = 20.
- Click OK.
Now your soil layers and pile type are ready.
4.3 Add Pile
- Select Piles > Single
 to add the pile to the model.
 - In the General tab, note that Pile Type 1 (which we defined in the previous section) is already selected by default.
- Go to the Advanced tab and check the box for Pushover analysis. Change the Displacement (Maximum Deflection Z) to -12mm.
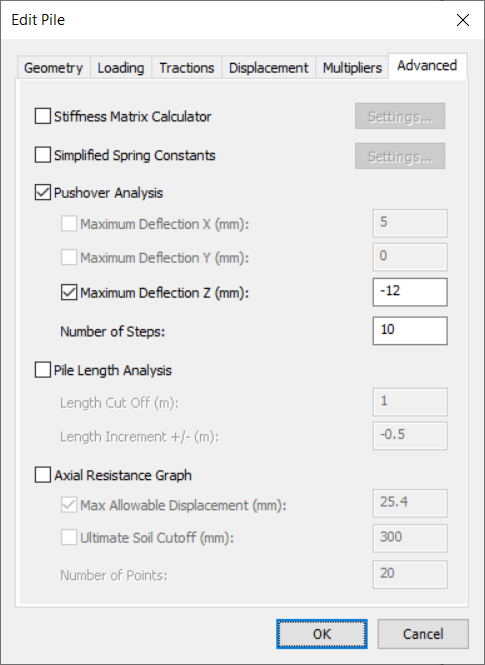
- Note that the Number of Steps is already set to 10.
- Click OK to place the pile at (0,0).
The pile section will appear in the 2D layout and 3D view.
5.0 Results
- Select Results > Compute

5.1 Pile Pushover
- To see the pushover results graphically, select Other
 > Pile Pushover, then use the mouse to select the pile in view and press Enter. (Alternatively, you can also right-click the pile and select Graph Pile Pushover.)
The results graphic layout will appear for you as shown below.
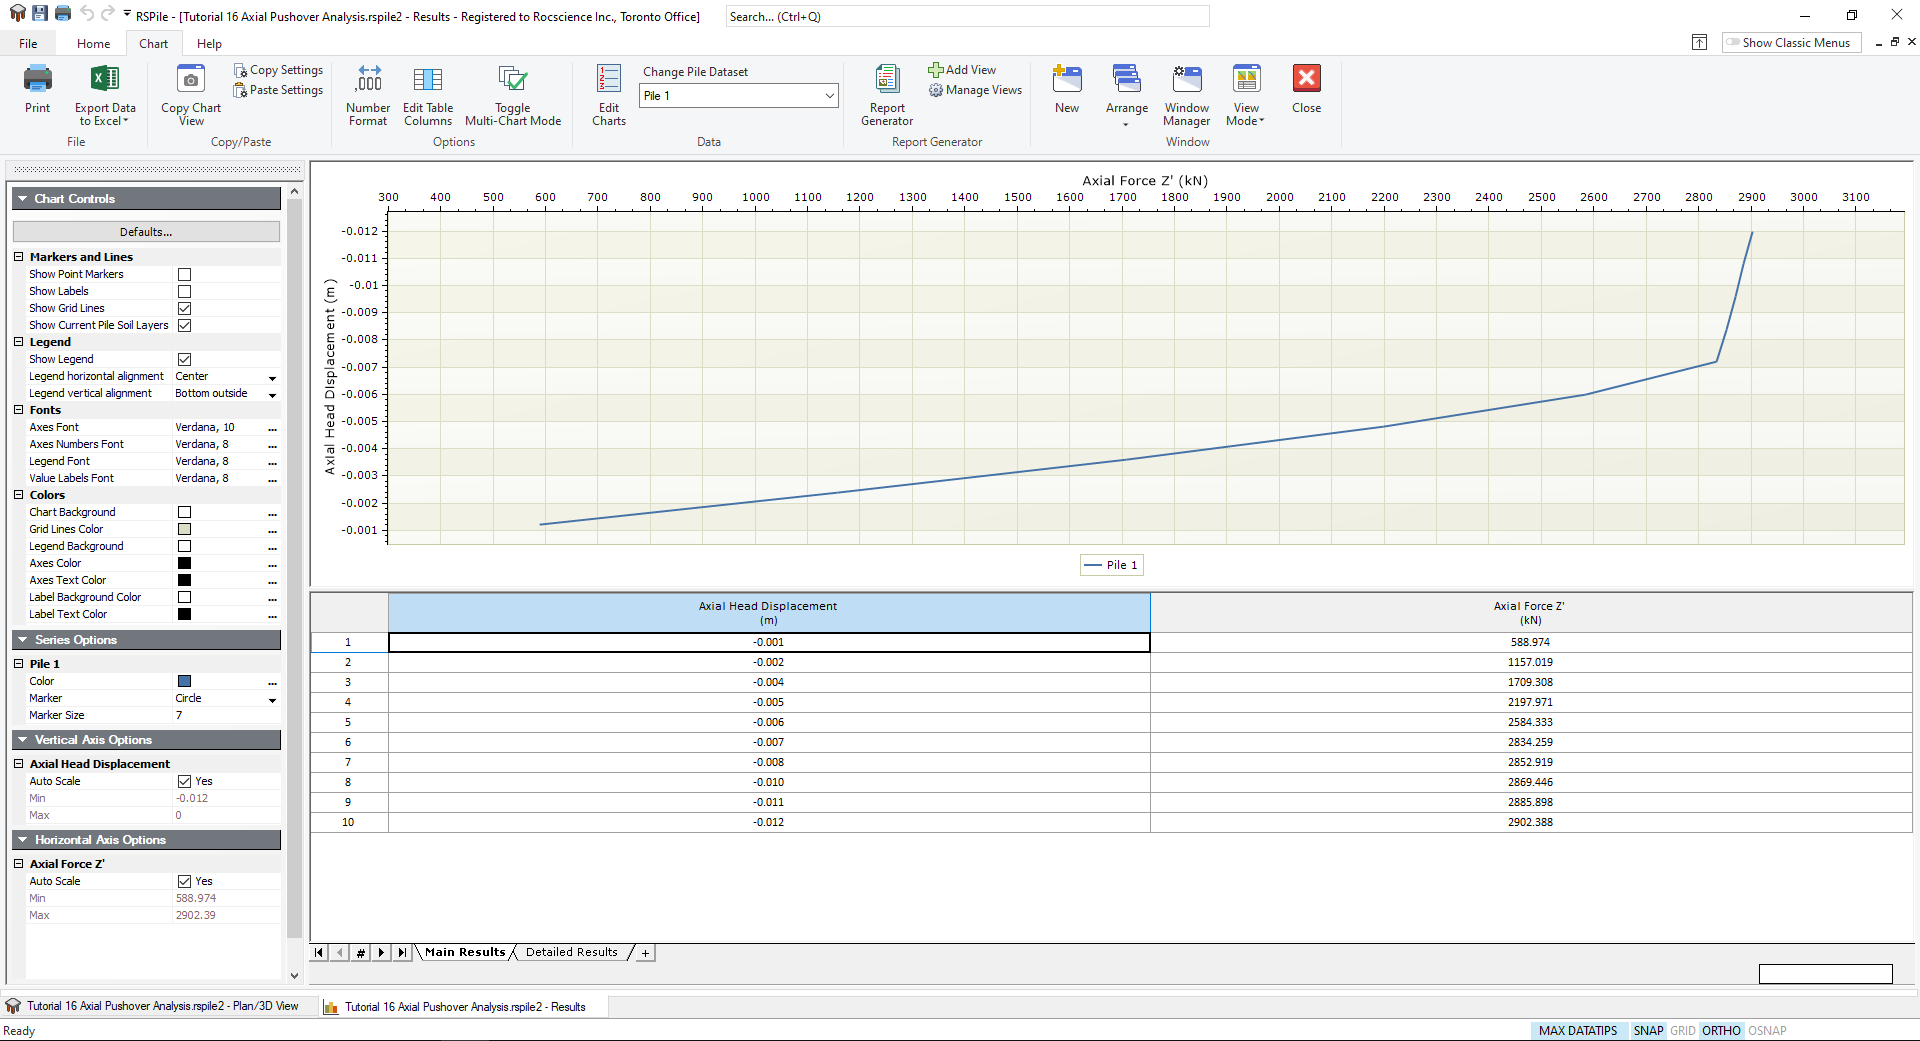
The appearing graph is your load settlement curve with the values of points in the table below the graph. You may change the views settings, graph settings and control table decimal digits from the tools
available at the left pane and the top ribbon.
5.2 Other detailed results
You may see detailed results at each step of loading by selecting the Detailed Results tab at the bottom. Use the drop down menu under Change Pile Dataset to choose the load step you want shown.
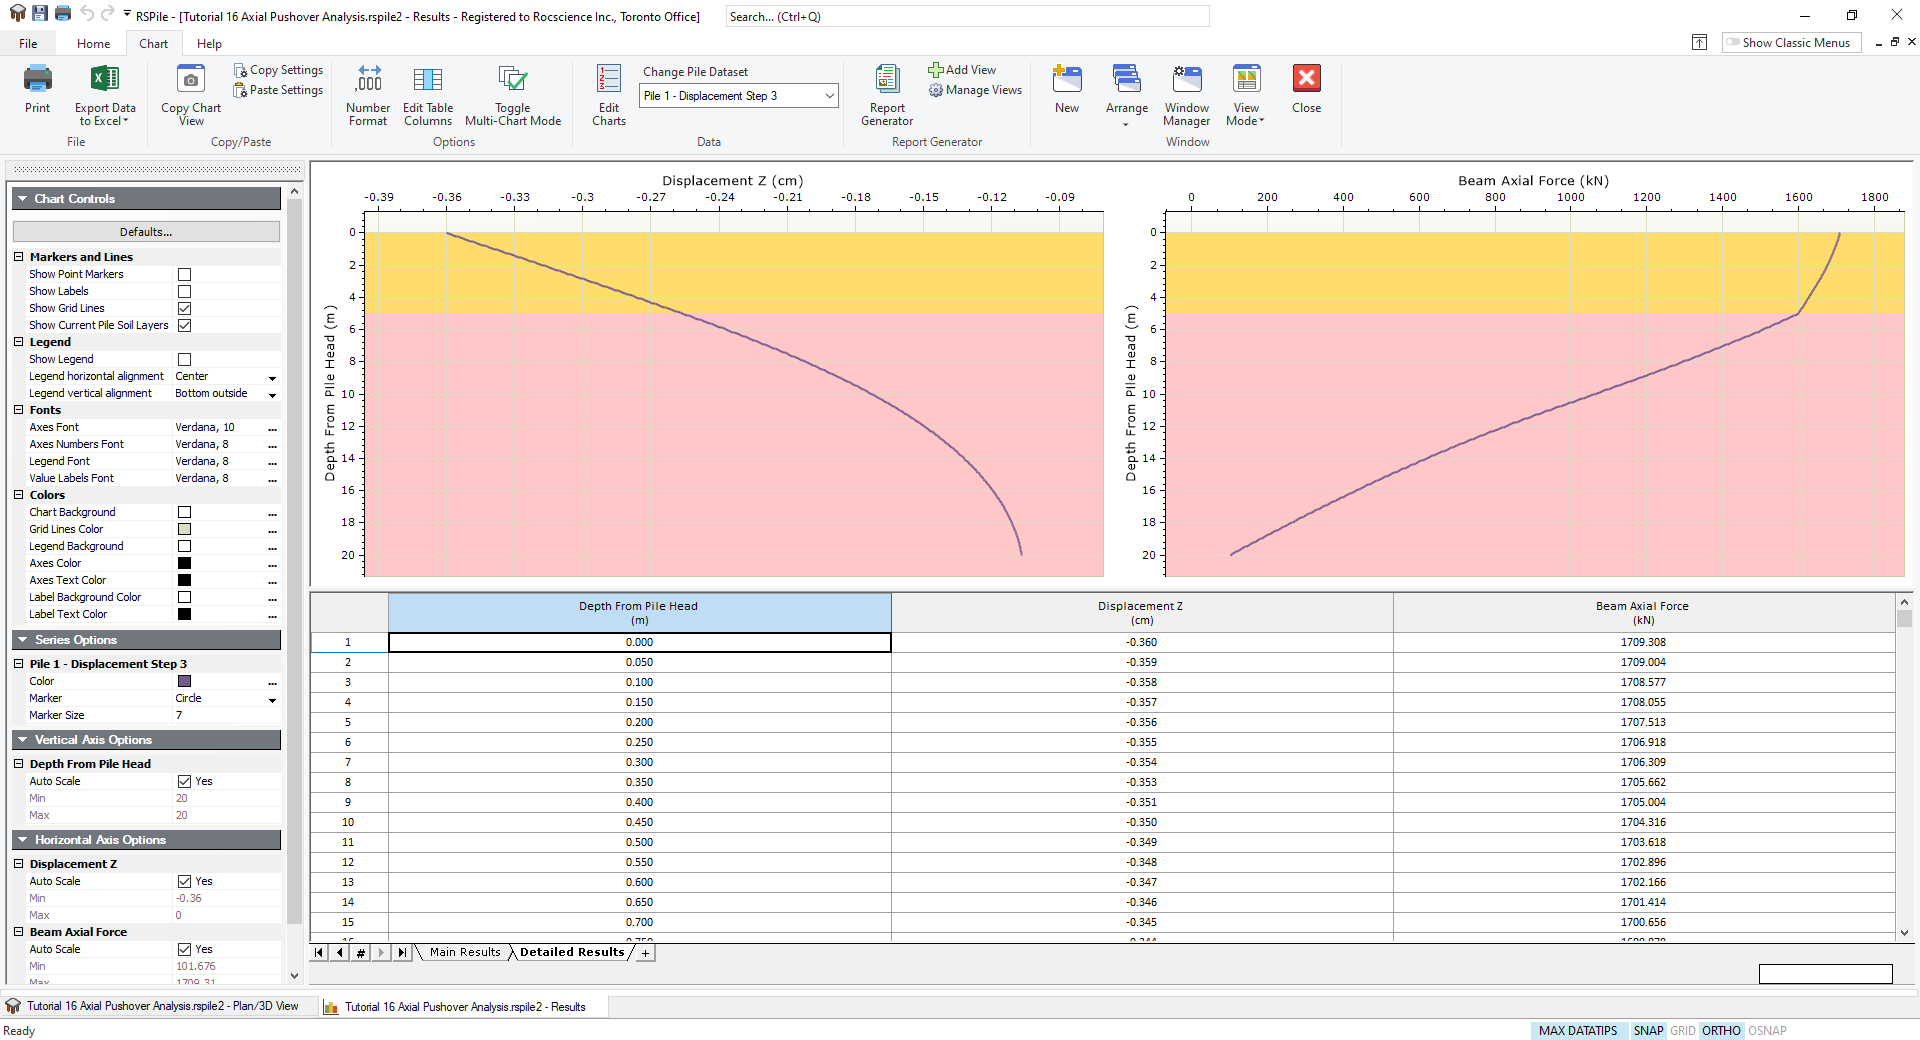
You may add or delete graphs and table columns by right-clicking the on the graph view or by using the Edit Charts and Edit Table Columns options. In Axial Pushover Analysis you may get the skin friction distribution, axial load distribution, soil reaction, soil springs stiffnesses, and displacement along the pile depth and elevation.