2 - Sensitivity Analysis
This tutorial helps you become familiar with the process of conducting a Sensitivity analysis in RocPlane. A Sensitivity analysis allows you to determine the "sensitivity" of the Factor of Safety to variations in the input data. This is done by varying one variable at a time while keeping all other variables constant.
Topics Covered in this Tutorial:
- Input Data
- Sensitivity Plot
- Sampler
Finished Product:
The finished product of this tutorial can be found in the Tutorial 2 Sensitivity Analysis.pln4 file, located in the Examples > Tutorials folder in your RocPlane installation folder.
1.0 Introduction
A Sensitivity analysis in RocPlane allows you to determine the “sensitivity” of the Factor of Safety to variation in the input data variables. The analysis process is as follows:
- The user specifies a minimum and a maximum value for one or more selected input parameters.
- Each parameter is then varied in uniform increments between the minimum and maximum values, and the Factor of Safety of the Global Minimum Slip Surface is calculated at each value. While a parameter is varied, all other input parameters are held constant at their mean values.
- This results in a plot of Safety Factor versus each varied input parameter (a Sensitivity plot) that allows you to determine the “sensitivity” of the Factor of Safety to the variations.
- A steeply changing curve on a Sensitivity plot indicates that the Factor of Safety is sensitive to the value of the parameter.
- A relatively flat curve indicates that the Factor of Safety is not sensitive to the value of the parameter.
- A Sensitivity Plot can also be used to determine the value of a parameter that corresponds to a specified Factor of Safety (e.g. Factor of Safety = 1).
From a practical standpoint, a sensitivity analysis indicates which input parameters may be critical to the assessment of slope stability, and which input parameters are less important.
2.0 Creating a New File
If you have not already done so, run the RocPlane program by double-clicking the RocPlane icon in your installation folder or by selecting Programs > Rocscience > RocPlane > RocPlane in the Windows Start menu.
When the program starts, a default model is automatically created. If you do NOT see a model on your screen:
- Select File > New

Whenever a new file is created, the default input data forms a valid wedge, as shown in the image below.
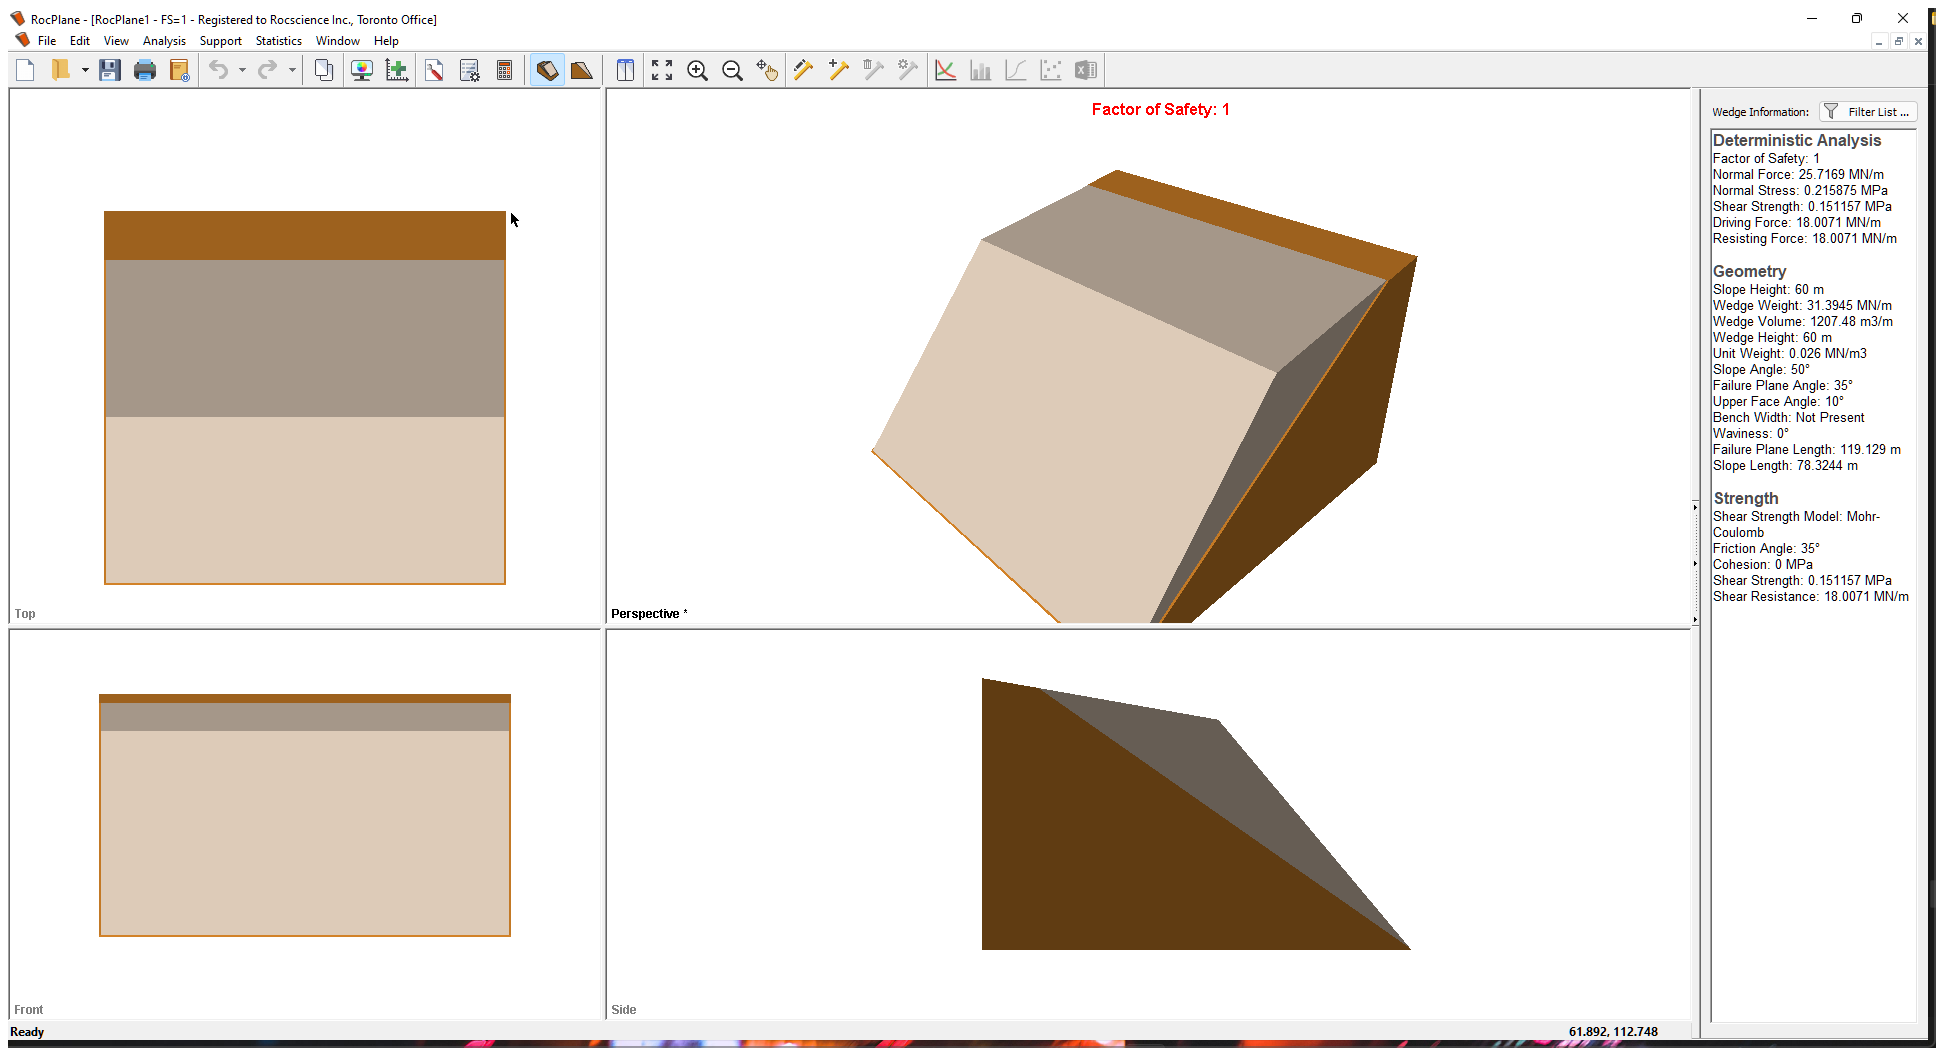
If the RocPlane application window is not already maximized, maximize it now so that the full screen is available for viewing the model.
Notice the four-pane, split screen format of the display, which shows Top, Front, Side and Perspective views of the model. This view is referred to as the 3D Wedge View. The Top, Front and Side views are orthogonal with respect to each other i.e., viewing angles differ by 90 degrees.
Before we proceed, it is very important to note the following:
- Although RocPlane displays the model in a three dimensional format, the RocPlane analysis is strictly a two-dimensional analysis. The 3D display is solely for the purpose of improved visualization of the problem geometry.
- All input data assumes that the problem is uniform in the direction perpendicular to the wedge cross-section. The analysis is performed on a “slice” through the cross-section of unit width.
- All analysis results (e.g., Wedge Weight, Wedge Volume, Normal Force, Resisting Force, Driving Force, etc.) and input data are therefore stated in terms of force per unit length, volume per unit length, etc.
3.0 Model
Variations in the variables for a Sensitivity analysis are set up in the Sensitivity Input dialog. To open the dialog:
- Select Sensitivity Analysis
 on the toolbar or Analysis > Sensitivity in the menu.
 - Select the first check box in the dialog and keep the default data for now.
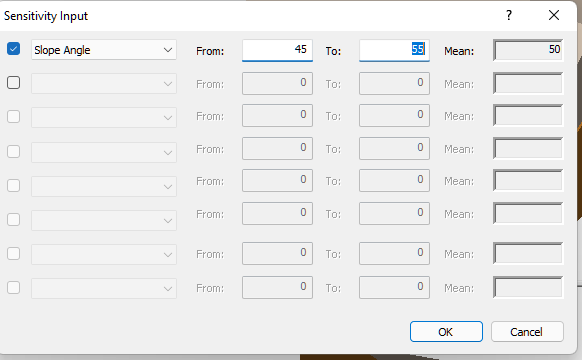
- Click OK.
The following graph is generated.
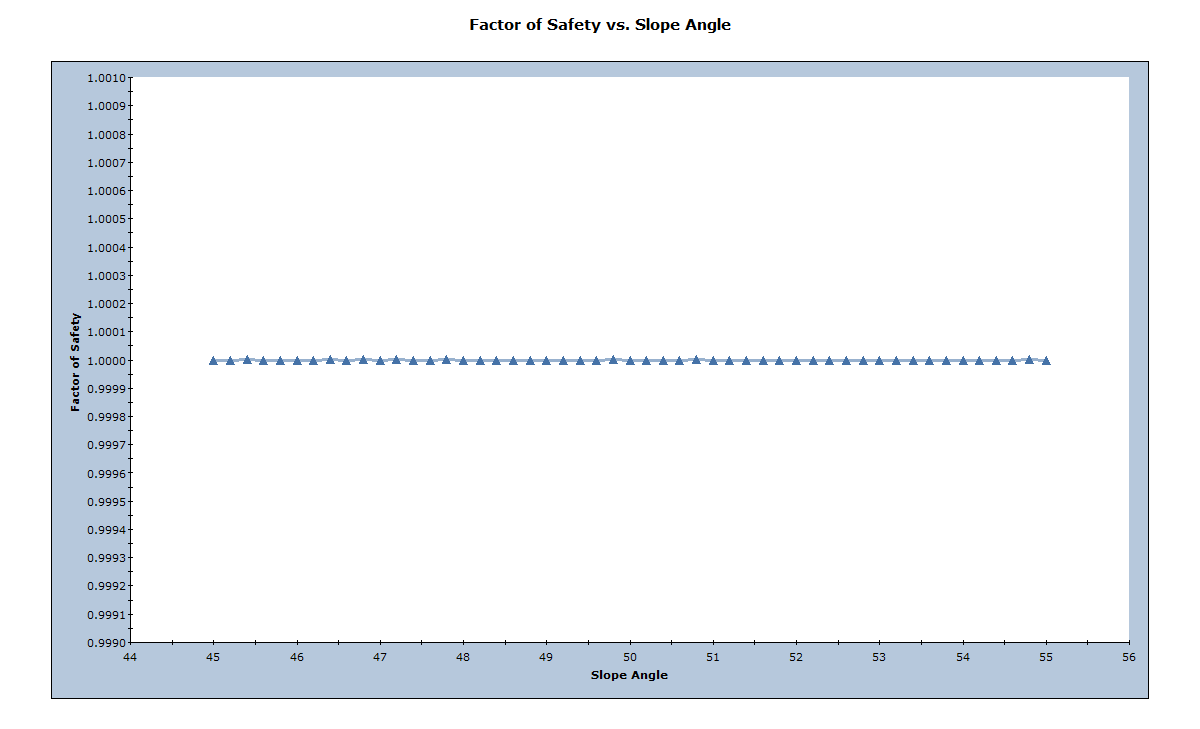
In this case, the Sensitivity plot shows no change in the Factor of Safety since the Slope Angle is changed. This is because the failure plane has only Mohr-Coulomb frictional strength defined. Changing the Slope Angle only changes the Wedge Weight but, since the strength is only frictional, this does not change the Factor of Safety. In addition, the friction angle is equal to the failure plane angle, so the Safety Factor = 1. Close the sensitivity plot.
Close the Sensitivity plot by clicking the X in the upper-right corner.
3.1 INPUT DATA
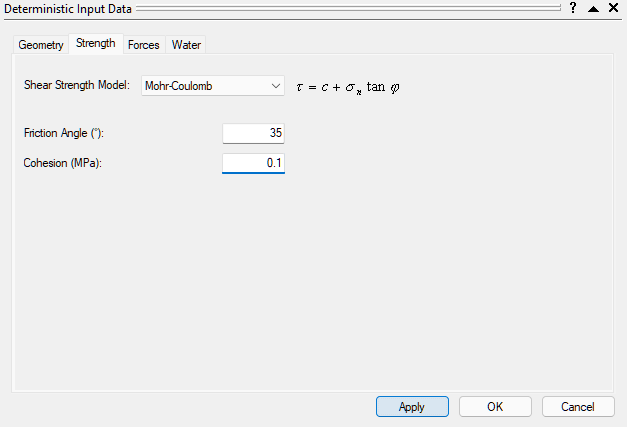
Let’s now make one change to the input data, using the Input Data dialog. We'll add Cohesion to the Failure Plane Strength and see how this affects the Sensitivity plot. To open the Input Data dialog:
- Select Analysis > Input Data

- Select theStrength tab.
- Set Cohesion (MPa) = 0.1.
- Click OK.
3.2 SENSITIVITY ANALYSIS
Now we'll generate another Sensitivity plot.
- Select Sensitivity Analysis on the toolbar or Analysis > Sensitivity in the menu.
- Again select the first check box and leave the default values.
- Click OK.
The plot should now look as follows.
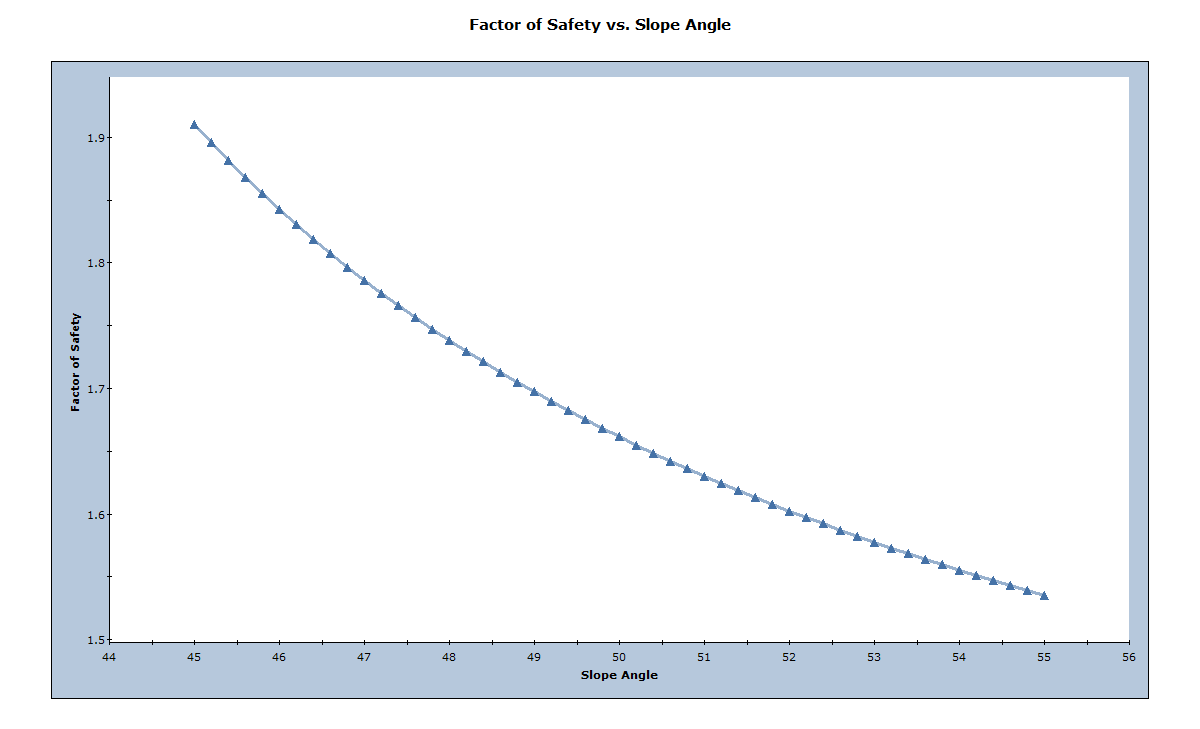
Because we've added Cohesion to the Failure Plane Strength, the Factor of Safety is now dependent on the Slope Angle. Larger slope angles increase the size and weight of the wedge and decrease the Factor of Safety because Cohesion provides a constant resisting force versus an increasing driving force due to wedge weight.
3.3 MULTI-VARIABLE SENSITIVITY ANALYSIS
You can modify the data in an existing Sensitivity plot by right-clicking the mouse in the plot and selecting Change Plot Data on the popup menu.
- Do this now and change the input data as shown in the dialog below.
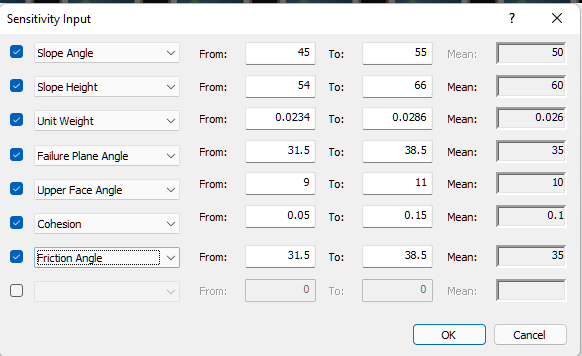
- Click OK.
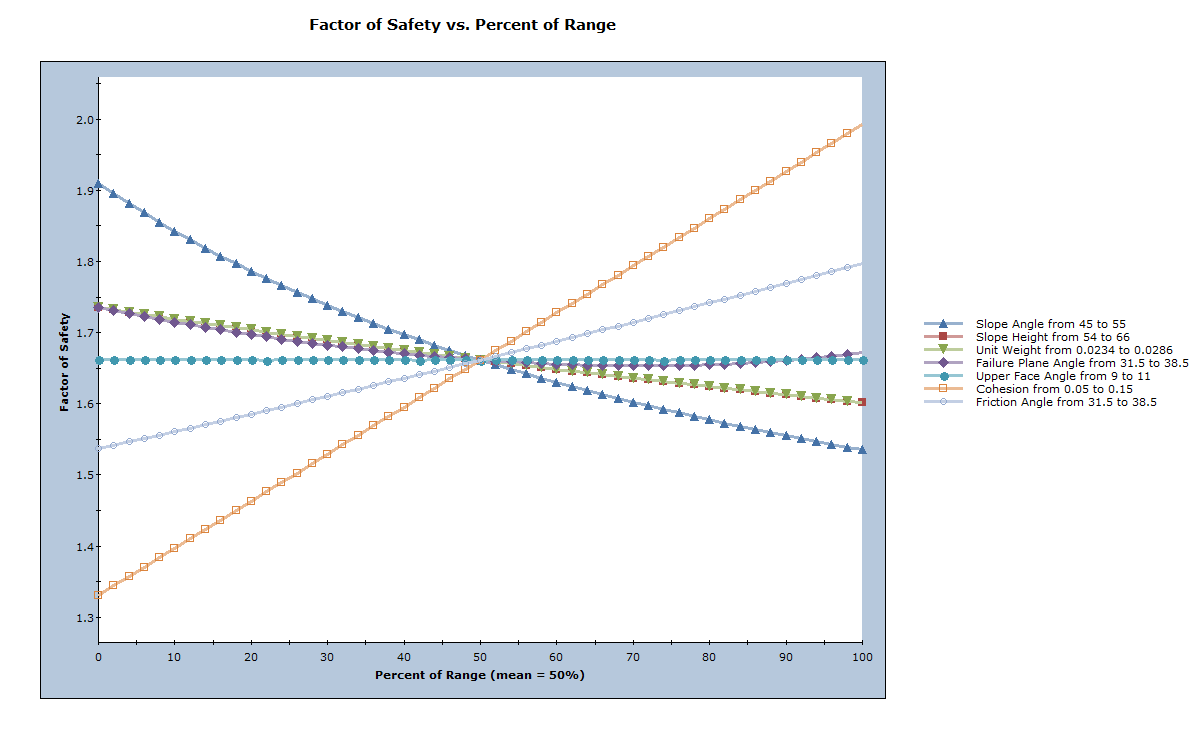
The graph will now display several curves.
NOTE:
- In the Sensitivity Input dialog, the From and To values can be user-defined.
- All of the above-entered values are the default values except Cohesion, for which we entered From = 0.05 and To = 0.15.
- The Mean value of each variable is determined from the Input Data dialog, and CANNOT be changed in the Sensitivity Input dialog.
- When more than one input data variable is plotted on a Sensitivity plot, the horizontal axis is in terms of Percent of Range rather than the actual variables. The Percent of Range is the relative difference between the minimum (From) value of a variable ( 0 percent) and the maximum value (To) of a variable (100 percent).
- Note that all curves intersect at Percent of Range = 50% because the range of each variable is symmetrical about the Mean value. Since we did not change any of the default From or To values (except for Cohesion), all curves intersect at a point, equivalent to the Mean wedge data in the Input Data dialog.
4.0 Minimum FS Location for a Tension Crack
As one final exercise, we'll use Sensitivity analysis to verify the Minimum FS Location option for a Tension Crack. The Minimum FS Location option automatically determines the location of the Tension Crack that produces the Minimum Factor of Safety.
- Re-open the Input Data dialog.
- In the Geometry tab, select the Tension Crack check box.
The Minimum FS Location option is selected by default. - Click Apply.
Note that the Distance from Crest (m) = 19.7 (displayed in the greyed-out edit box). - Select the Specify Location option.
- Click OK.
- Open the Sensitivity Analysis dialog.
- Select the first check box and select Distance From Crest in the drop-down.
- Set From = 0 and To = 47.
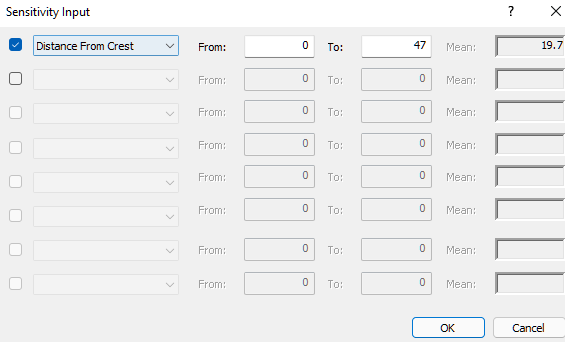
- Click OK.
You should see the following graph.
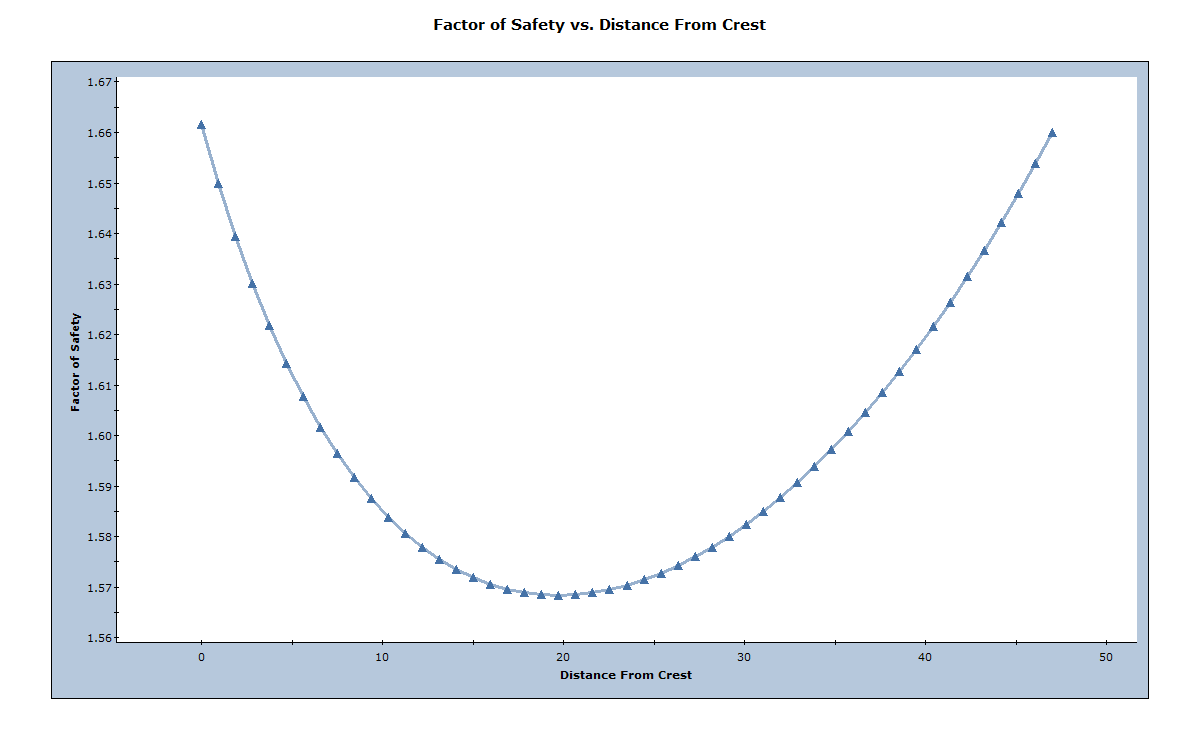
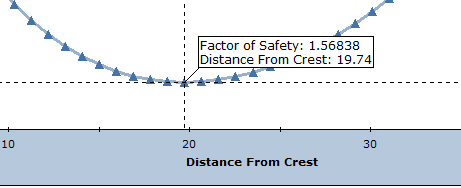
If you examine this graph, you can see that the Minimum Factor of Safety occurs when the Tension Crack is around 20 meters from the crest. This corresponds to the value determined from the Minimum FS Location option for a Tension Crack (19.7 meters). You can verify this using the Sampler option as follows:
- Right-click on the graph and select Sampler > Show Sampler in the popup menu.
Finally, note that the maximum (To) value which we entered in the Sensitivity Input dialog for the Distance from Crest (47 meters) was based on the maximum Bench Width. If you go back to the Geometry tab in the Input Data dialog, you can see this value in the greyed out edit box underneath the Bench Width option. The maximum Bench Width is determined from the Slope Height and the wedge geometry, and also represents the maximum distance at which a Tension Crack can be located from the crest.
Note the following additional learning points:
- Notice that a Chart Properties option is available in the right-click menu on all graph views. This allows you to customize chart axes and colours.
- The Sampler option available in the right-click menu allows you to obtain exact values of points on the sensitivity curves (for details of the Sampler option, see Tutorial 03 - Probabilistic Analysis in RocPlane).
- Chart data can be exported and graphed in Excel with a single mouse click. The Chart in Excel
 option is available in the toolbar, the View menu, or the right-click menu.
This concludes the tutorial. You are now ready for the next tutorial, Tutorial 03 - Probabilistic Analysis in RocPlane.