6 - Bench Design
This tutorial will familiarize the user with the Bench Design features of RocPlane by analyzing an open pit mine example.
Topics Covered in this Tutorial:
- Random Variables
- Persistence Analysis
- Bench Loss
- Managed Slope Design
- Quantitative Hazard Analysis
Finished Product:
The finished product of this tutorial can be found in the Tutorial 6 Bench Design.pln4 file, located in the Examples > Tutorials folder in your RocPlane installation folder.
1.0 Introduction
Slope instabilities in open pit mines present a significant design challenge in geotechnical engineering. Such failures can be controlled by major structures (e.g. faults or lithologic contacts), which have sufficient lengths to affect overall stability, or by more numerous, smaller structures such as joints, foliations and bedding planes. While a number of tools are available to analyze potential large scale slope failures (such as the Rocscience program Slide2), using such methods to design an open pit mine slope may result in unanticipated instabilities caused by bench failure. Small scale failures can have a direct influence on the overall slope angle and therefore must be considered.
RocPlane includes a Bench Design function that allows the user to assess the stability of bench-scale wedges for a range of bench face angles. To do so, two design approaches are available: a managed approach to slope design and a quantitative hazard assessment. By using the managed approach, the user is able to assess the number of failed wedges and minimum bench width required for each bench face angle. For a quantitative assessment, the user is able to estimate the likelihood of forming different wedge sizes (Probability of Occurrence) and the likelihood that such wedges will slide (Probability of Sliding), which provides an estimate of the Probability of Failure for various back break distances. Both of these approaches provide valuable information on bench loss and assist the user in selecting an optimum bench face angle.
2.0 Creating a New File
If you have not already done so, run the RocPlane program by double-clicking the RocPlane icon in your installation folder or by selecting Programs > Rocscience > RocPlane > RocPlane in the Windows Start menu.
When the program starts, a default model is automatically created. If you do NOT see a model on your screen:
- Select File > New

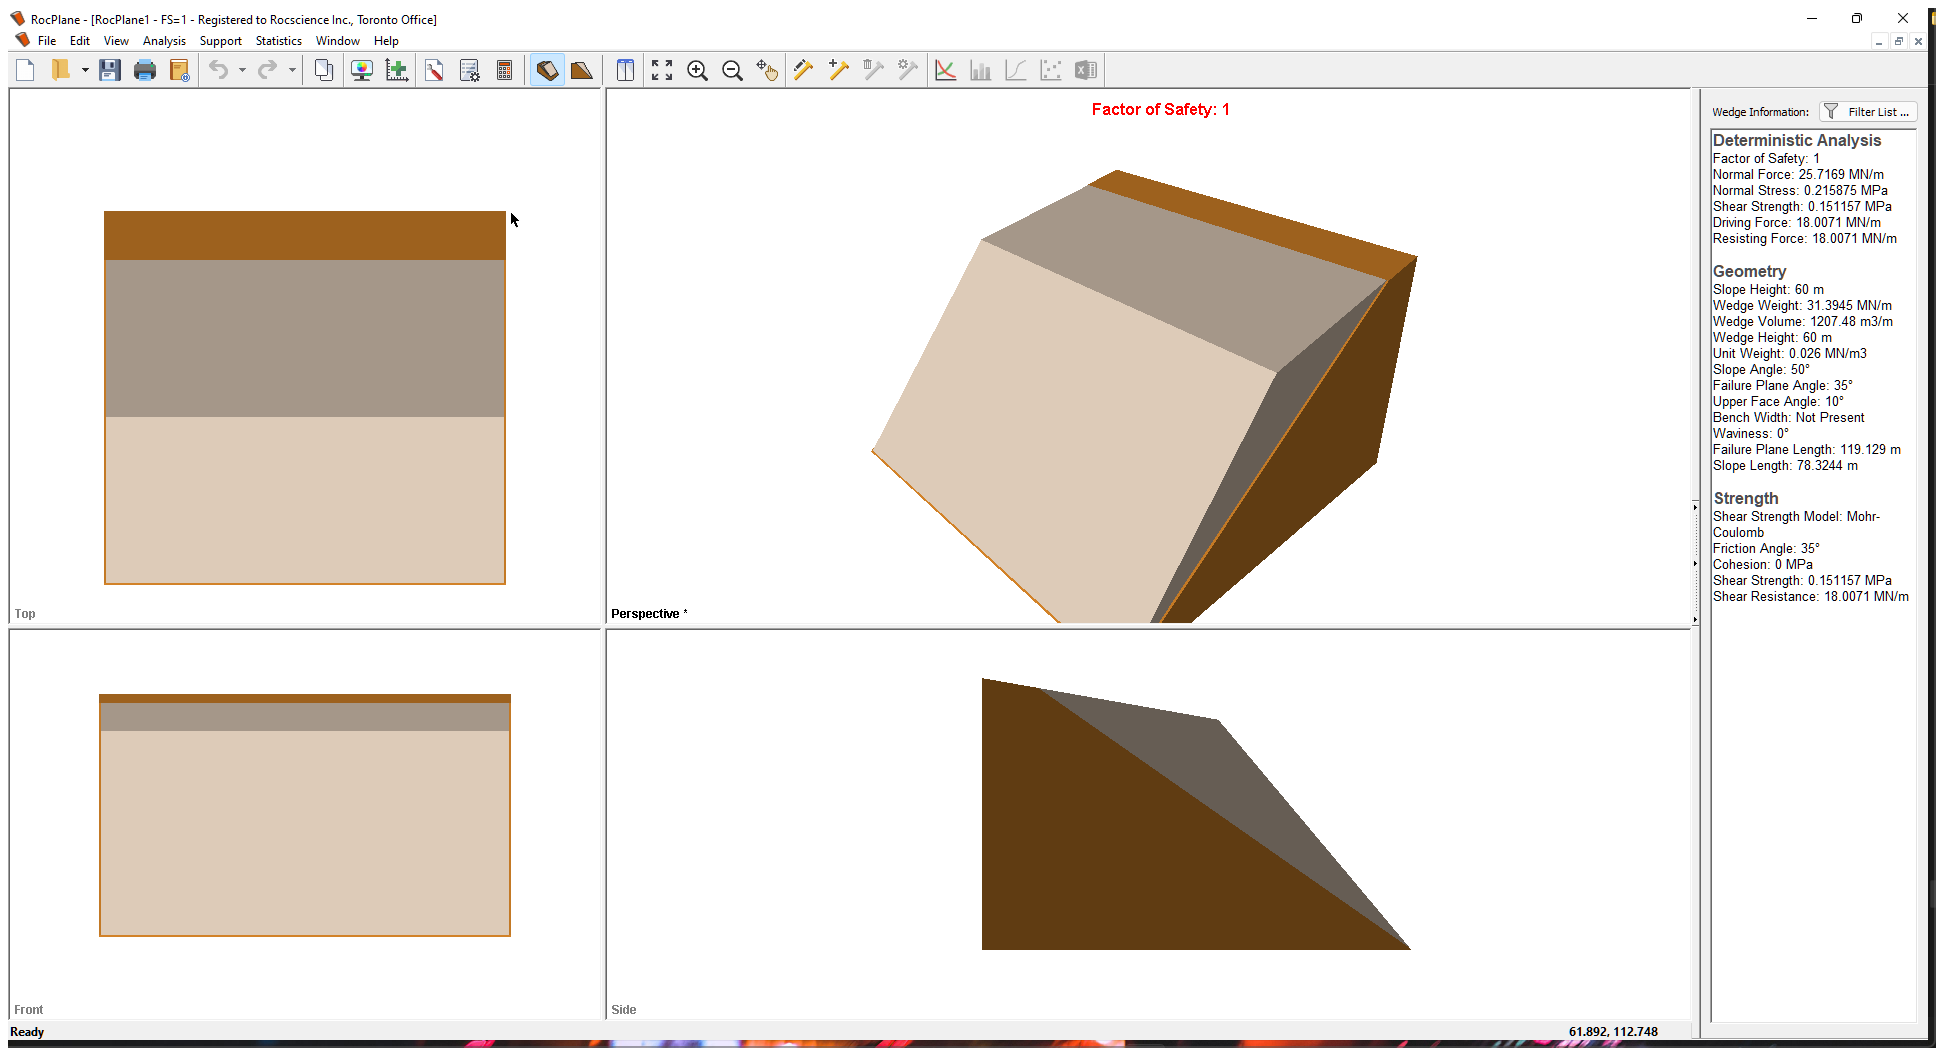
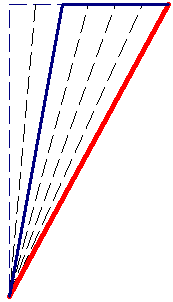
Whenever a new file is created, the default input data forms a valid wedge, as shown in the image below.
If the RocPlane application window is not already maximized, maximize it now so that the full screen is available for viewing the model.
Notice the four-pane, split screen format of the display, which shows Top, Front, Side and Perspective views of the model. This view is referred to as the 3D Wedge View. The Top, Front and Side views are orthogonal with respect to each other i.e., viewing angles differ by 90 degrees.
Before we proceed, it is very important to note the following:
- Although RocPlane displays the model in a three dimensional format, the RocPlane analysis is strictly a two-dimensional analysis. The 3D display is solely for the purpose of improved visualization of the problem geometry.
- All input data assumes that the problem is uniform in the direction perpendicular to the wedge cross-section. The analysis is performed on a “slice” through the cross-section of unit width.
- All analysis results (e.g., Wedge Weight, Wedge Volume, Normal Force, Resisting Force, Driving Force, etc.) and input data are therefore stated in terms of force per unit length, volume per unit length, etc.
3.0 Model
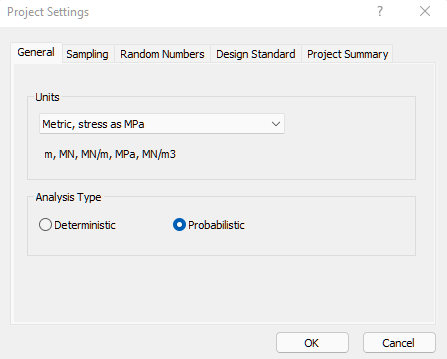
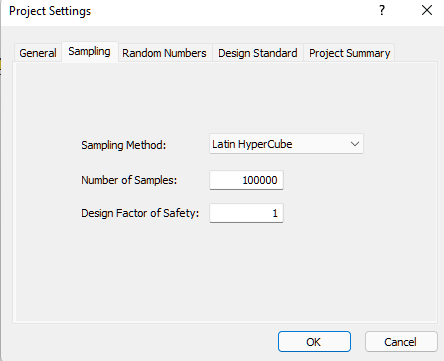
3.1 PROJECT SETTINGS
The Project Settings dialog allows you to configure the main analysis settings for your model. To open the dialog:
- Select Analysis > Project Settings
 in the menu or click on the icon in the toolbar.
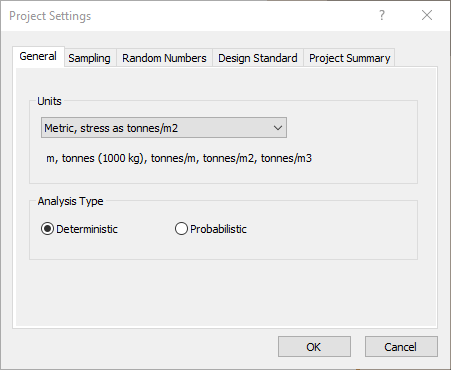
- In the General tab, set Analysis Type = Probabilistic.
- Set Units = Metric, stress as MPa Units.
- Select the Sampling tab.
- Set Sampling Method = Latin Hypercube and Number of Samples = 100000.
- Select the Random Numbers tab.
- Make sure Random Number Generation = Pseudo-random and Specify Seed is unchecked.
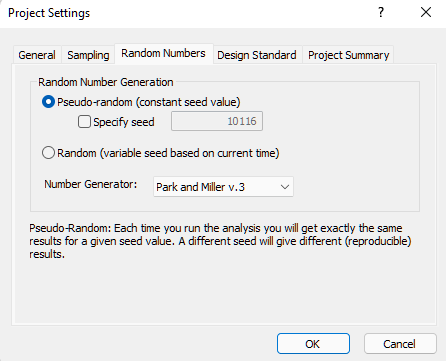
- Click OK to save changes and close the Project Settings dialog.
3.2 INPUT DATA
Now let’s define the slope and joint properties in the Input Data dialog. To open the dialog:
- Select Analysis > Input Data

- Select the Slope tab.
- Enter Angle Mean Value = 60 and Height Mean Value = 15.
- Make sure Statistical Distribution for both is set to None.
- Make sure the Unit Weight Mean Value = 0.026.
- Select the Minimum Wedge Size check box and enter a Weight of 0.001MN.
For this analysis, we are going to ignore very small wedges as they do not pose a risk to the open pit.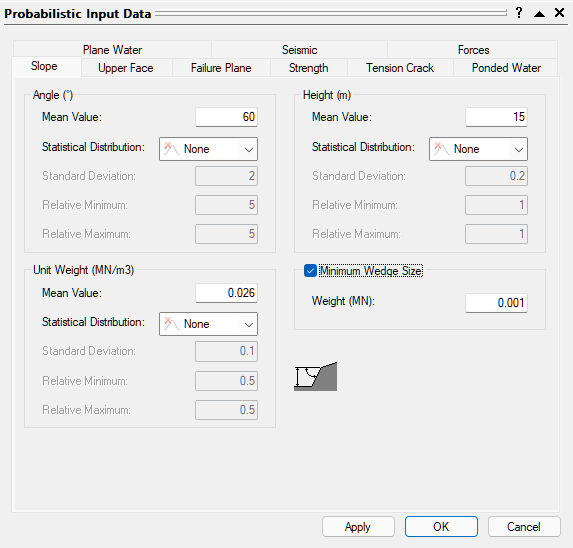
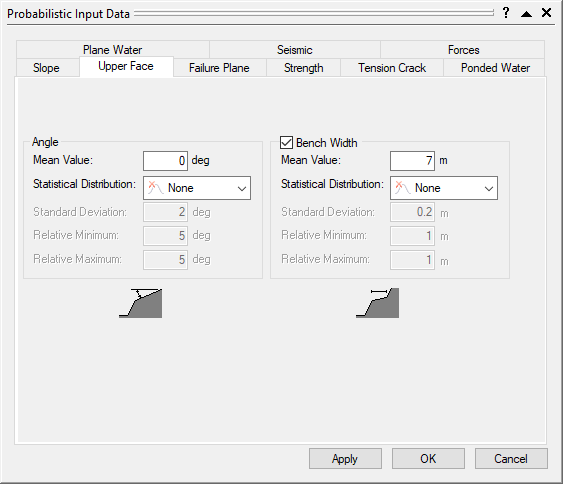
- Select the Upper Face tab.
- Set Angle Mean Value = 0.
- Select the Bench Width check box and enter a Mean Value of 7m.
- Make sure Statistical Distribution for both is set to None.
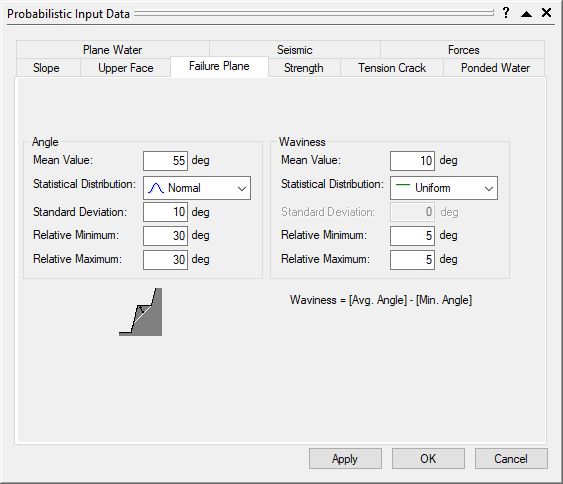
- Select the Failure Plane tab.
- Set Angle Mean Value = 55o, Statistical Distribution = Normal, Standard Deviation = 10, and Relative Minimum and Relative Maximum = 30.
- Set Waviness Mean Value = 10, Statistical Distribution = Uniform, and Relative Minimum and Relative Maximum = 5.
- Select the Strength tab.
- Set the Shear Strength Model to Mohr-Coulomb and make sure the Random Variables option is set to Parameters.
- Enter Cohesion Mean Value = 0 and set the Statistical Distribution to None.
- Set Friction Mean Value = 35, Statistical Distribution to Normal, Standard Deviation = 3, and Relative Minimum and Relative Maximum = 9.
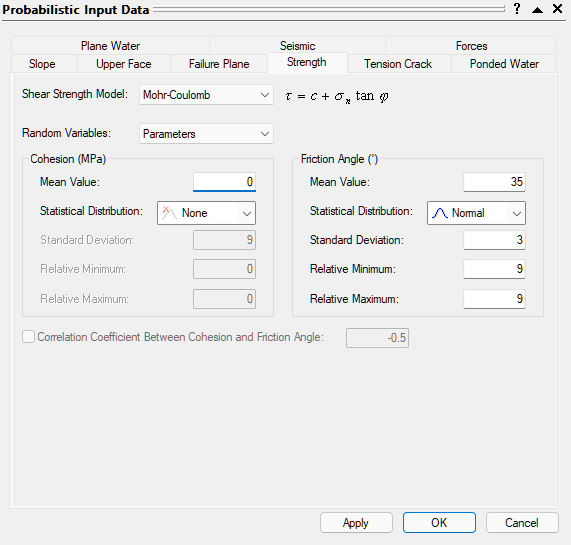
- Click OK to save your changes, compute the Probability of Failure, and exit the Input Data dialog.
4.0 Analysis Results
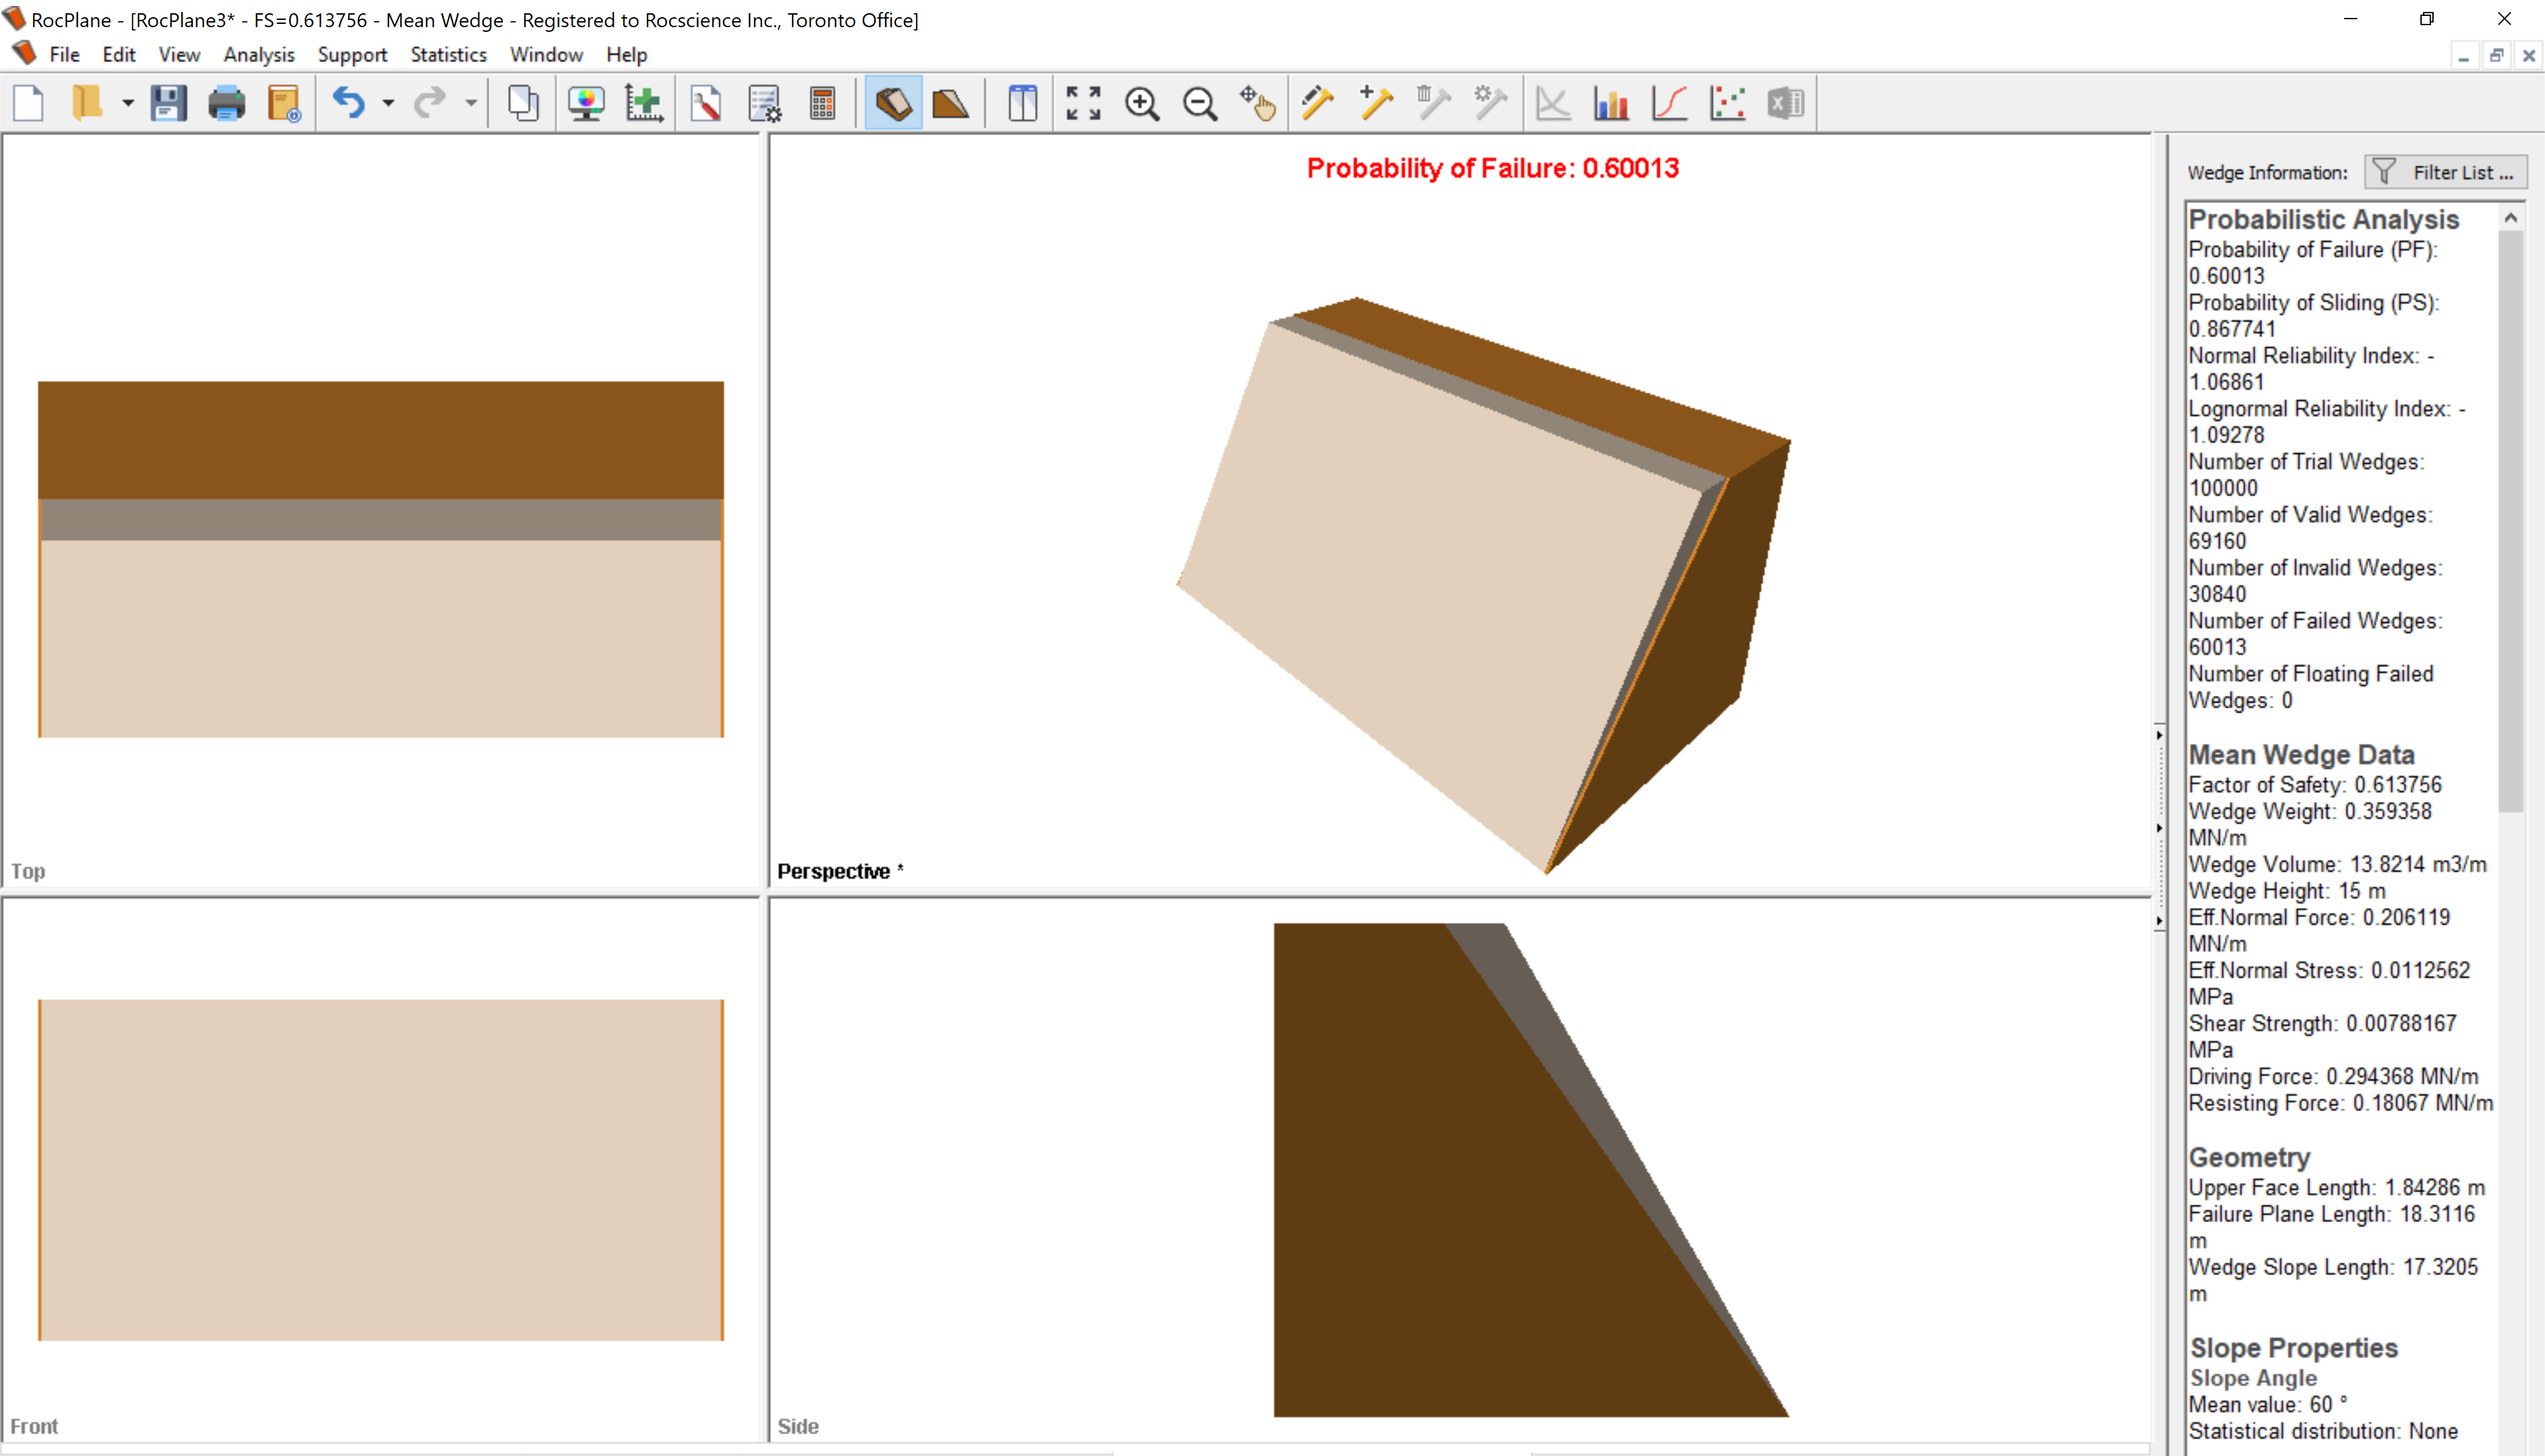
Computation of 100,000 Latin Hypercube samples occurs and the Probability of Failure is calculated as shown in the figure below.
Some of the notable results are:
- The results of the probabilistic analysis are summarized in the Sidebar information panel. The wedge computed using the mean values of all the input parameters is displayed along with its factor of safety results.
- The total probability of failure for the slope is 0.6004 or 60.04%. Out of the 100,000 samples, 69160 produced valid wedges. Of these, 60041 had a factor of safety less than 1.0 (failed). The probability of failure is therefore equal to #failed/total#samples = 60041/100000=0.6004.
- The mean wedge has a factor of safety approximately equal to 0.6138.
- It is important to remember that RocPlane will do its best to fit a wedge inside the slope dimensions. This means it tries to determine a maximum size wedge for any slope geometry.
The Probability of Failure for the slope is conservative (upper bound solution) since positional information and joint length is not accounted for and the maximum size wedge is computed. This limitation will be addressed in the next section.
5.0 Bench Design
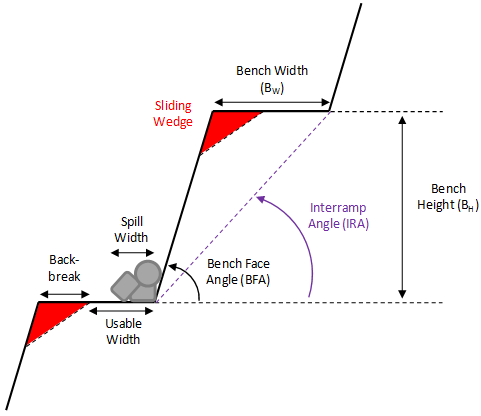
The bench plays a critical role in an open pit mine as it prevents rockfalls from upper levels of the pit slope from reaching the operational areas in lower levels. In order for the bench to be functional, the usable width must be sufficient to catch spillage from the benches above. In bench design, the “usable width” is defined as the total width of the bench minus the bench width lost during excavation. The amount lost is also referred to as the “backbreak distance” and is typically caused by planar or wedge failure along the crest.
For bench design, it is important for the engineer to determine (a) the number of failed wedges that are expected to occur, (b) the likelihood of different back break distances (Probability of Occurrence) and (c) the likelihood that a wedge with a given backbreak distance will slide (Probability of Sliding). When the Probabilities of Occurrence and Sliding are multiplied together, an estimate of the Probability of Failure is also obtained for a given backbreak distance, which can be used to assess the risk along the slope.
As the size of the wedges is controlled by the slope geometry, these probabilities are expected to change as the bench face angle changes. The goal of the bench design is therefore to determine the “optimum” orientation, which is defined as the steepest interramp angle that can be achieved while preserving adequate bench widths.
To assist in this, RocPlane allows for the failure characteristics for a number of different bench face angles to be assessed at the same time. It also allows for the creation of more reasonably sized wedges through the use of joint length statistics (either persistence or trace length can be used). This is done through the Bench Design Options dialog.
Two different analyses are available for bench design, depending on the nature of the problem being addressed:
The first uses a Fixed Bench Width, meaning that the interramp angle (IRA) will be calculated for the given bench width and bench face angle. This analysis would be used where the width of the bench is defined by an operation requirement.
A second analysis, which assumes a Fixed Interramp Angle, allows the user to set the IRA. This means that the bench width will change for each bench face angle considered. In this case, the minimum bench face angle must be greater than the IRA value to ensure a bench is created.
For this tutorial, we'll perform a Fixed Bench Width analysis.
- Select Analysis > Bench Design.
- Select the Bench Design check box.
- Make sure Fixed Bench Width is selected.
- Set Bench Width = 7 and # of Backbreak Cells = 20.
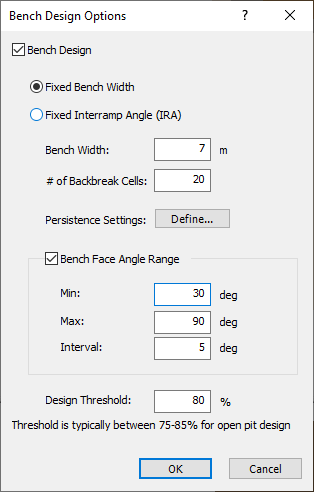
In order to calculate the Probabilities of Occurrence, Sliding and Failure along the bench, it must be divided into a series of “Backbreak Cells”. This allows the user to analyze the number of wedges that occur within that cell as well as the failure characteristics for each wedge. For this example, 20 backbreak cells will be used, meaning each cell is 7 / 20 = 0.35m wide.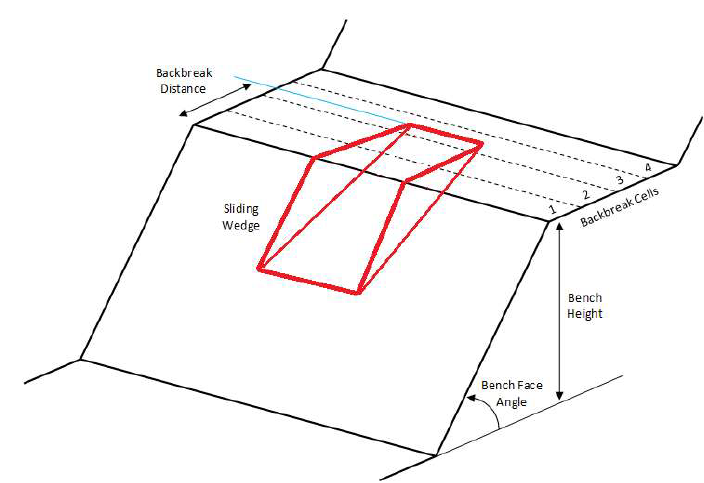
- To establish persistence characteristics for the joints, click the Define button next to Persistence Settings.
- In the Persistence Analysis dialog, make sure Joint Spacing = Small (Ubiquitous).
In the first analysis we do, we’re going to assume infinite persistence so do not toggle on the Joint 1 and 2 persistence settings.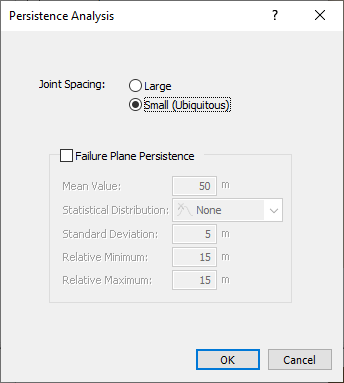
RocPlane looks at two possible conditions for joint spacing. If the spacing is Large, this means that there is only one trace of joint on the slope face. Thus only one wedge is generated on the slope. Its location or the elevation of the toe of the wedge is randomly chosen on the slope face. The persistence is then sampled for the wedge. If the persistence is not large enough to create a valid wedge, the wedge is deemed invalid (not forming). This is a lower bound solution for the probability of failure, as the spacing and persistence condition will limit the formation of wedges. Now consider if there is spacing (repeated joints) associated with the joint. No longer is there one wedge but a number of possible wedges that can form on the bench. If a wedge cannot form due to the persistence not being large enough, then what happens is a wedge higher up the slope face, which meets the persistence conditions, will form. If this is the case, then the Small or Ubiquitous joint spacing model is more applicable. This model will automatically scale down the wedge size until the persistence conditions are met. So a wedge is almost always formed in each simulation if the geometry of the joints and slope creates a kinematically feasible wedge. Its size is dependent on the sampled persistence and the geometry of the bench. This is an upper bound solution for probability of failure as the program will always create a wedge independent of any spatial location of the joints on the slope face. The only thing that limits the size of the wedge is the geometry of the bench and the persistence of the joints.
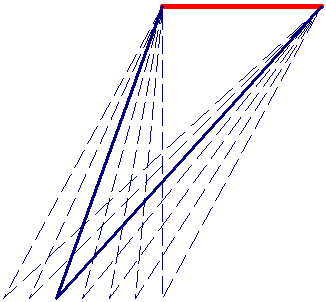
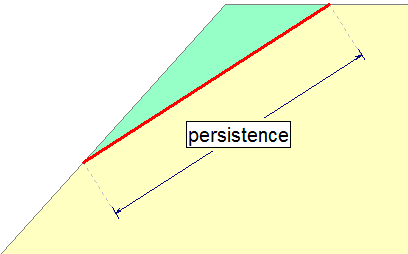
NOTE: In RocPlane, the definition of joint persistence is 2-dimensional, and is simply equal to the failure plane length as shown in the figure below.
- Click OK to save your changes in the Persistence Analysis dialog.
- Make sure the Bench Face Angle Range check box is selected.
- Set Min = 30, Max = 90, and Interval = 5.
- Set Design Threshold = 80.
For open pit design, this value is typically set between 75-85%. This threshold is also commonly associated with cases where the assumption is that of infinite persistence (Carvalho (2012), Gibson et al., 2006). If persistence is known to a high degree of certainty (rare), then this number will be higher. - Click OK to save your changes and close the Bench Design dialog.
6.0 Bench Design Results
Computation of 100000 Latin Hypercube samples occurs for each bench face angle (30 to 90 degrees in 5 degree increments). During this assessment, each valid wedge is assigned to one of the backbreak cells based on the width of the wedge measured from the crest. As an example, if a wedge has a width from the crest of 0.4m, it is assigned to the 0.35-0.7m backbreak cell.
A number of approaches are available to interpret the data from the bench analysis and assist with design. These include a managed approach to bench design as well as a quantitative hazard analysis.
6.1 MANAGED APPROACH TO BENCH DESIGN
In open pit mining, it is often acceptable to use steeper bench face angles and allow some failures to occur as long as safety is not compromised. While this will result in a greater amount of failed material on the bench (this is referred to as the spill width), the cost of regular bench cleanups is significantly less than the cost of excavating additional waste rock when using shallow bench angles. This concept, referred to as a managed approach, can be utilized in RocPlane through various plots.
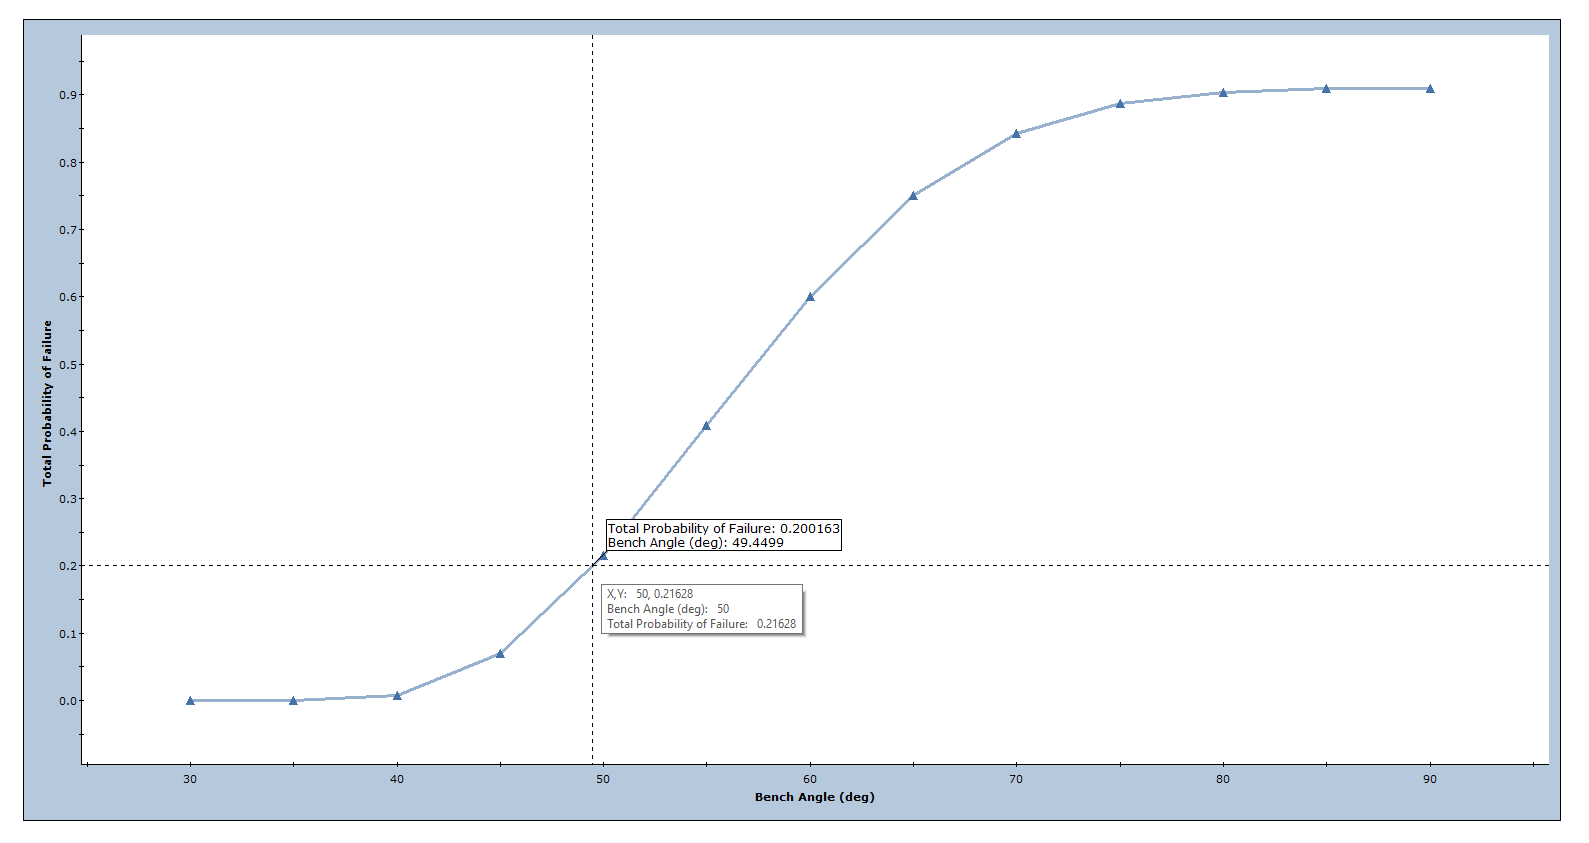
The first is the Total Probability of Failure plot, which is calculated for each bench face angle by dividing the total number of valid wedges with a factor of safety less than 1.0 (failed) by the total number of samples (100,000 in this case).
- Select: Statistics > Bench Design > Total Probability of Failure Plot
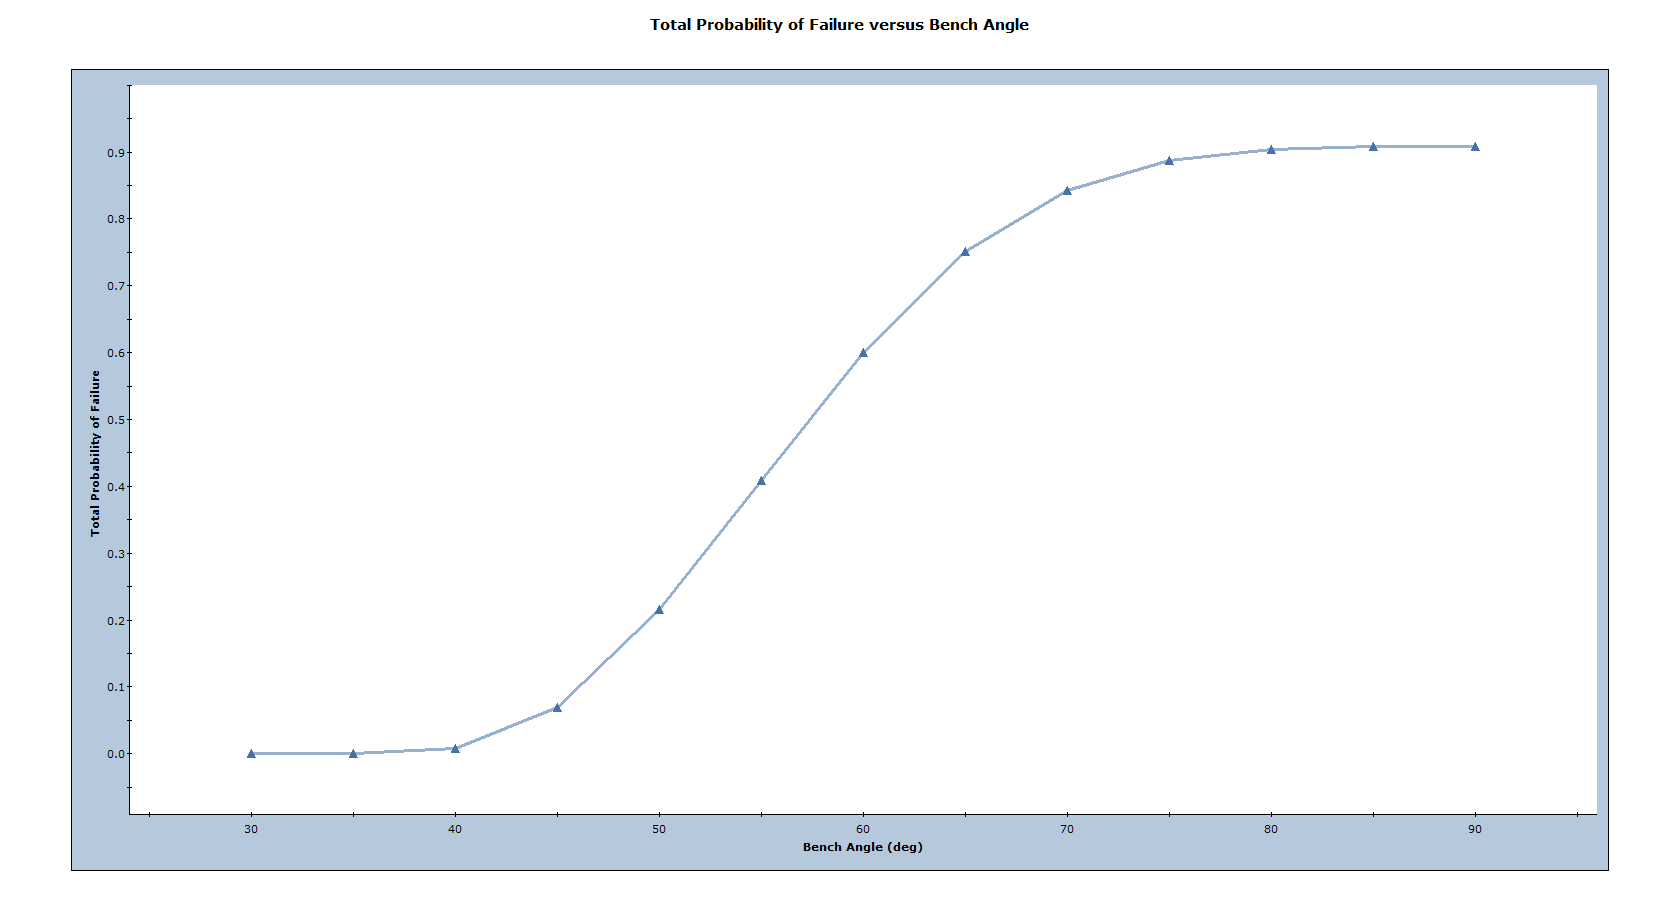
This shows that the Total Probability of Failure (and therefore the number of failed wedges) increases as the bench face angle increases from 30 to 90deg. This is logical as one would expect more failed wedges for a steeper slope.
The normalized frequency of failed wedges can also be calculated for each bench angle by normalizing the number of failed wedges for a given angle by the maximum number of failed wedges at a slope angle of 90 degrees. An optimum bench face angle can then be selected for a given acceptable level of failure. As an example, if 20% of failures are allowed to occur, a bench angle of 49 degrees would be recommended. This is the method published by Carvalho (2012).
Another important design parameter is the minimum bench width, which is defined as the sum of the backbreak distance and the spill width (calculated based on the equations in Gibson et al., 2006) for failed wedges. If this value is greater than the actual bench width, material may spill over the bench and move down the pit into the operating levels below. As both the backbreak distance and spill width will have a distribution of values, a minimum bench width is defined for each bench face angle according to the 80% Design Threshold specified for this analysis.
- Select: Statistics > Bench Design > Minimum Bench Width Plot
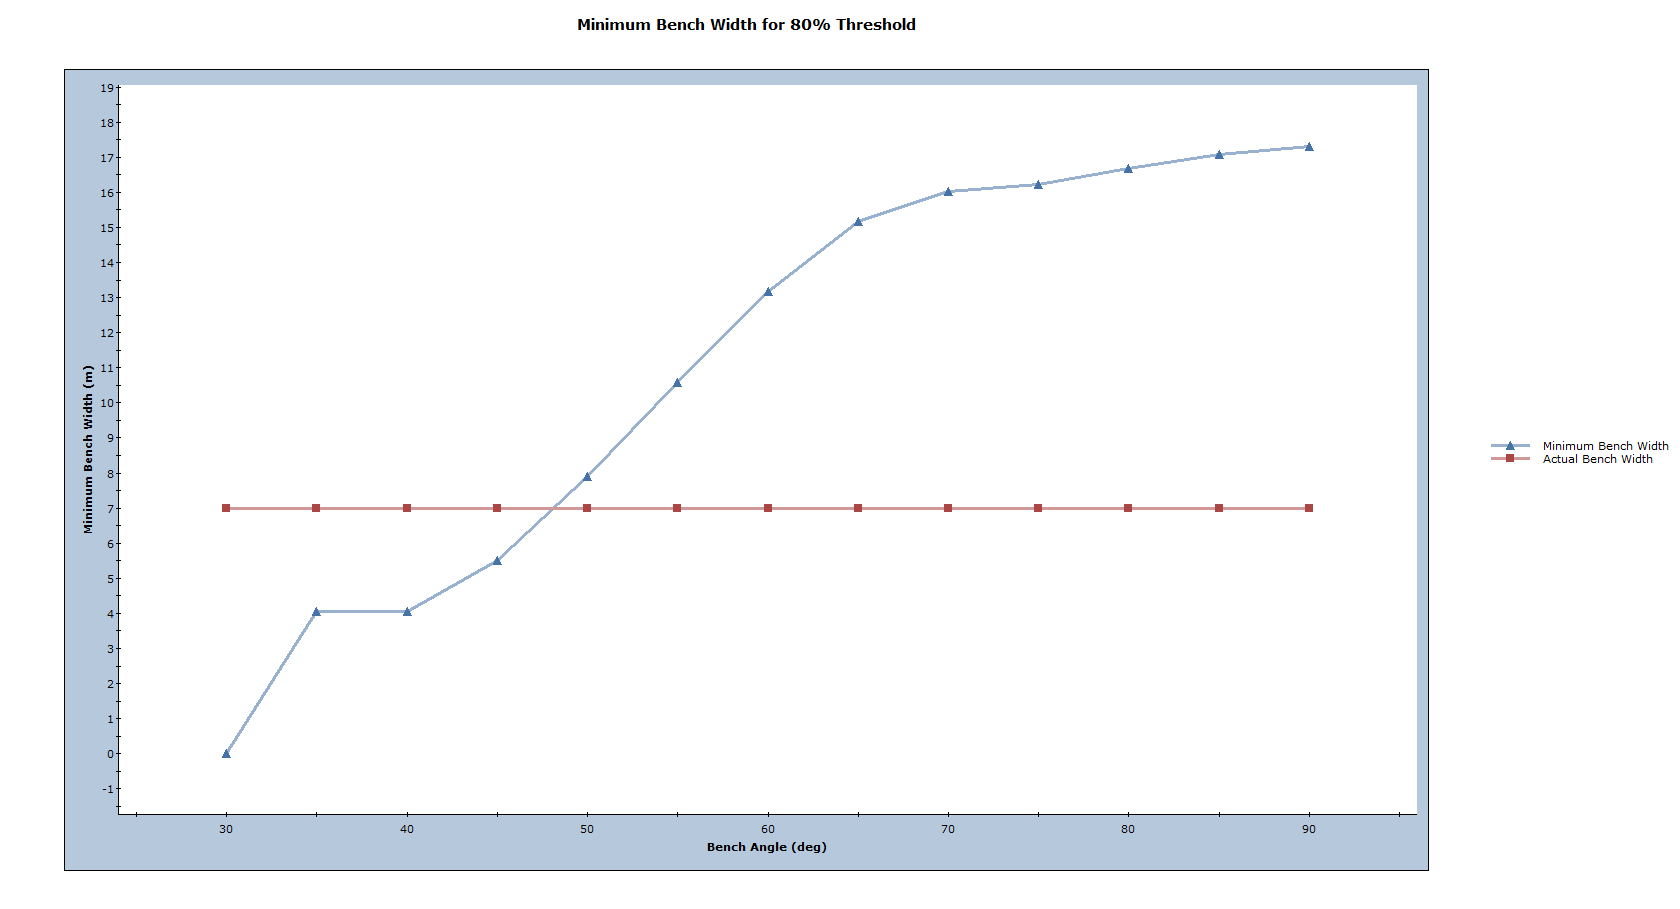
Based on this plot, a bench face angle greater than about 48deg would not be recommended as the minimum bench width is greater than 7m. As the bench face angle decreases, a greater usable bench width is expected.
6.2 QUANTITATIVE HAZARD ANALYSIS (QHA)
While the managed approach can be used to determine the number of failed wedges for each bench face angle, it does not provide information on the expected wedge size and amount of bench loss. To determine this, a Quantitative Hazard Assessment is needed (QHA). A QHA calculates the probability that the bench will fail to a certain backbreak distance. Such an analysis is useful on its own, but can also be combined with an estimate of the potential cost of bench loss to calculate the expected risk.
To interpret the output of the QHA, some terms must first be defined:
- Cell Probability of Occurrence: for a given backbreak cell, this is the number of valid wedges in the cell divided by the total number of samples (100,000 in this case).
- Cell Probability of Sliding: for a given backbreak cell, this is the number of valid wedges with a factor of safety less than 1.0 (failed) divided by the number of valid wedges.
- Cell Probability of Failure: for a given backbreak cell, this is the Probability of Occurrence for the cell multiplied by the Probability of Sliding for the cell.
When dealing with a QHA, information on joint persistence should be used. In this way, the location and size of the wedge is better determined.
First, close all graph views except the main 3D view.
To turn on persistence do the following:
- Select: Analysis > Bench Design
- To establish persistence characteristics for the joints, click Define beside the Persistence Settings option.
- When the Persistence Analysis dialog appears, turn on the definition of persistence for the failure plane by selecting the check box.
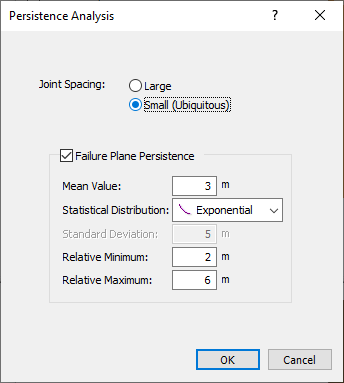
- Set the persistence Mean Value = 3 m.
- Set the Statistical Distribution = Exponential.
- Set the Relative Minimum = 2 m.
- Set the Relative Maximum = 6 m.
NOTE: This corresponds to an absolute minimum and maximum persistence value of 1 and 9 m respectively. The persistence will never be less than 1 m or greater than 9 m.
- Select OK to save your Persistence Analysis changes.
- Select OK button in the Bench Design Options dialog to save your Bench Design changes.
The program will take a minute or so to compute the bench design analysis.
The first measure to be examined is the Probability of Occurrence.
- Select: Statistics > Bench Design > Cell Probability of Occurrence Plot
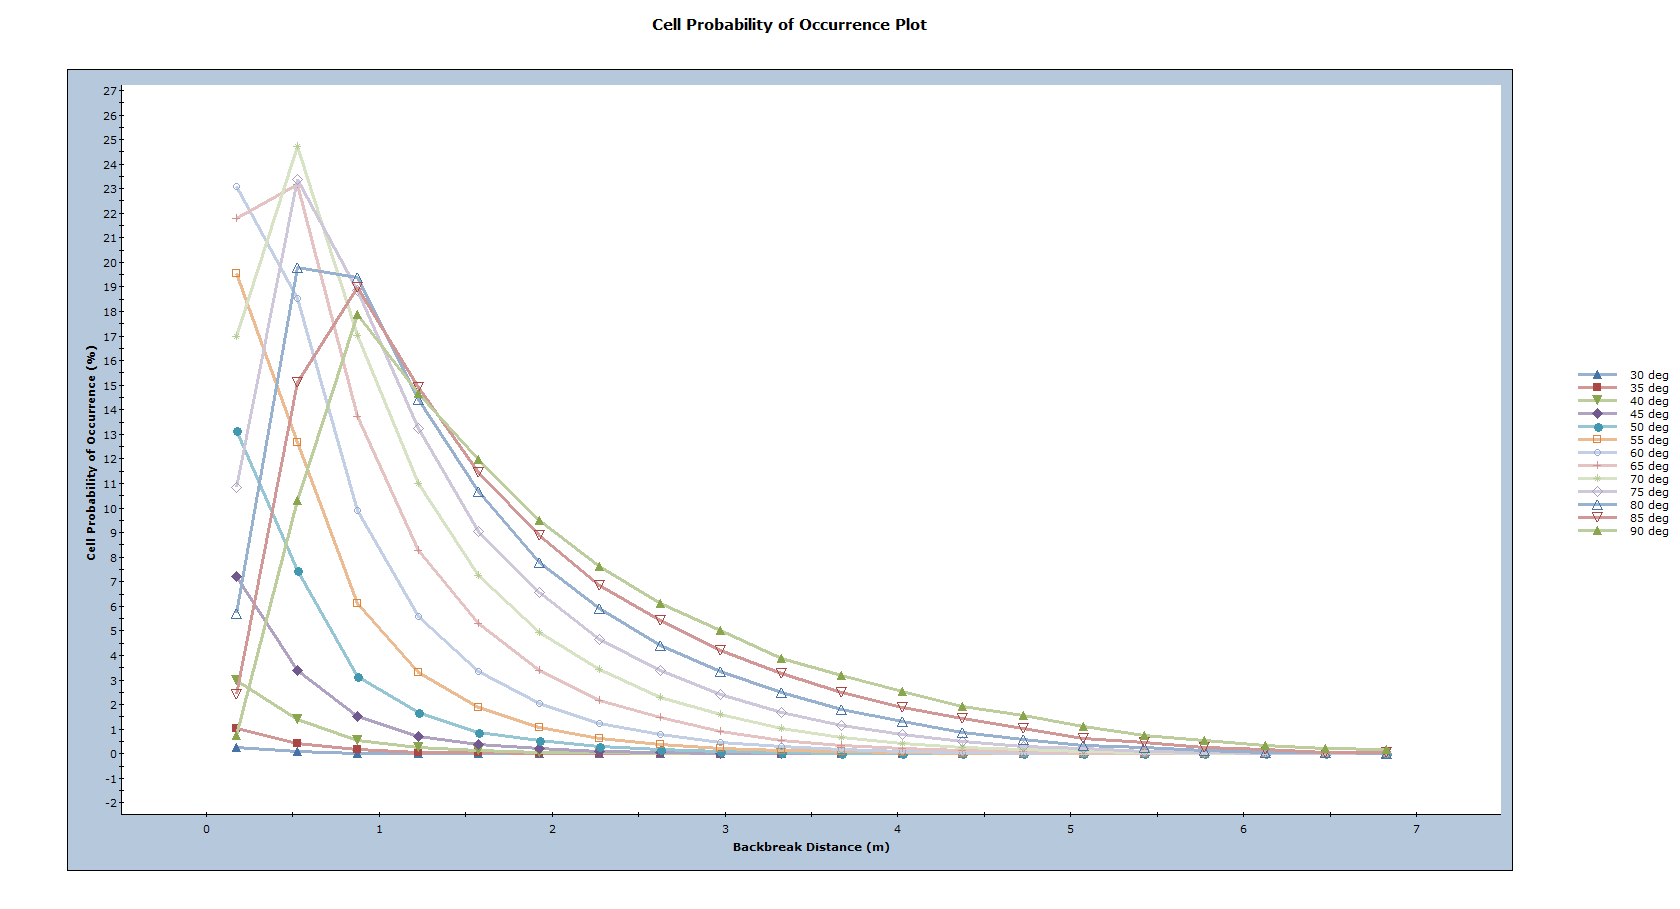
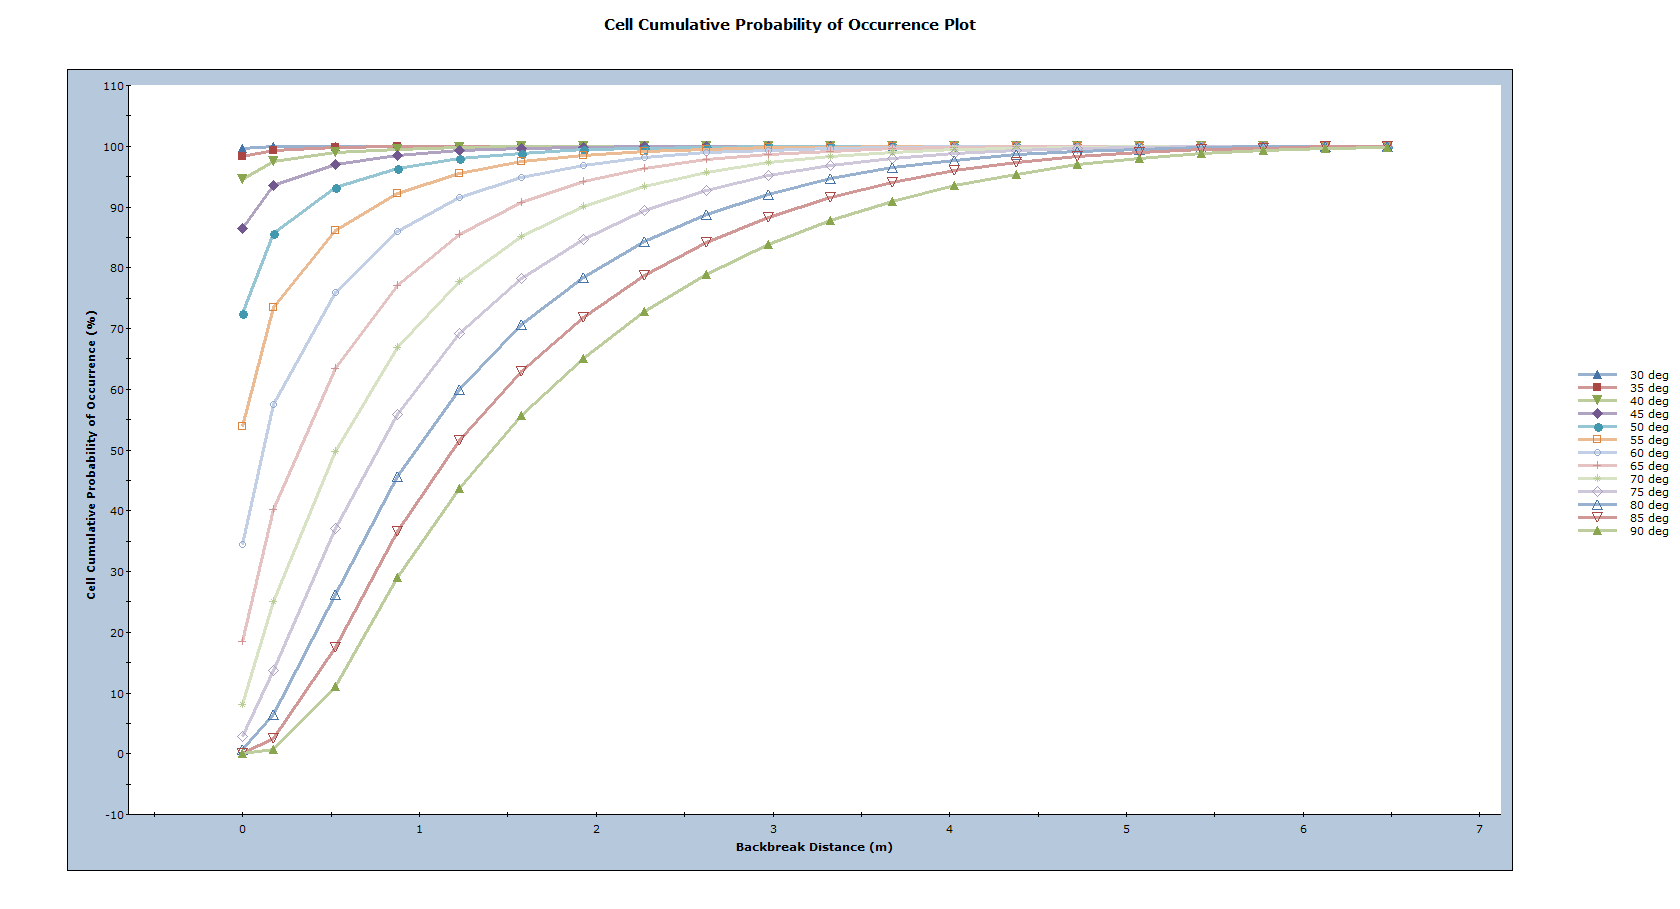
This plot shows that the most likely backbreak distance (represented by the peak of the curve) for each bench face angle is 0.5 to 1.0m. Larger wedges are also seen to be more common for steeper bench face angles, given the longer “tails” in the curve. This is more clearly demonstrated through a Cumulative Probability of Occurrence plot.
- Select: Statistics > Bench Design > Cell Cumulative Probability of Occurrence Plot
Now that the likelihood of different wedge sizes is better understood, the probability that a wedge with a given backbreak distance will slide (factor of safety < 1.0) can be examined.
- Select: Statistics > Bench Design > Cell Probability of Sliding Plot
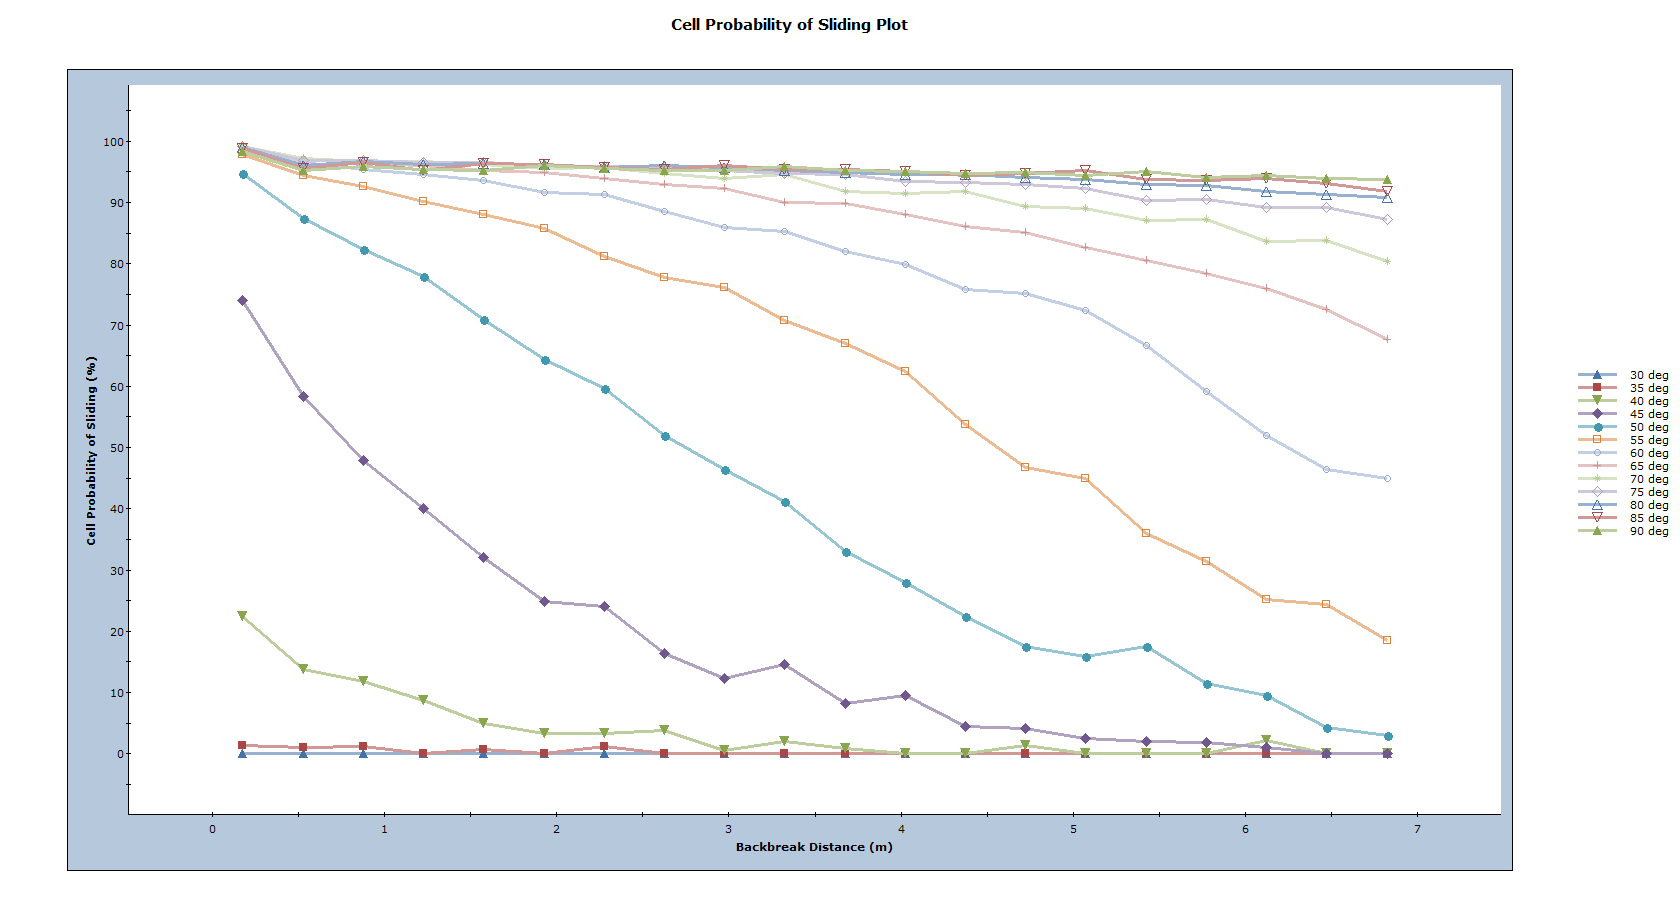
This plot shows that for shallow bench face angles (40 to 60deg) smaller wedges (which have smaller backbreak distances) have the greatest Probability of Sliding. For steeper bench face angles (75 to 90deg), the probability is seen to decrease initially, before a consistent minimum value is obtained. This indicates that for steeper bench face angles, larger wedges are a more significant concern when considering bench loss.
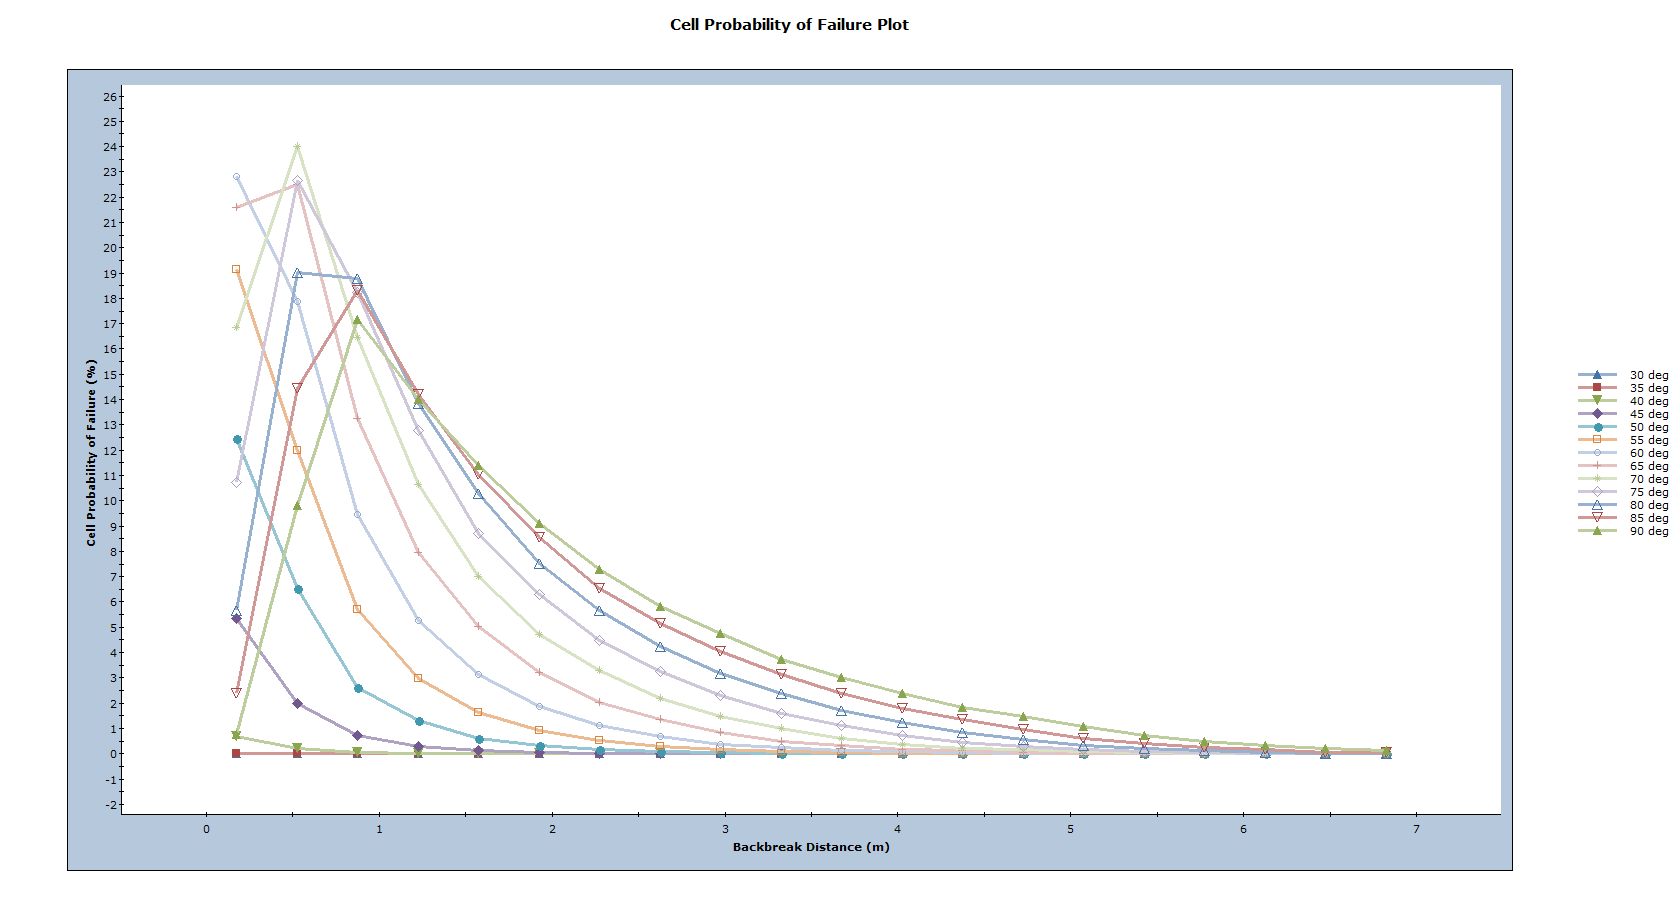
By multiplying the Probability of Occurrence and Probability of Sliding for each cell, a Probability of Failure for the cell can then be obtained. This helps to identify the backbreak distances that are most likely to fail when designing the open pit for each bench face angle. When multiplied by the Consequence of such a failure (typically represented as a cost), the risk for the slope can be assessed.
- Select: Statistics > Bench Design > Cell Probability of Failure Plot
This concludes the tutorial. You are now ready for the next tutorial, Tutorial 07 - Water Pressure in RocPlane.