11 - Back Analysis of Bolt Properties
This tutorial will demonstrate how to perform back analysis of material properties using sensitivity analysis or probabilistic analysis features in RocPlane.
Topics Covered in this Tutorial:
- Sensitivity analysis
- Probabilistic analysis
- Back analysis of bolt properties
Finished Product:
The finished products of this tutorial can be found in the Tutorial 11 Back Analysis of Bolt Property.pln4 file, located in the Examples > Tutorials folder in your RocPlane installation folder.
1.0 Introduction
Back analysis can be used to determine the required bolt strength to achieve a given safety factor. Sensitivity analysis can be used for back analysis of individual variables. Probabilistic analysis can be used for back analysis of multiple variables.
2.0 Model
If you have not already done so, run the RocPlane program by double-clicking the RocPlane icon in your installation folder or by selecting Programs > Rocscience > RocPlane > RocPlane in the Windows Start menu.
Let's start by opening the file from Tutorial 11 - Back Analysis of Bolt Property initial.pln4 in the Examples > Tutorials folder:
- Select File > Open

You should see the following model.
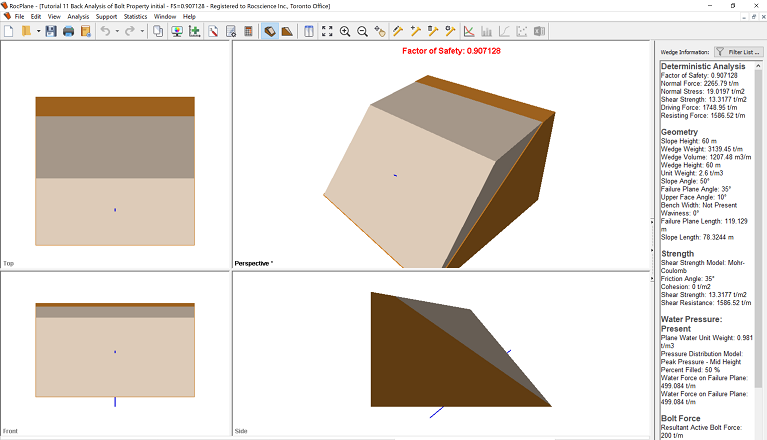
The current slope is failing with a bolt of 200 tonnes/m capacity.
3.0 Sensitivity Analysis
Variations in the variables for a Sensitivity analysis are set up in the Sensitivity Input dialog. To open the dialog, select Sensitivity Analysis on the toolbar or Analysis menu.
- Select Analysis > Sensitivity Analysis
 in the menu or click the icon on the toolbar.
 - Select the first check box in the dialog and enter From = 150 and To = 400.
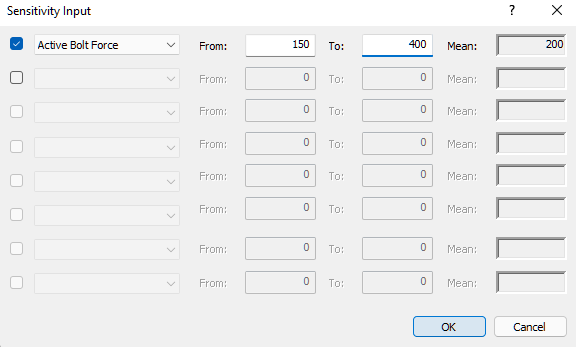
- Click OK.
The following graph is generated.
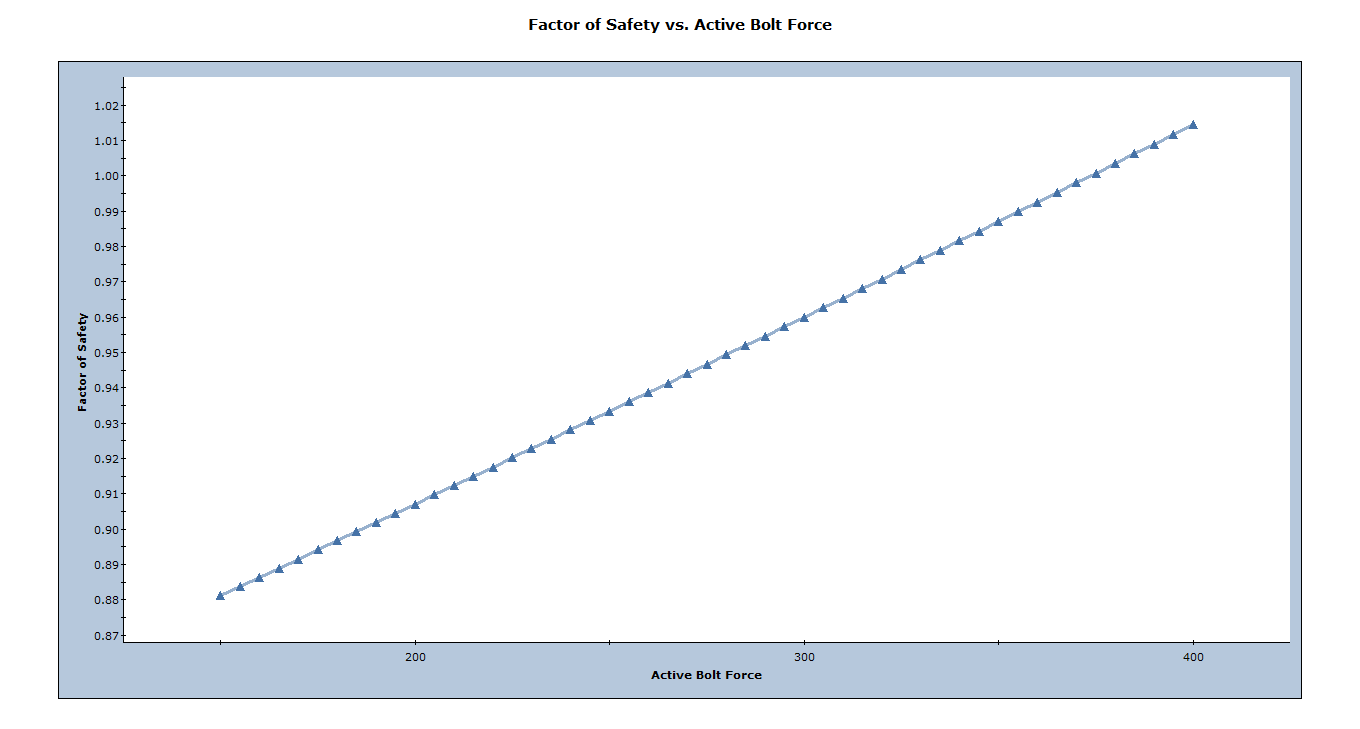
We want to know the value of active bolt force which corresponds to safety factor = 1. We can do this as follows. Right-click on the plot and select Sampler > Edit Sampler. Two dotted crossing lines should appear. Scroll along the plot line until you obtain a factor of safety as close to 1.0 as possible. The cursor should snap along the plot line.
We see that a value of 373.7 tonnes/m active bolt force corresponds to safety factor = 1.0. This assumes that all other slope parameters are exactly known and equal to otheir mean values.
To summarize: sensitivity analysis can easily be used for back analysis of individual variables. Just remember, when you are viewing a sensitivity plot of an individual variable, all other analysis variables are assumed to be constant and equal to their mean value. In general, this procedure may require some trial and error, for example if the desired safety factor is not within the output range of the sensitivity plot, you will have to adjust the allowable range of values of the variable and re-run the analysis.
4.0 Probabilistic Analysis
4.1 PROJECT SETTINGS
To run a probabilistic analysis, we need to first change the analysis type to probabilistic in the Project Settings dialog. To open the dialog:
- Select Analysis > Project Settings

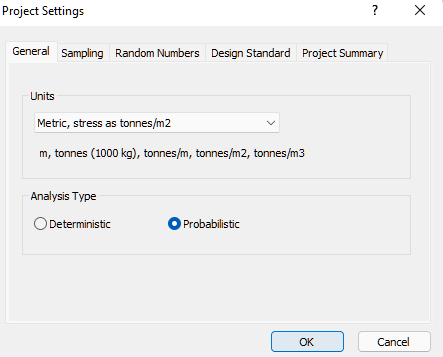
- Select the General tab,
- Set Analysis Type = Probabilistic.
- Click OK.
4.2 INPUT PROBABILISTIC DATA
Now we'll define the random variables for the Probabilistic analysis. For bolt properties, this is done through the Bolt Properties dialog. To open the dialog:
- Select Support > Bolt Properties

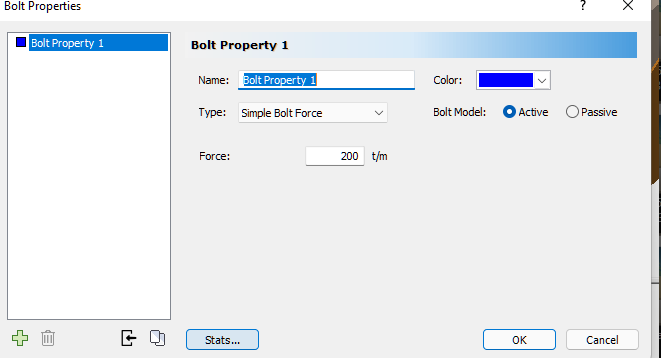
- Click on the Stats button
- In the Statistics dialog, specify a Normal distribution with a Mean of 300 and Std. Dev. of 50.
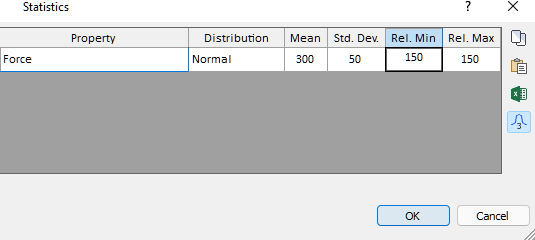
The relative min and max would be set to 3x the std. dev., which is 150, by default.
- Click OK to close the statistics input.
- Click OK again to exit the bolt properties dialog.
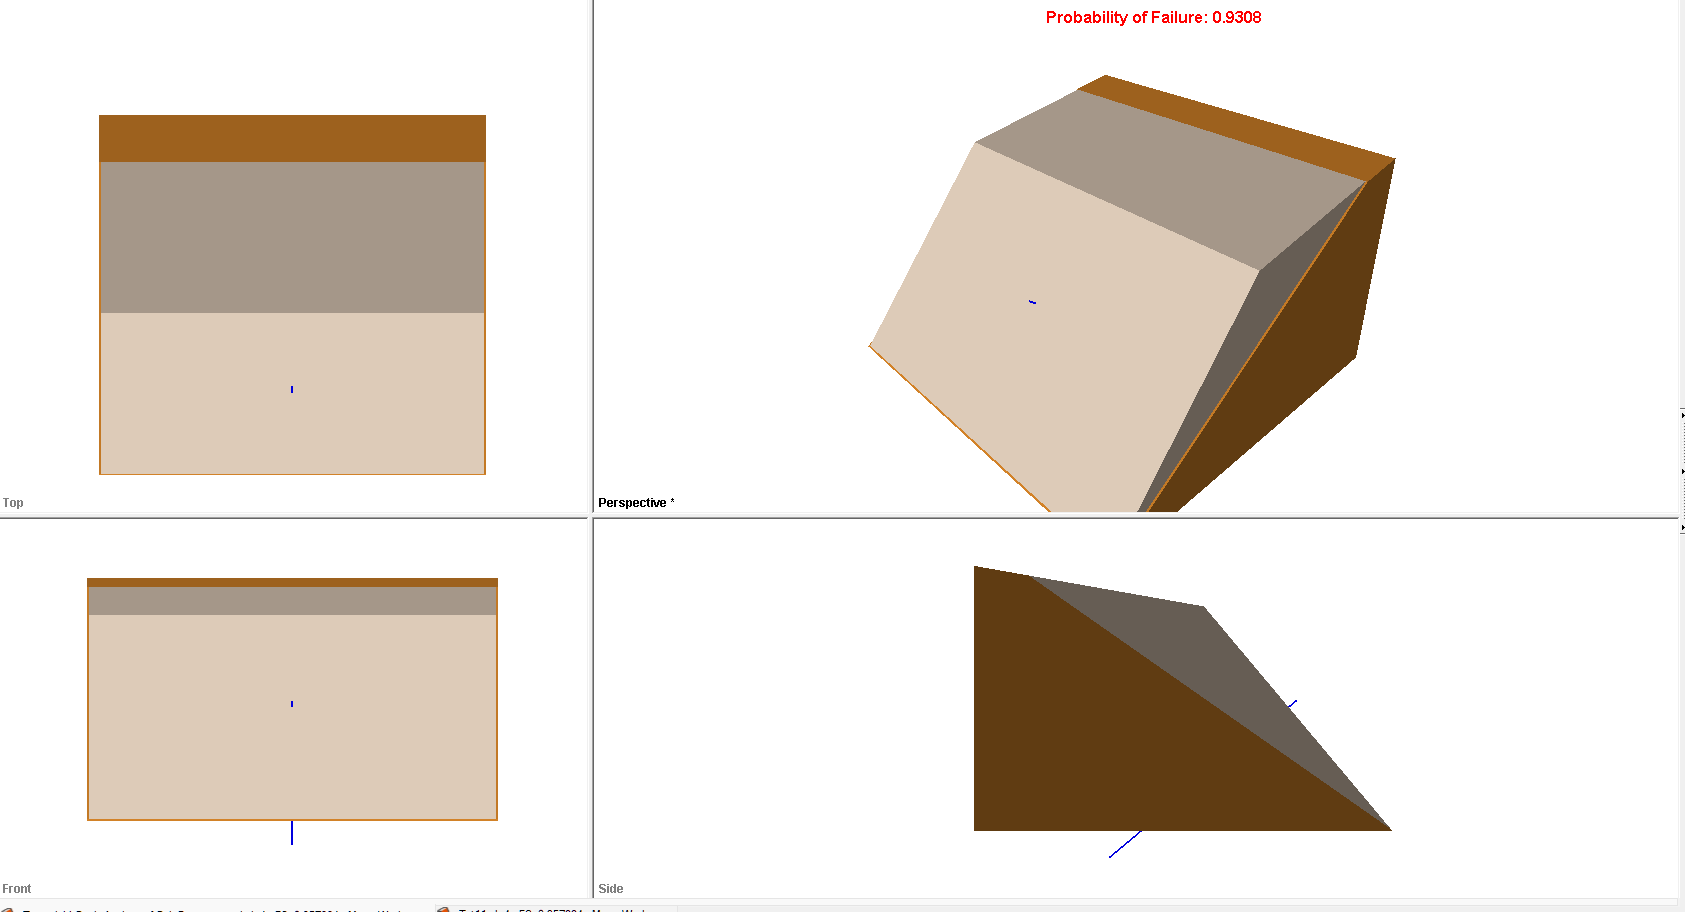
The probability of failure is 0.9308.
4.3 HISTOGRAMS
Now let's plot of a histogram of the Probabilistic analysis results, using the Histogram Plot Parameters dialog. To open the dialog:
- Select Statistics > Plot Histogram

- Keep the default settings and click OK. The following plot is generated.
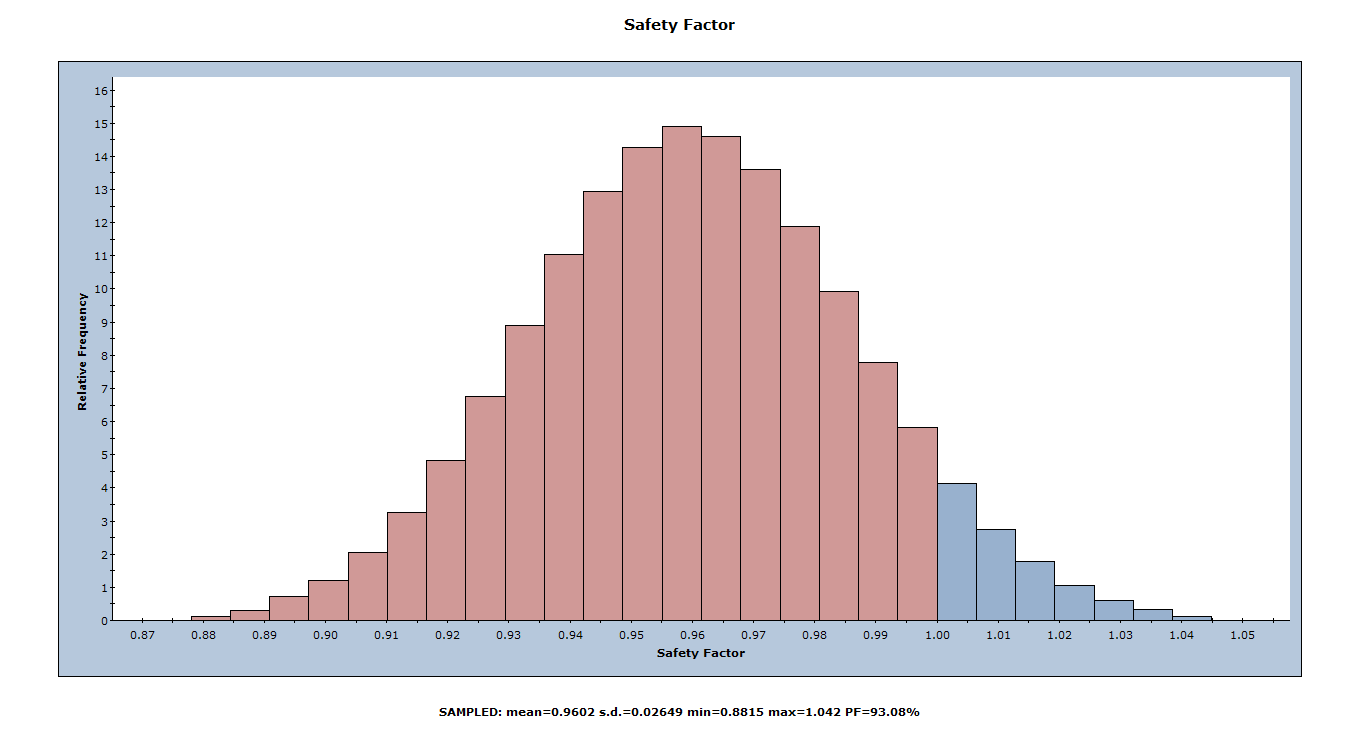
The red bars at the left of the distribution represent wedges with a Safety Factor of less than 1.0. We know from the previous sensitivity analysis that a 373.7 tonnes/m active bolt force is required to achieve a safety factor of 1.0. With a mean value of only 300 tonnes/m, over half of the wedges failed. We can also see at the bottom that the factor of safety is only 0.9602 with 300 tonnes/m bolt force. Let's plot the FoS against the bolt forces with a scatter plot.
4.4 SCATTER PLOTS
Scatter plots allow you to examine the relationships between analysis variables. You generate a Scatter plot using the Scatter Plot Parameters dialog.
- Select Statistics > Plot Scatter

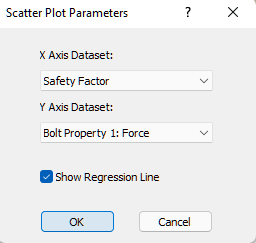
- In the Scatter Plot Parameters dialog, select Safety Factor vs. Bolt Property 1: Force.
- Select the Show Regression Line check box.
- Click OK.
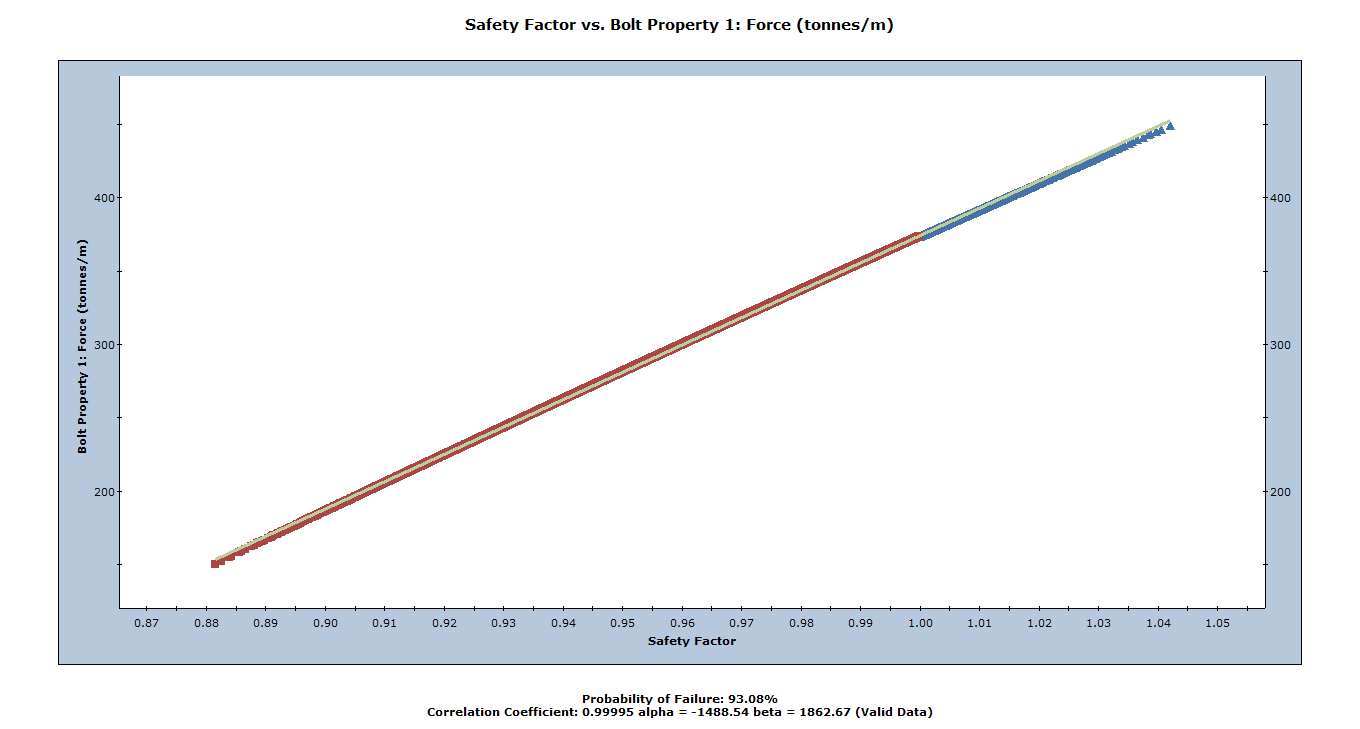
The Correlation Coefficient listed at the bottom of the plot indicates the degree of correlation between the two variables plotted. We can see that there is a strong correlation between the FoS and the active bolt force. That is very reasonable since the only statistical variable in this model is the active bolt force. We can also see that the relationship is almost linear.
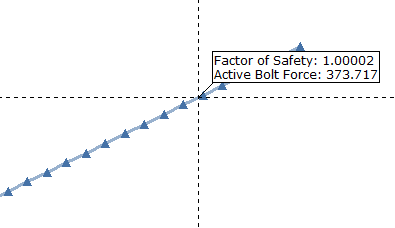
Let's turn on the sampler again and zoom in on where the FoS is 1.0.
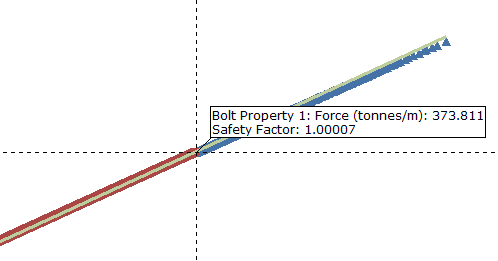
We see that a value of 373.8 tonnes/m active bolt force corresponds to safety factor = 1.0, which matches what we obtained from the sensitivity analysis. The only difference between the 2 analyses is the number of samples. Sensitivity analysis uses 51 samples and the probabilistic analysis uses 5000 samples.
This concludes the back analysis of bolt properties tutorial.