18 - Location and Persistence
1.0 Introduction
This tutorial demonstrates the use of Borehole Traverse Information and Distance column in Grid Data to compute spatial locations of joints in predefined X, Y, Z columns. The Persistence column is another predefined column and is used to indicate the maximum linear size of a joint in any direction.
Topics Covered in this Tutorial:
- Grid Data
- Borehole Traverses
- X, Y, Z Columns
- Persistence Column
Finished Product:
The finished product of this tutorial can be found in the Tutorial 18 Location and Persistence.dips8 file, located in the Examples > Tutorials folder in your DIPS installation folder.
2.0 Model
If you have not already done so, run DIPS by double-clicking on the DIPS icon in your installation folder. Or from the Start menu, select Programs > Rocscience > DIPS > DIPS.
If the DIPS application window is not already maximized, maximize it now, so that the full screen is available for viewing the model.
We will start from an initial DIPS file which already has Traverse Information and Grid Data populated.
- Select File > Recent Folders > Tutorials Folder
 option from the menu.
 - Open the Tutorial 18 Location and Persistence_initial.dips8 file.
You should see the Stereonet Plot View shown in the following figure.
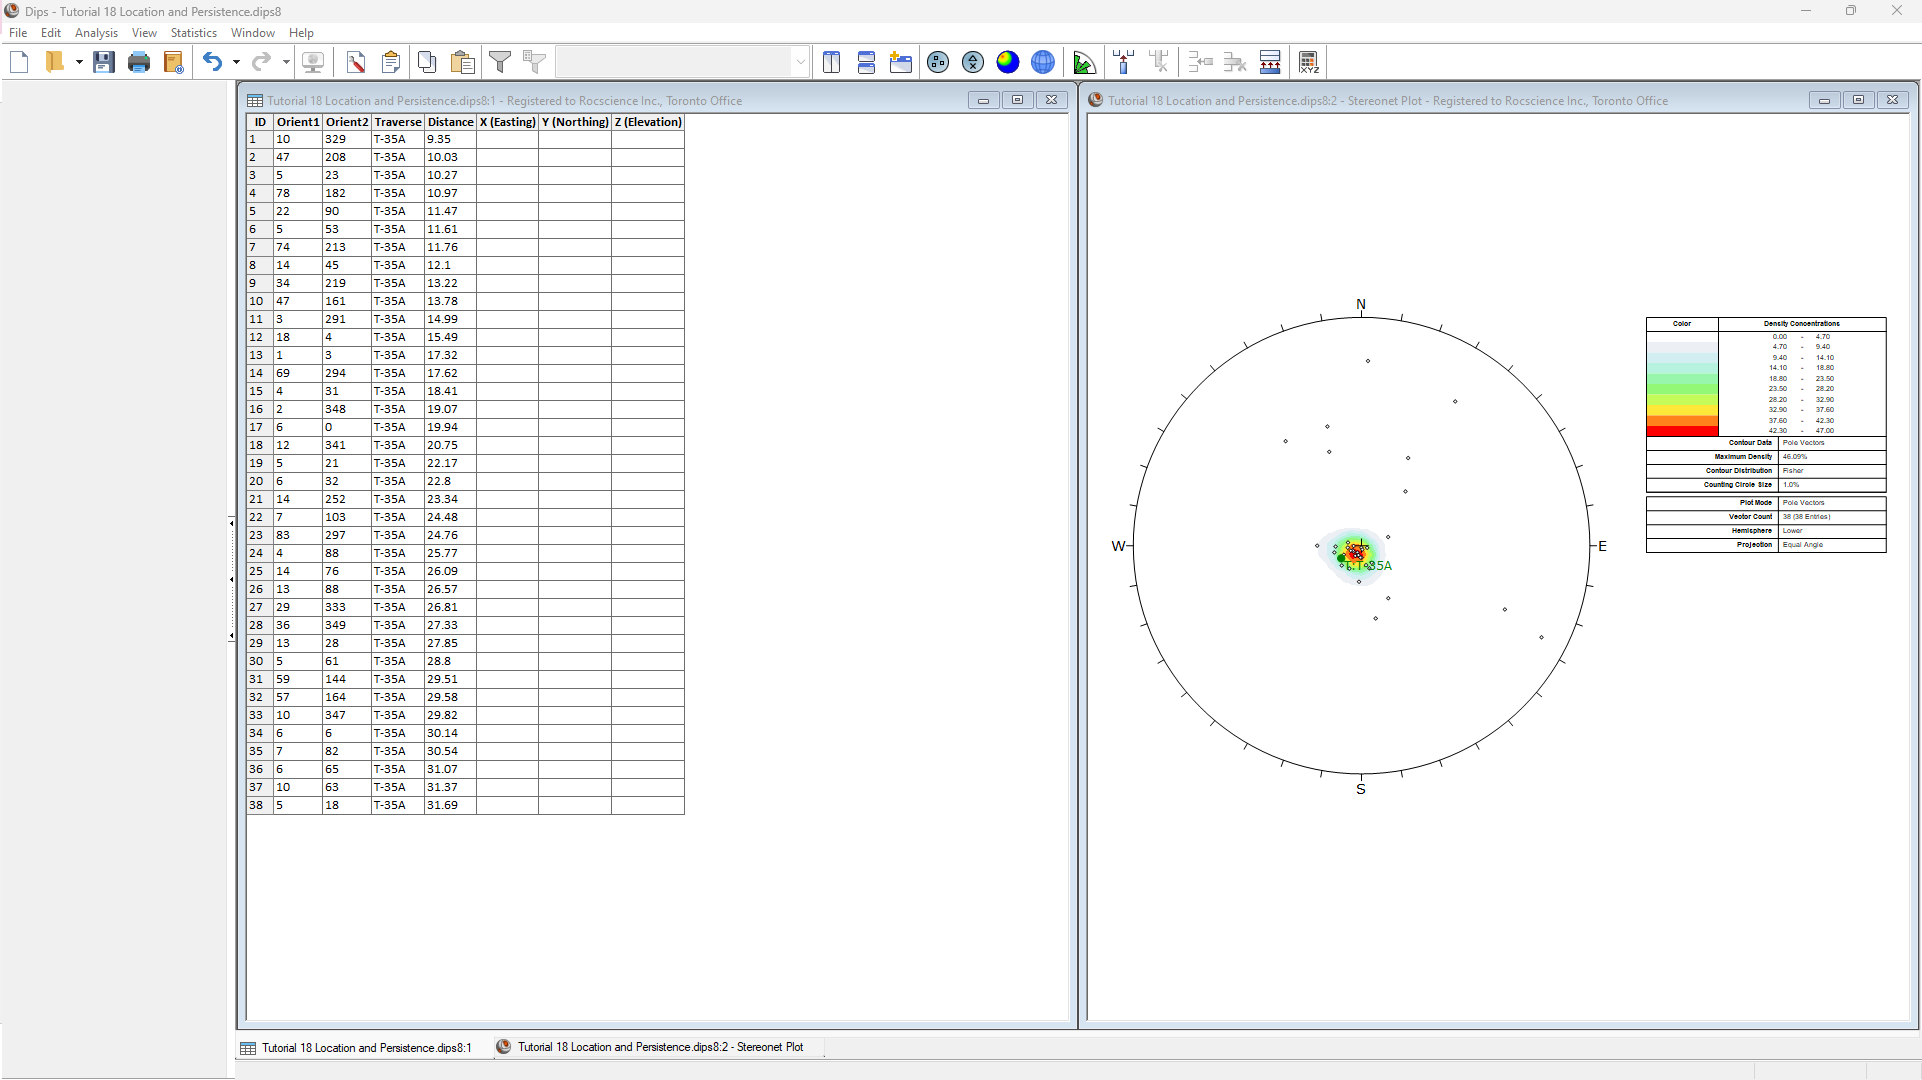
This file contains data from a single Linear BH Televiewer Traverse (T-35A) with 38 recorded measurements.
2.1 Project Settings
Review the Project Settings:
- Select Analysis > Project Settings or click the Project Settings
 icon in the toolbar.
 - Under Orientation:
- Global Orientation Format = Dip / Dip Direction.
- Declination = 0 degrees.
- Units = Metric. Length units used for Distance and X, Y, Z coordinates are in meters.
- Under Traverses:
- Note that 5 Linear BH Televiewer Traverses are defined. We will review the Traverse Information in the next section.
- Under Columns:
- Note that the Distance Column and X, Y, Z Columns checkboxes are selected and disabled. Whenever any borehole traverses (e.g., Linear BH Oriented Core, Linear BH Televiewer, Curved BH Oriented Core, Curved BH Televiewer) are defined, the Distance column and X, Y, Z columns are automatically added to the Grid Data. The X (Easting), Y (Northing), and Z (Elevation) columns always come after the Quantity, Traverse, Distance, and Set columns, and before any user-defined columns.
- Select the Persistence Column checkbox to add a Persistence column to the Grid Data. The Persistence column is always the last of any predefined columns, and before any user-defined columns.
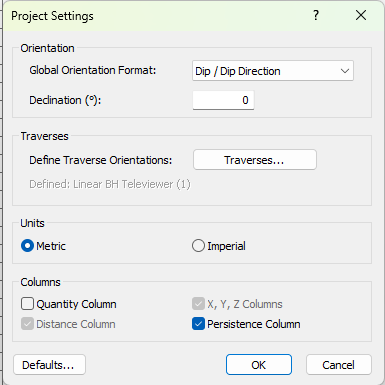
Project Settings dialog
- Click OK to save the settings and close the Project Settings dialog.
The Grid Data now has the following predefined columns:
- Orient 1
- Orient 2
- Traverse
- Distance
- X (Easting)
- Y (Northing)
- Z (Elevation)
- Persistence
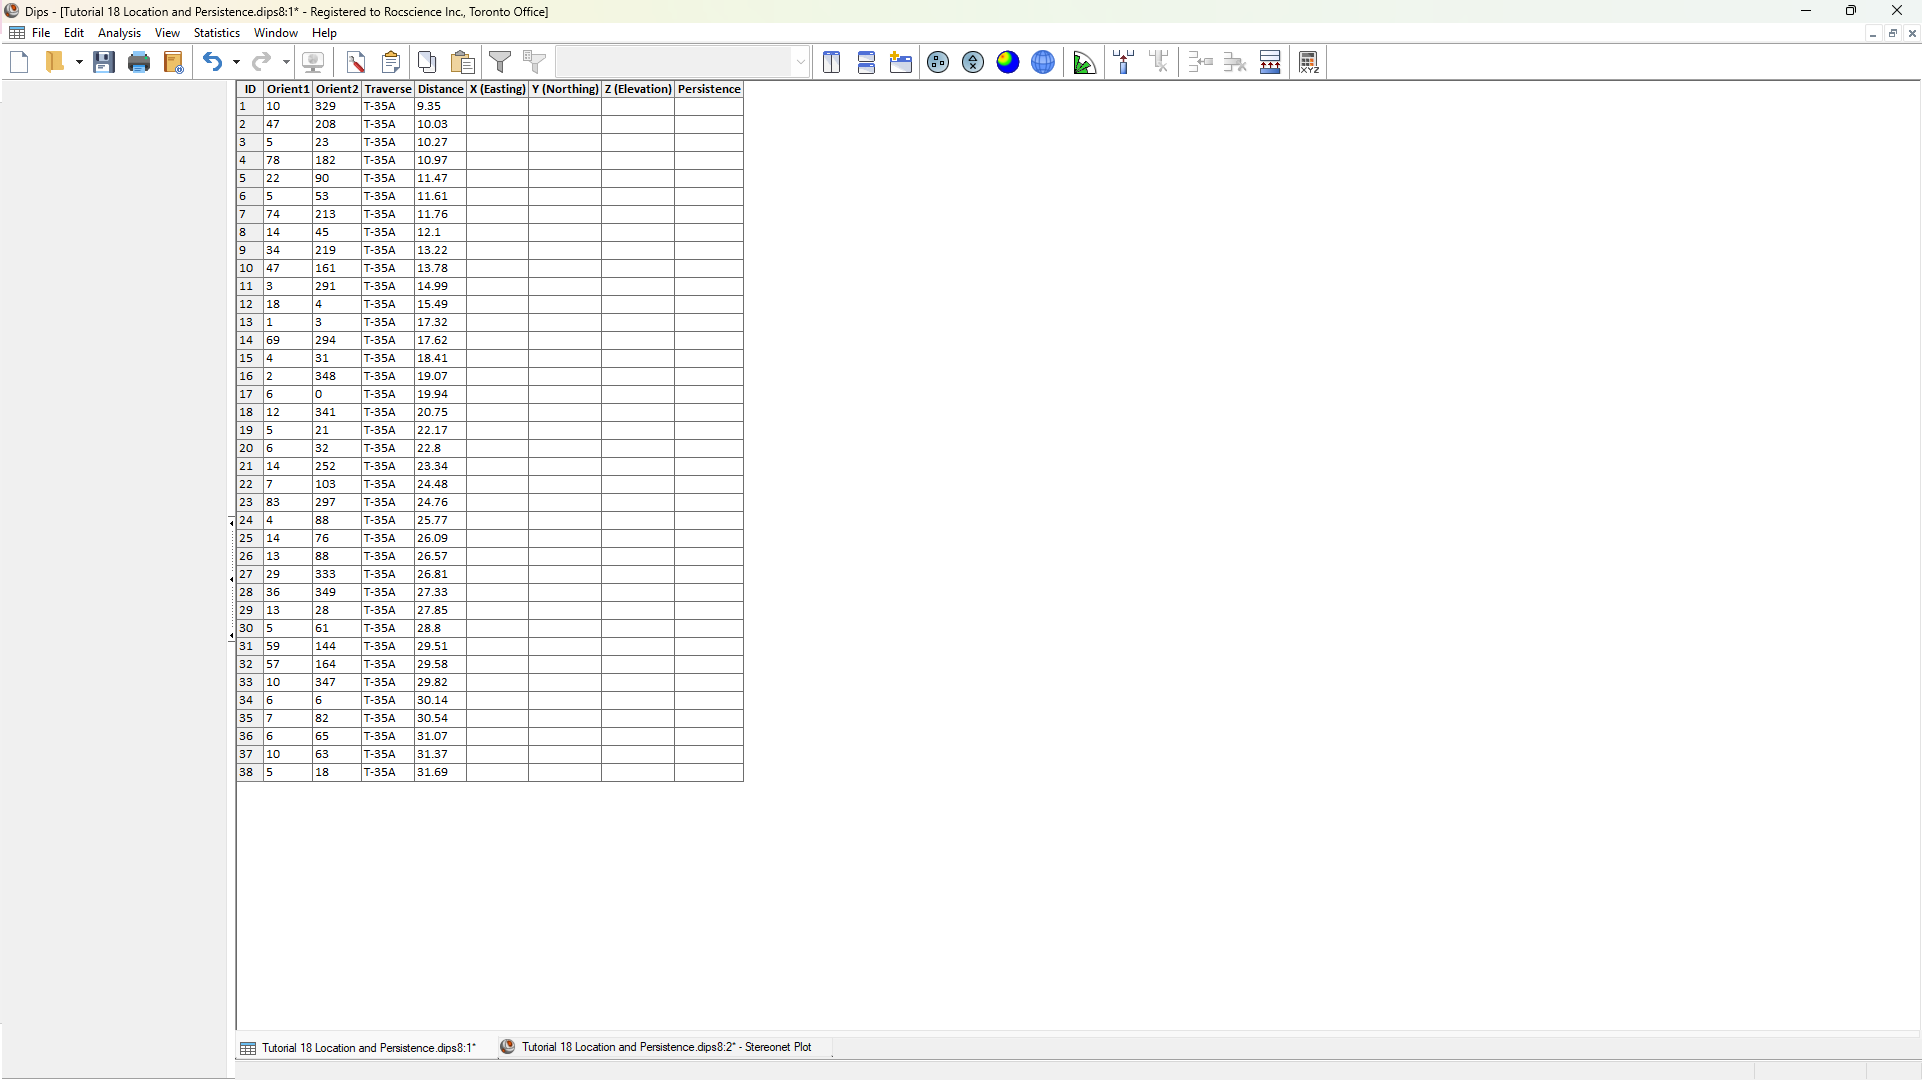
The Persistence column is added after all other predefined columns.
2.2 Traverse Information
Review the Traverse Information:
- Select Analysis > Traverses from the menu.
- In the Traverse Information dialog, navigate to the Linear BH Televiewer where one traverse is already defined.
- In the Traverses tab:
- ID = T-35.
- Data Format = Dip / Dip Direction. NOTE: Since all measurements are taken on Traverse T-35A, Orient1 is Dip and Orient2 is Dip Direction in the first two columns of the Grid Data.
- Traverse Format is always Trend/Plunge for a Linear BH Televiewer traverse.
- Trend = 238.
- Plunge = 78.
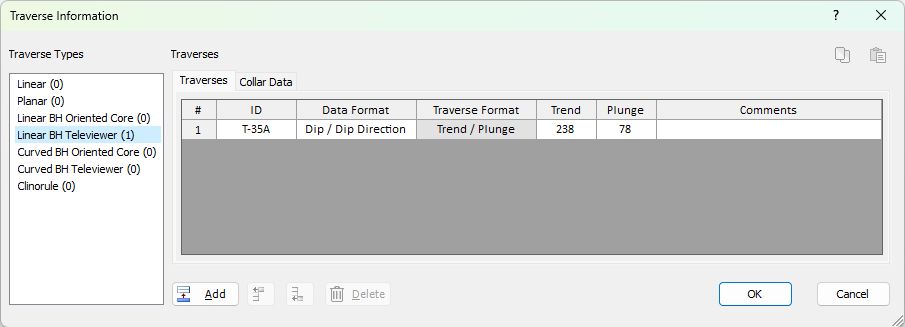
Traverse Information dialog with one Linear BH Traverse (Traverses tab)
- In the Collar Data tab:
- ID = T-35. For each Traverse entry defined in the Traverses tab, a corresponding Collar Data entry must also be defined with matching ID.
- X = 2381.91.
- Y = 50386.6.
- Z = -80.241.
- Total Depth = 31.69.
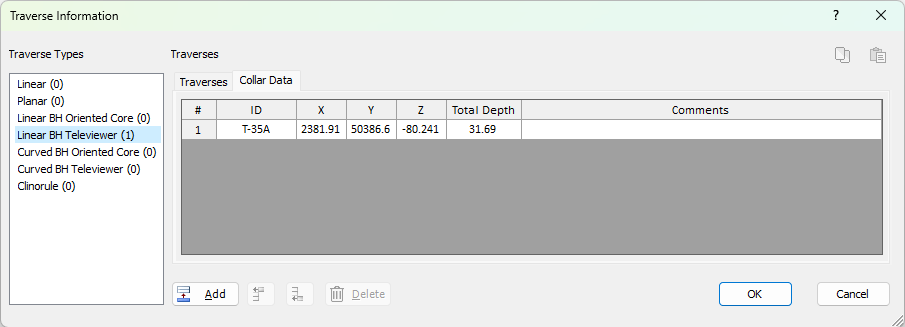
Traverse Information dialog with one Linear BH Traverse (Traverses tab)
- Click OK to close to dialog.
The Collar Data provides a spatial reference for the borehole. The X, Y, Z defines the start point of the borehole.
- For a Linear Borehole, its traversal starts at the Collar X, Y, Z and traverses in the orientation defined by either Trend/Plunge (Televiewer) or Orient 2/Orient3 (Oriented Core) until the Total Depth (i.e., total length of the traverse).
- For a Curved Borehole, its traversal starts at the Collar X, Y, Z and traverses in the orientations and segments defined by the Survey Data Trend, Plunge, and Distance values until the Total Depth (i.e., total length of the traverse).
3.0 Location
The X (Easting), Y (Northing), Z (Elevation) columns were added to the Grid Data in order to record spatial information about the measurements in DIPS. The X, Y, Z values represent a point on the planar structure. The X (Easting), Y (Northing), Z (Elevation) columns can be populated either manually (if measurements are georeferenced) or using the Compute Locations option.
In order to use the Compute Locations option, the following must exist:
- Borehole Traverse Type(s) (e.g., Linear BH Oriented Core, Linear BH Televiewer, Curved BH Oriented Core, Curved BH Televiewer) defined in Traverse Information dialog.
- Traverse column in Grid Data
- Distance column in Grid Data
- X, Y, Z columns in Grid Data
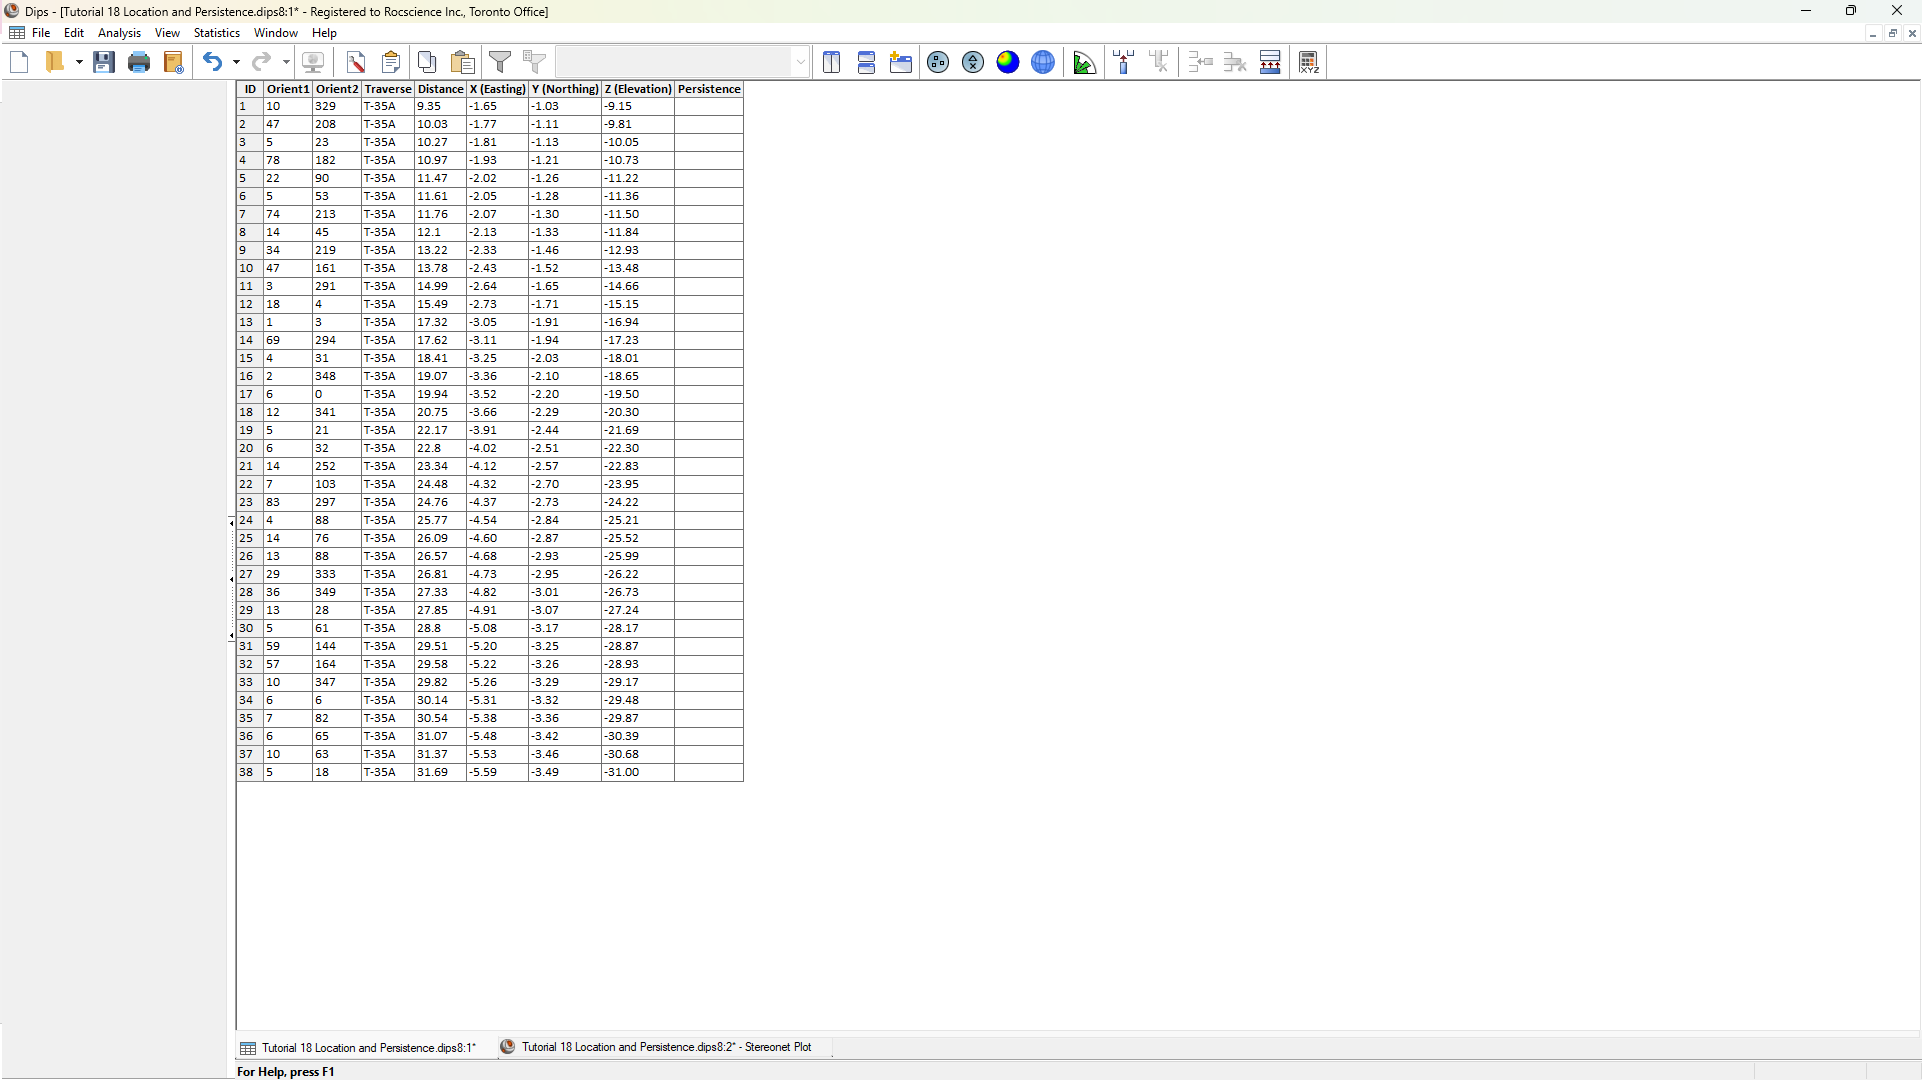
Since we have all of the above requirements, we can use the Compute Locations options to compute and populate the X (Easting), Y (Northing), Z (Elevation) columns.
To compute locations:
- Navigate to the Grid Data View.
- Select Analysis > Compute Locations or click Compute Locations
 in the toolbar.
The X (Easting), Y (Northing), Z (Elevation) columns are computed and automatically populated. See the Compute Locations topic for more information.
4.0 Persistence
The Persistence column is an optional predefined column added to the Grid Data to record size information about the measurements in DIPS. Joint Persistence represents the maximum joint length as measured in any direction on a planar structure. In some cases, Trace Length measurements may be more readily available (e.g., recorded on a scanline or mapped on the slope surface through photogrammetry). In either case, the Persistence is the upperbound to defining the maximum dimensions of the structure.
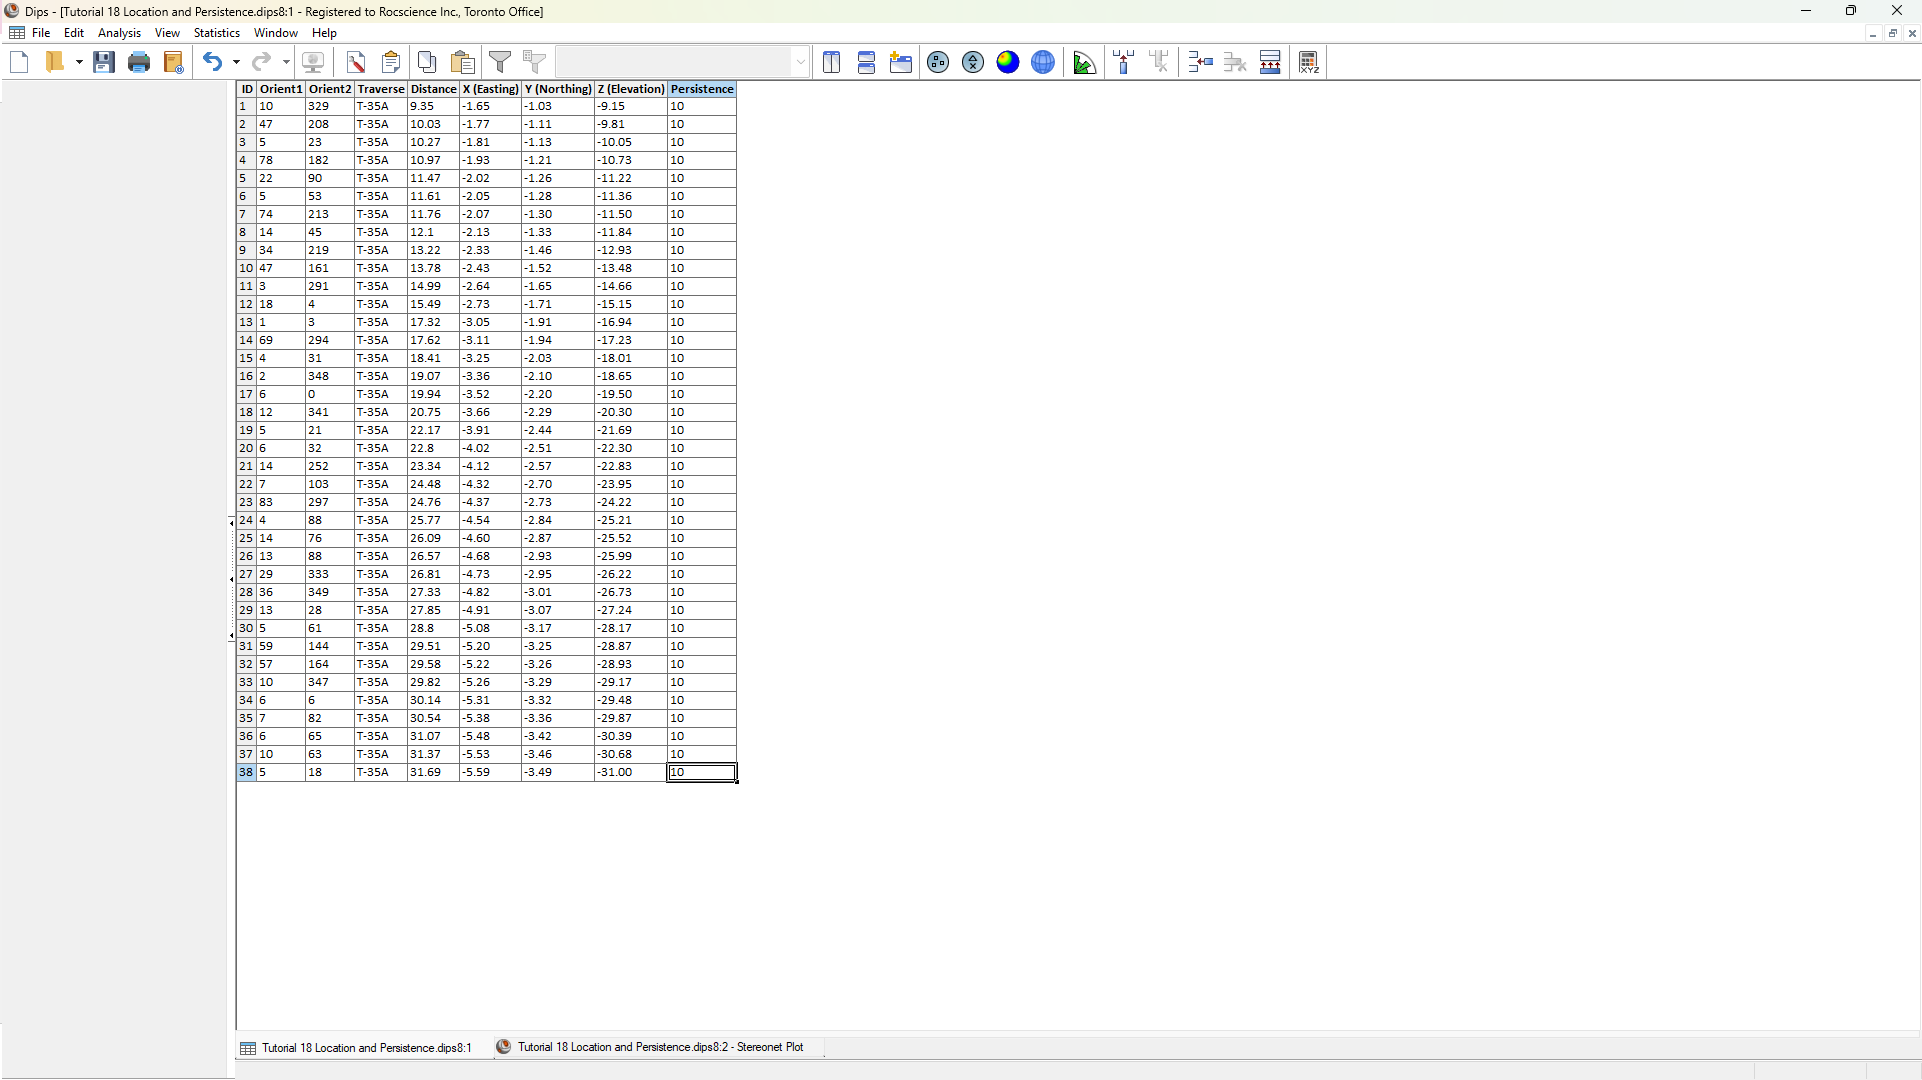
To define the Persistence column:
- Navigate to the Grid Data View.
- Enter a Persistence value of 10 for all measurements.
5.0 RocSlope3 Integration
The (processed) Dip, (processed) Dip Direction, X (Easting), Y (Northing), Z (Elevation), and Persistence columns (once established), provide the inputs to Define Measured Joints in RocSlope3. See the Import from DIPS topic in the RocSlope3 User Guide for more information on DIPS to RocSlope3 integration.
This concludes the tutorial.